Chapter 2 background – expected DNA band sizes
Helping students understand how to determine DNA fragment sizes following RE digestion reactions makes for a great Team Think Tank. Please check out Team Think 3: Restriction Enzyme Digests located in the Teacher Resources section. If you wish to learn more about our Team Think Tanks, click here.
What are your expected DNA band sizes?
This question is actually quite complex and requires knowledge of the DNA sequence for both pET26b plasmid and the E. coli folA gene (and sequence of the DNA primers used in the PCR). OK, let’s unpack this, starting with the pET26b plasmid.
The pET26b plasmid sequence can be sourced from many locations. One such location is the AddGene portal: pET26b sequence
The sequence can be processed using molecular cloning software. There are many molecular cloning software programs available, and some are free to use. We recommend SnapGene. This is a paid software but it does have a basic, freeware version called SnapGene viewer.
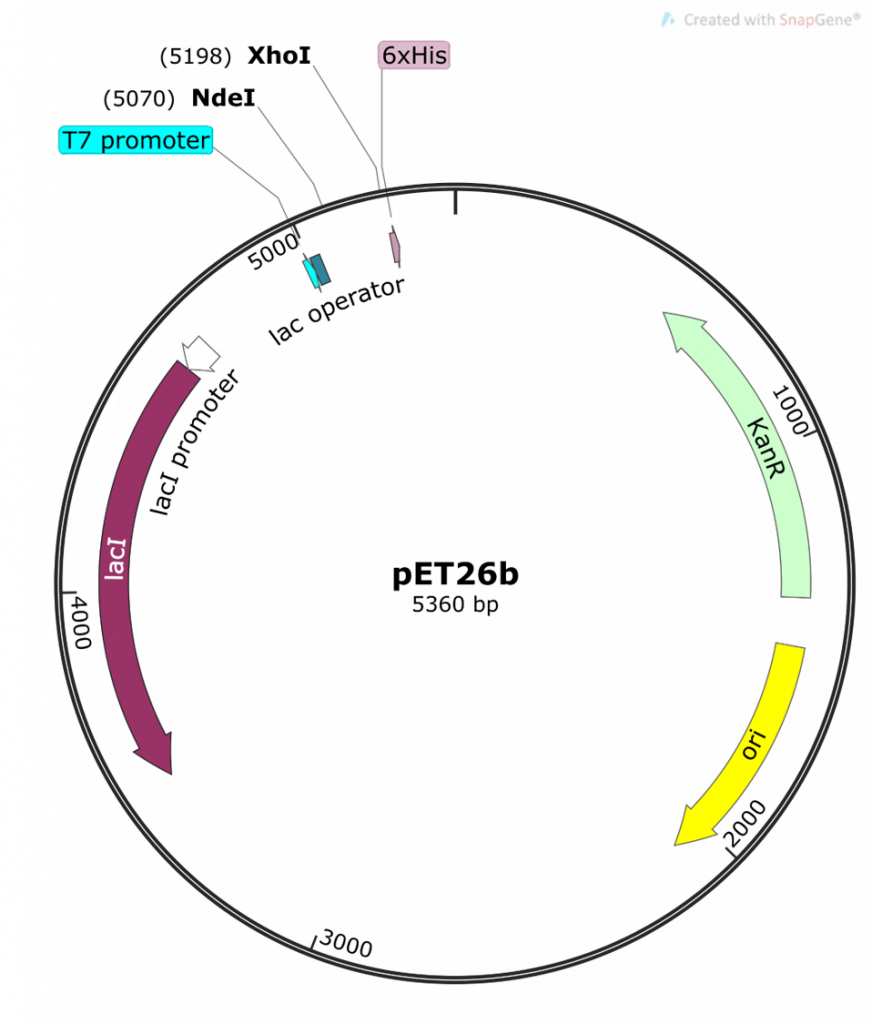
This is a map generated from the actual pET26b DNA sequence. Note the different features of the plasmid and their base pair (bp) location on the plasmid. The pET26b plasmid is a circular, covalently-closed double-stranded DNA, 5360 bp in length.
The main features are:
- the T7/lac promoter – this is the main event! An inducible promoter (i.e. we control when this promoter is off or on). We are cloning our folA gene downstream of this promoter.
- NdeI and XhoI – the two Restriction Enzymes (RE) we are using to clone our folA gene downstream of the T7/lac promoter. Note the bp position in brackets beside each RE. This indicates the bp position of the cut site for each RE.
- His 6x-tag – this is an engineered tag consisting of the codon for the amino acid histidine repeated six times. Why? Because this His 6x-tag will be used later for protein purification.
- kanR gene, selectable marker – the kanamycin resistance gene is situated downstream of a constitutive promoter (i.e. always on) and is used as a selectable marker for bacterial transformations.
- Ori – the origin of replication for the pET26b plasmid
- lacI – a gene that expresses the Lac repressor, a protein used to control the T7/lac promoter.
And so, based on this map we can say the following:
Full length pET26b plasmid = 5360 bp
pET26b plasmid previously digested with NdeI and XhoI =? To answer this question let us zoom in on the pET26b plasmid map and look at the actual sequence surrounding the NdeI and XhoI restriction enzyme DNA recognition sites:
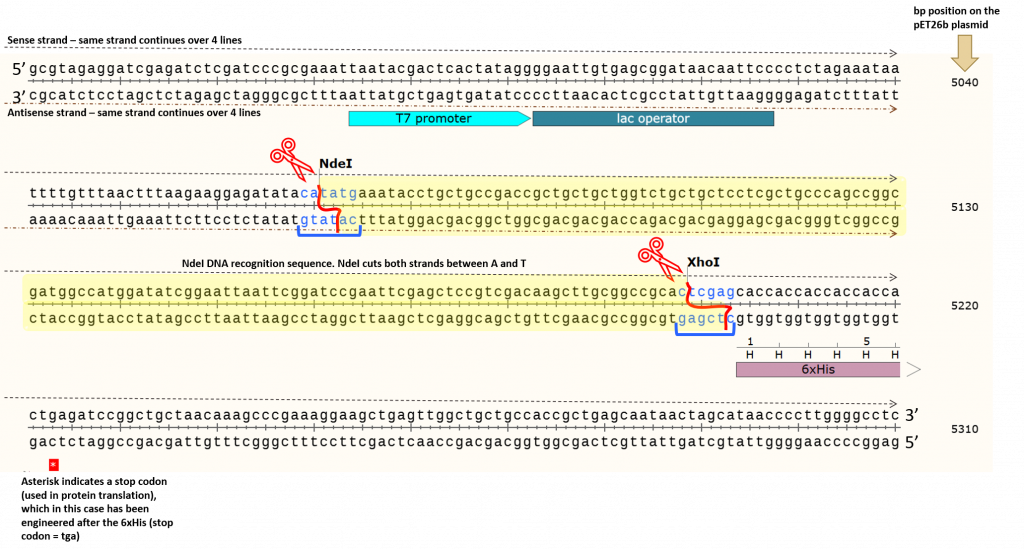
The yellow highlighted area contains the DNA fragment cleaved out following NdeI/XhoI digestion of the pET26b plasmid. We can count the number of base pairs (bp) in this area to determine the fragment size cleaved out of the plasmid. We typically report the base pair sizes relative to the sense strand (5’ to 3’) only. This is to standardize our reporting system, however, we need to keep in mind that we are cleaving both strands of the DNA using restriction enzymes NdeI and XhoI. If we count base pairs (using the bp numbers on the right as a guide) we can see that the NdeI cuts at exactly the 5070 bp position (remember, we report the bp position relative to the sense strand only). We can physically count the base pairs in the yellow highlighted area (there are 128 bps) before we reach the first “c” in the XhoI DNA recognition site, which cuts at exactly bp 5198. This process for determining DNA fragment sizes works well, but it is time-consuming. Instead, we can take a shortcut based on the information provided in the original, pET26b circular plasmid map shown above. The position of the restriction enzymes (NdeI and XhoI) relative to the T7/lac promoter is clearly indicated… but so are the base pair cut sites! Woohoo!!!!!! Note the numbers in brackets beside each restriction enzyme. These are the same bp positions as we determined using the actual sequence. Well now, this is just simple math. Let’s take a look using this basic diagram or our pET26b plasmid.
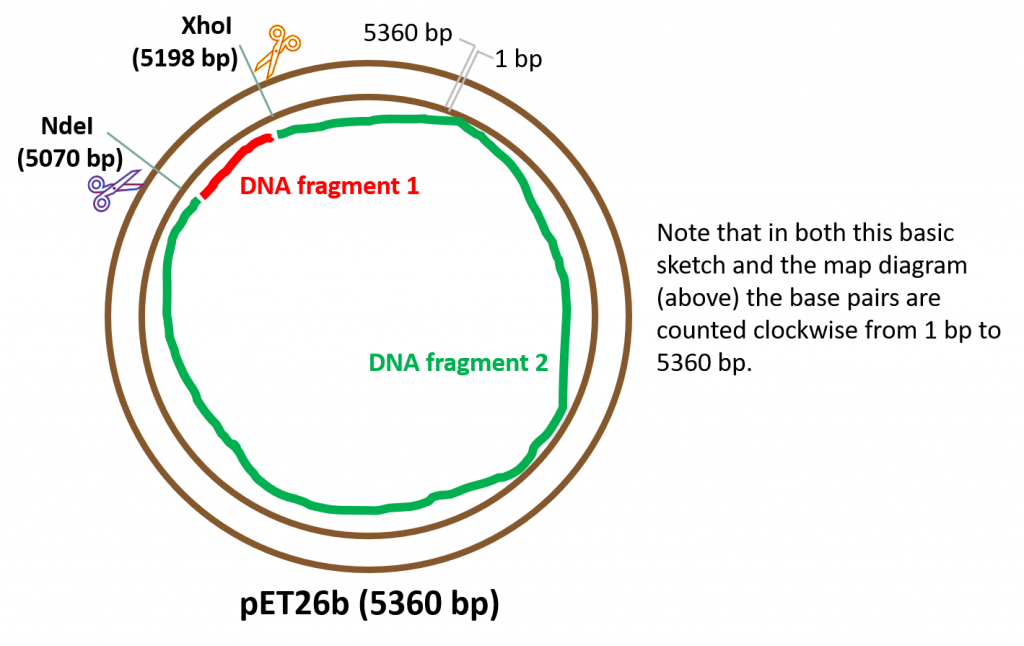
Upon successful cleavage of both strands of DNA using restriction enzymes NdeI and XhoI: We will obtain two, linear DNA fragments. Why two? Because we are cutting a circular, covalently closed piece of DNA. Based on this diagram, we obtain the following DNA fragments following cleavage with our RE’s:
DNA fragment 1 – small fragment (yellow highlighted section in our sequence diagram, above). To calculate the fragment size we simply need to subtract the bp difference between the two REs: 5198 bp – 5070 bp = 128 bp.
DNA fragment 2 – a large fragment (and our desired DNA fragment as it contains all the features of the plasmid. This is the fragment we will use to “glue” our folA gene). The size of this fragment can be calculated in multiple ways, but the easiest way is to subtract the size of DNA fragment 1 from the total size of the fragment, therefore: 5360 bp – 128 bp = 5232 bp.
Another more complex way to determine the size of DNA fragment 2 is to follow the fragment from bp1, all the way along to the first cut site at 5070 bp. From this information you know the fragment is at least 5070 bp in size, plus that little extra bit between the XhoI cut site (5198 bp) and the end of the plasmid (5360 bp). You can easily calculate this small bit of fragment as follows: 5360 bp – 5198 bp = 162 bp. To calculate the size of DNA fragment 2: 162 bp + 5070 bp = 5232 bp. Nice!
When conducting RE digestion reactions of this type, you can think of the reaction as a “closed system”, meaning the sizes (in bp) of the DNA fragments generated after RE digestions should always add up to the size (in bp) of the starting DNA piece being digested. In our case: 128 bp + 5232 bp = 5360 bp. Job done!
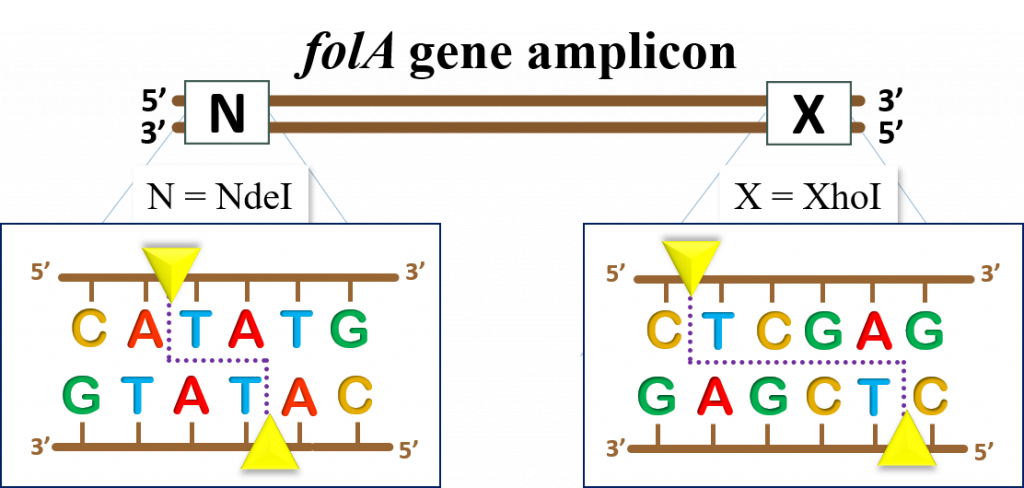
OK, now it’s time to look at our folA amplicon expected DNA band sizes before and after RE digestion reactions. Remember that we first PCR amplified our folA gene using primers containing NdeI and XhoI RE DNA recognition sites. We added these RE DNA recognition sites at the 5′ end of each primer. Directionality matters here! If we orient ourselves by once again referring to the sense strand (5′ to 3′) of folA, then we would like the NdeI DNA recognition site to be at the 5′ end of this strand, and the XhoI recognition site at the 3′ end of the sense strand. This is important because it places the folA gene in the pET26b plasmid in the proper orientation with respect to the T7/lac promoter.
The E. coli folA gene sequence can be obtained from multiple sources, but we have provided the link to the folA sequence from the EcoCyc database (11) Click here to obtain the E. coli folA DNA sequence To obtain the sequence, click on the link, then click on “get nucleotide sequence” on the right side of the window.
Please note that the folA sequence map was changed to incorporate the instructor-designed primers. Thus, the current map displays the folA amplicon following PCR amplification.
Instructor designed primers:
Forward (or sense) primer: 5′ CGGCAGCCATATGATCAGTCTGATTGCGGC 3′
Forward (or antisense) primer: 5′ GTGCTCGAGCCGCCGCTCCAGAATCT 3′
Note: our reverse primer leaves out the stop codon, therefore our folA gene amplicon does not have a stop codon. Why? Think about our end goal- to insert the folA gene into the pET26b plasmid downstream of the T7/lac promoter and to fuse the His 6x-tag to the 3′ end of our gene such that this tag becomes incorporated in the translated protein product. This His 6x-tag is very important for our goal of purifying the folA protein product. Well, we can’t fuse these two pieces of DNA and expect a combined protein product if we don’t take out the stop codon from the end of our folA gene. Once the ribosome starts to translate our mRNA it will not skip the stop codon! No worries though, as there is a built-in stop codon right after the His 6x-tag sequence in the pET26b plasmid. Check out the pET26b zoomed-in sequence, above, to see for yourselves! Pretty neat!
All right, now that we better understand our system we can get to the expected DNA band sizes for the folA amplicon:
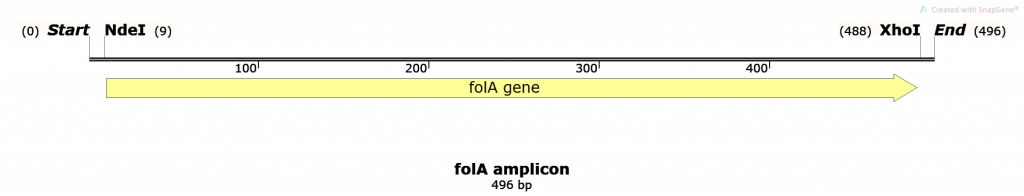
Undigested folA amplicon – 496 bp (as shown in the map, above. This number might differ slightly depending on the student-designed primers)
NdeI/XhoI digested folA amplicon – well, this is a bit tricky. Based on the schematic diagram, below, we obtain 3 DNA fragments upon successful RE digestion of folA. Why 3 fragments and not 2 fragments? Because this starting DNA sample is linear, not circular.
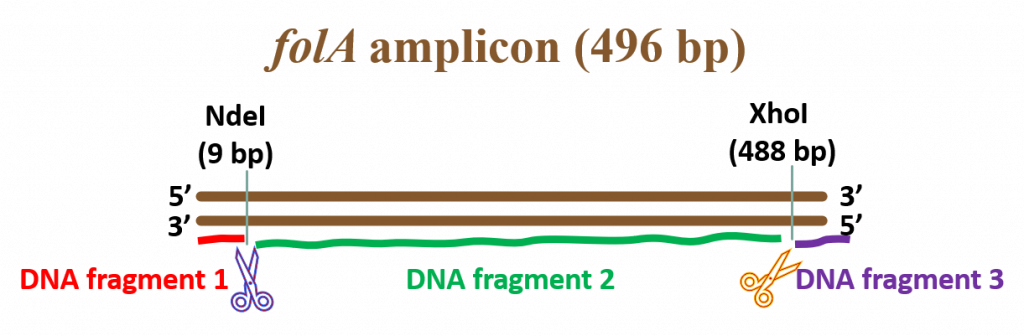
DNA fragment 1 size = 9 bp
DNA fragment 2 size = 488 bp – 9 bp = 479 bp
DNA fragment 3 size = 496 bp – 488 bp = 8 bp
All right, let’s load these samples on an agarose gel and check out our expected results following agarose gel electrophoresis!
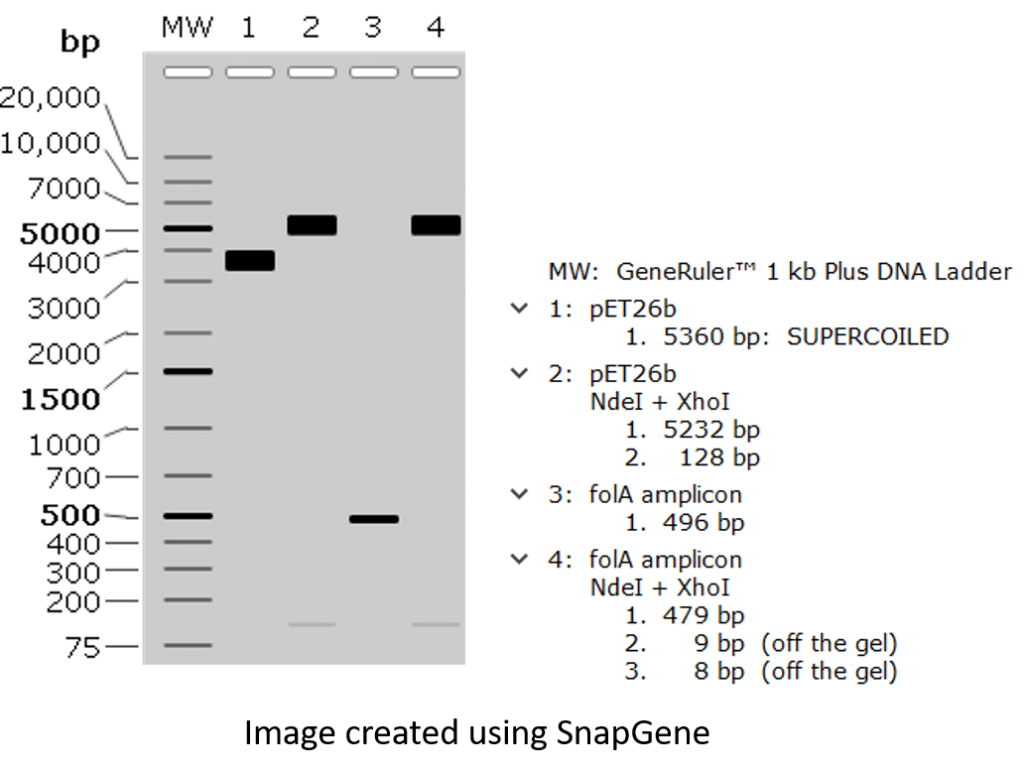
All right, a couple of points worth mentioning:
- Small DNA fragments are often hard to detect.
- Undigested pET26b plasmid is migrating at a molecular weight much lower than its predicted size of 5360 bp. Why? This is because covalently-closed-circular (CCC) DNA tends to migrate differently than linear DNA. There are many reasons for this, but one main reason pertaining to our project is that we obtain our plasmid DNA by isolating it from bacteria. This is because bacteria are amazing machinery for propagating (or making multiple copies) plasmid DNA, so it stands to reason that we would use bacteria to make lots of plasmids. The only thing left is to burst open the bacteria and purify the plasmid DNA (a process called alkaline lysis miniprep, which you will be performing in Chapter 4). The only caveat is that bacteria will take this CCC plasmid DNA and package it tightly, hence we obtain supercoiled DNA. This supercoiled CCC DNA will usually migrate faster through the agarose matrix than its linear counterpart, and will often show up as a DNA band situated lower than the expected band size. Want to learn more about this process?
Check out the following video:
Check out the following blog article: How to Identify Supercoils, Nicks and Circles in DNA Plasmid Preps
