7.4 Relationship between Production and Costs


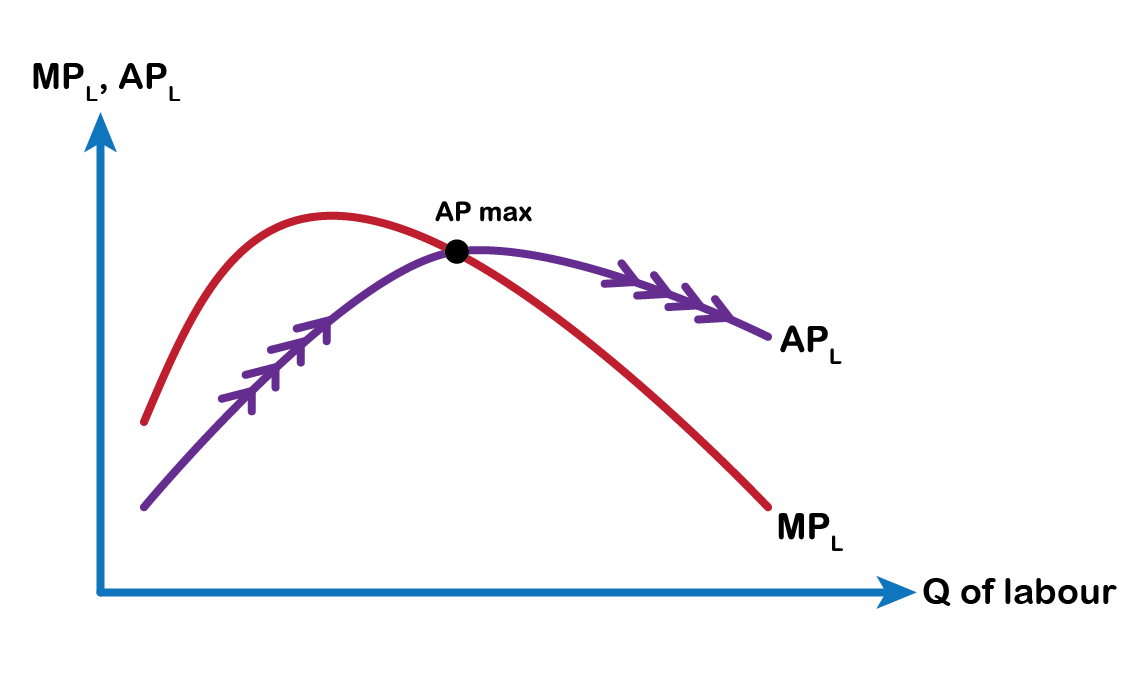
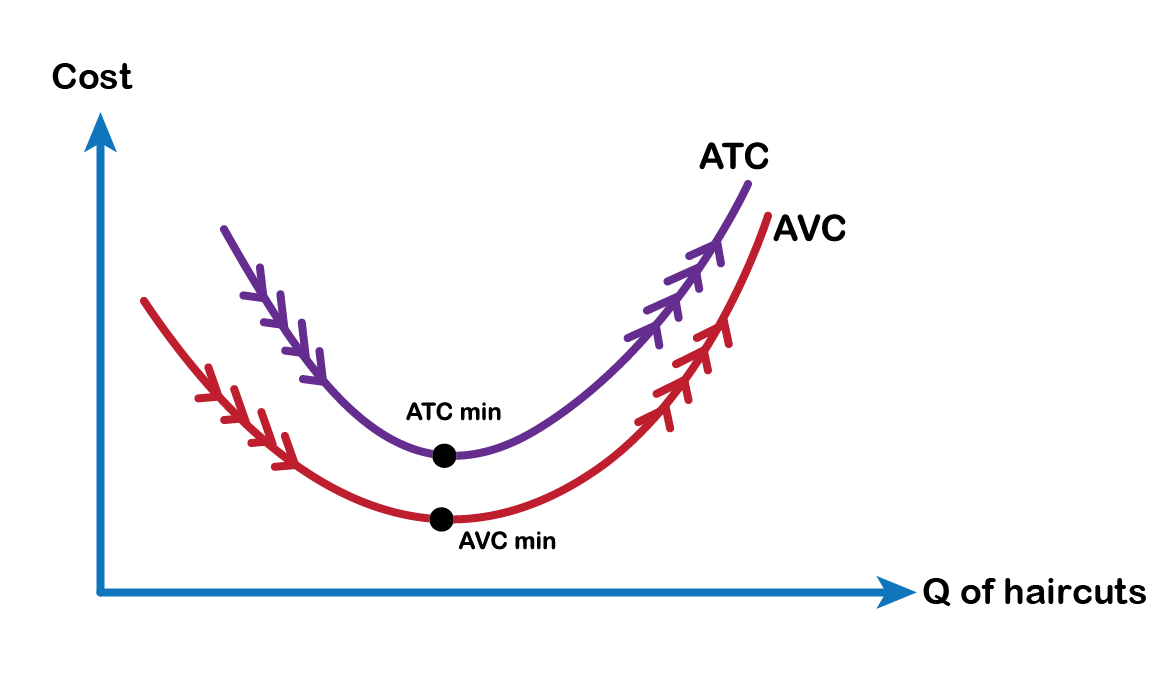
Panel A in Fig 7.9 shows the average and marginal product curves. Notice when marginal product lies above average product, average product rises and when marginal product lies below average product, the average product falls. The point where the two are equal is the point of maximum average productivity. Now notice the bottom Panel which shows the marginal and average cost curves. Looking at both panels, we find that when the average product (AP) increases, the average cost (ATC and AVC) decreases. AP increases when each additional labour adds significantly to the business, such as in our example, the number of haircuts offered by the second barber is greater than that of the first due to division of labour and specialization. The second barber’s greater productivity pulls up the salon’s total product (TP) faster than the total cost (TC). When TP rises faster as each worker is more productive, then a relatively less amount of such labour results in TC rising less faster (relatively less labour, so less wage cost) than TP. Therefore, the average cost falls (Recall, ATC = TC ÷ TP; AP = TP ÷ Labour) as long as the average product increases.
Conversely, when AP starts falling, average costs start increasing. Due to the law of diminishing returns resulting from fixed capital in the short run, adding more labour lowers each worker’s marginal returns. In our example, adding the third, fourth, or fifth barber lowers the marginal productivity of each worker due to the salon’s manager’s inability to offer his barbers more capital. Falling productivity lowers the rate of increase in TP and lowers the average productivity of the business. Therefore, TP rises less fast while relatively greater quantities of labour result in TC rising faster than TP. Therefore, the average cost starts increasing as the average product begins to decrease. When the average productivity of the firm reaches its maximum (APmax), the average cost gets to a minimum (ATCmin or AVCmin).

