7.3 Costs of Production

When a firm looks at its Total Costs (TC) of production in the short run, a useful starting point is to divide total costs into two categories: Fixed Costs and Variable Costs. Fixed cost of production is the cost that does not change as output changes and variable cost is the cost that changes as output changes.
Total Fixed Costs
The salon manager’s total fixed costs are his expenditures that do not change regardless of the number of haircuts offered. Whether he gets a lot or a few customers, his fixed costs are the same. When the manager signs the lease to rent the salon space, the rent costs him $60 a day, regardless of the number of haircuts given. This lease has now become a sunk cost since there is nothing the manager can do to get his money back. Fixed costs can take many other forms: for example, the cost of equipment such as scissors, hairdryers, mirrors, chairs, and clippers to offer haircuts, and even an expense like advertising to popularize a brand name.
Total Variable Costs
The salon manager’s total variable costs are incurred in the act of producing—the more he produces, the greater the variable cost.
After signing the lease for the salon and purchasing the required hair cutting equipment, the manager now has to find workers to offer haircuts. The more haircuts he wants to offer every hour, the more workers he needs to hire. For this reason, his variable costs are increasing as his production (or service) increases. Assuming the wage cost for each labour is $80/day. The table below (Fig 7.5) shows us the fixed cost and the variable cost of production for haircuts, as the manager keeps hiring more barbers to offer more haircut services each day.
Short Run cost
| No of barbers (L) | No of haircuts/day (TP) | Fixed cost (TFC) | Variable cost (TVC) | Total Cost (TC) |
|---|---|---|---|---|
| 0 | 0 | $60 | 0 | $60 |
| 1 | 8 | $60 | $80 | $140 |
| 2 | 17 | $60 | $160 | $220 |
| 3 | 23 | $60 | $240 | $300 |
| 4 | 26 | $60 | $320 | $380 |
| 5 | 27 | $60 | $400 | $460 |
Fig 7.5
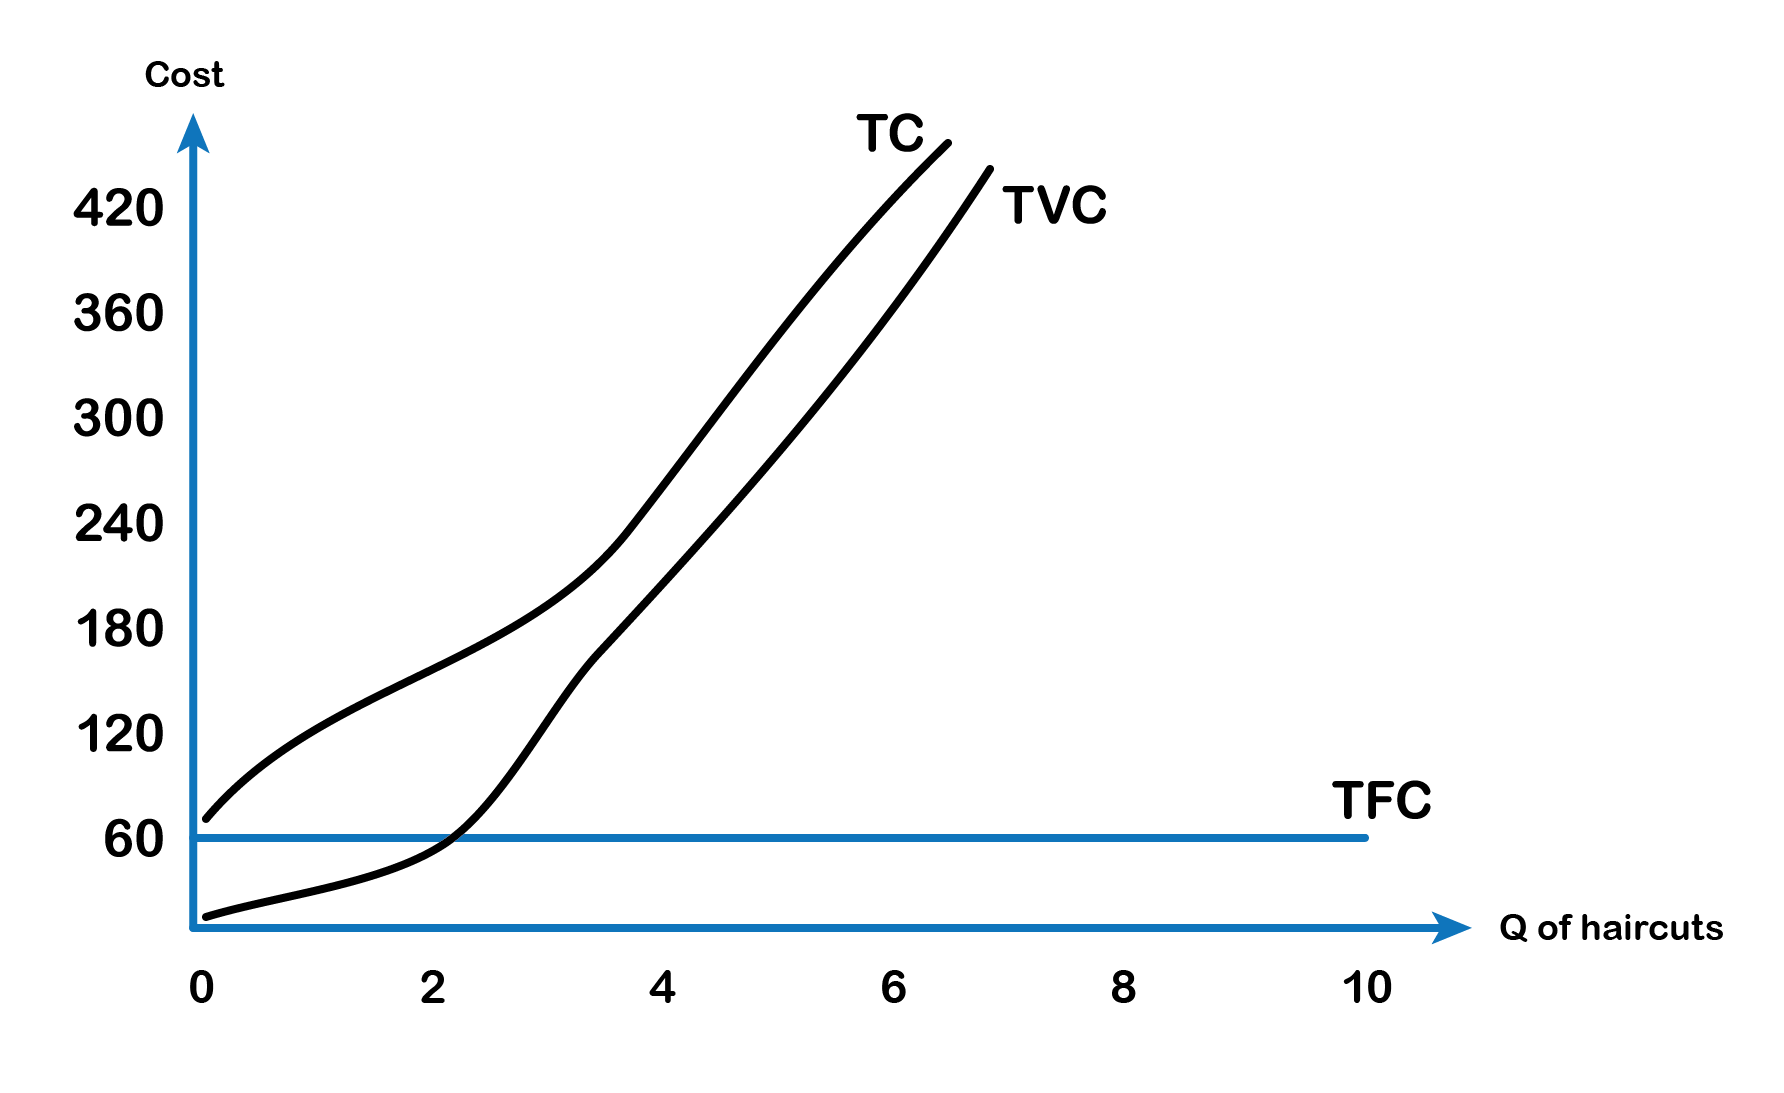
Note when the total output is zero the firm still incurs a fixed cost of $60 as rental cost per day.
The fifth column shows the total cost of production which is the sum of TFC and TVC.
TC = TFC + TVC
Marginal Cost and Average Total Cost
Marginal Cost (MC) is the change in total cost divided by the change in total output or TP.
MC =ΔTC ÷ ΔTP
Average Total Cost (ATC) is the total cost divided by total output.
TC = TFC + TVC
TC ÷ TP = (TFC ÷ TP) + (TVC ÷ TP) (dividing all three expressions by TP)
ATC = AFC + AVC where, AFC = TFC ÷ TP and AVC = TVC ÷ TP
The table below illustrates the different short run cost concepts:
| No of barbers (L) | No of haircuts/day (TP) | TFC | TVC | TC | MC | AFC | AVC | ATC |
|---|---|---|---|---|---|---|---|---|
| 0 | 0 | $60 | 0 | $60 | - | - | - | - |
| 1 | 8 | $60 | $80 | $140 | 80÷8 = $10 | 60÷8 = $7.5 | 80÷8 = $10 | $17.5 |
| 2 | 17 | $60 | $160 | $220 | 80÷9 = $8.9 | 60÷17 = $3.5 | 160÷17 = $9.4 | $12.9 |
| 3 | 23 | $60 | $240 | $300 | 80÷6 = $13.3 | 60÷23 =$2.6 | 240÷23 = $10.4 | $13 |
| 4 | 26 | $60 | $320 | $380 | 80÷3 = $26.7 | 60÷26 = $2.3 | 320÷26 = $12.3 | $14.6 |
| 5 | 27 | $60 | $400 | $460 | 80÷1 = $80 | 60÷27 = $2.2 | 400÷27 = $14.8 | $17 |
Fig 7.7
As seen from the numbers in the above table Fig 7.7, marginal cost initially falls and then starts rising. The average fixed cost keeps decreasing as the quantity of output (the number of haircuts) increases. Both average variable cost and average total cost initially decrease and then start increasing. The graph in Fig 7.8 below shows the marginal and the average cost curves. The marginal cost and the average cost curves emphasize the division of labour, which we will discuss in the next section.
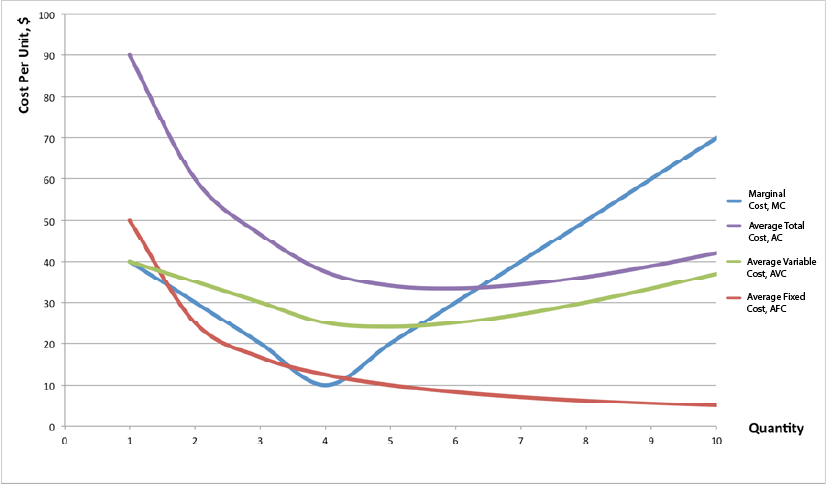
Notice from Fig 7.8 that the marginal cost curve intersects the average cost curve exactly at the bottom of the average cost curve. This is where the average cost reaches its minimum. The reason why the intersection occurs at this point is built into the economic meaning of marginal and average costs. If the marginal cost of production is below the average cost of producing previous units, as it is for the points to the left of where MC crosses AVC, then producing one additional unit will reduce average costs overall—and the AVC curve will be downward-sloping in this zone. Conversely, if the marginal cost of production for producing an additional unit is above the average cost of producing units, as it is for points to the right of where MC crosses AVC, then producing a marginal unit will increase average costs overall—and the AVC curve must be upward-sloping in this zone. The point of transition, between where MC is pulling AVC down and where it is pulling it up, must occur at the minimum point of the AVC curve. As long as marginal cost is below average cost, it causes AVC to decrease. When MC intercepts AVC and begins to rise, it causes AVC to increase. As we will see, AVCmin is very important in the short run.
Marginal costs are typically rising. A firm can compare the marginal cost to the additional revenue it gains from selling another unit to find out whether its marginal unit is adding to its profit. Average total cost is calculated by taking total cost and dividing it by total output at each different level of output. Average costs are typically U-shaped on a graph. Average variable cost is calculated by taking variable cost and dividing it by the total output at each level of output. Average variable costs are also typically U-shaped.
 Why are total cost and average cost not on the same graph?
Total cost, fixed cost, and variable cost each reflect different aspects of the cost of production over the entire quantity of output being produced. These costs are measured in dollars. In contrast, marginal cost, average cost, and average variable cost are costs per unit. In the previous example, they are measured as cost per haircut. Thus, it would not make sense to put all of these numbers on the same graph, since they are measured in different units ($ versus $ per unit of output).
Using the figures from the previous example (fig 7.7), the total cost of producing 17 haircuts per day is $160, but the average cost is $160 ÷ 17, or $12.9.
Attribution
“Module 8: Cost Curves” in Intermediate Microeconomics by Patrick M. Emerson is licensed under a Creative Commons Attribution-NonCommercial-ShareAlike 4.0 International License, except where otherwise noted.
