10.4 Mark-up and Excess Capacity
Look at Fig 10.3 below. The profit maximizing price is $70 and the profit maximizing quantity is 3.6 million subscribers. Notice the marginal cost of offering the 3.6 millionth subscription is $40 for Rogers. This difference between the price and the marginal cost at the profit maximizing quantity is called mark up. The mark up in the graph is $70 – $40 = $30.
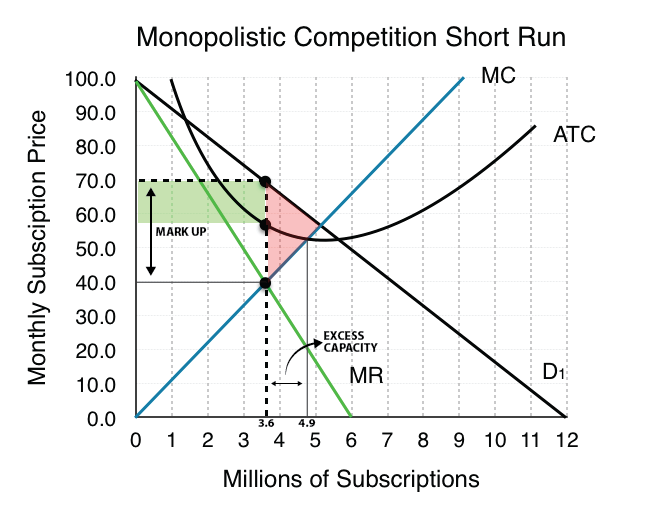
Refer to the above graph. What is the minimum efficient scale output? About 4.8 million subscriptions. If Rogers has provided subscriptions to 4.9 m customers, it would be operating efficiently because at that quantity the ATC reaches a minimum. However, we see Rogers’ profit maximizing quantity of subscriptions is 3.6 m customers. This difference between profit maximizing quantity of output and the minimum efficient scale is the excess capacity. In the above figure, that is about 4.9 – 3.6 = 1.3 million subscriptions.
