6.6 Determinants of Price Elasticity of Supply
Some factors that determine the elasticity of supply would be the availability of inputs. Easier access to inputs allows the producers to increase output relatively faster with respect to a rise in the price and therefore increases supply elasticity. Conversely, limited or scarce inputs lower the elasticity of supply. Just as on the demand side, the passage of time also influences the elasticity of supply. A good is likely to be relatively inelastic or less elastic in the short run time frame while elasticity increases as time go by.
Definition: Elastic supply
An elastic supply is one in which the elasticity is greater than one, indicating high responsiveness to changes in price. Elasticities that are less than one indicate low responsiveness to price changes and correspond to inelastic supply. Unit elastic supply indicates proportional responsiveness of quantity supplied with respect to price.
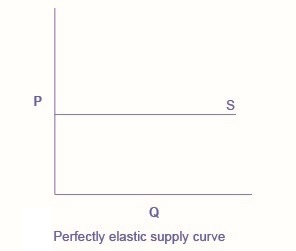
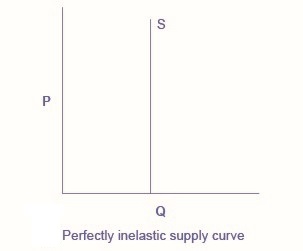
Perfectly elastic and perfectly inelastic supplies
In the case of perfectly elastic supply, the supply curve is horizontal as shown in Fig 6.10 A. While perfectly elastic supply curves are for the most part unrealistic, some examples of perfectly elastic supply include pizza, bread, books, and pencils. Perfectly inelastic supply, as Fig 6.10 B depicts, refers to the extreme case in which a percentage change in price, no matter how large, results in zero change in quantity. While a perfectly inelastic supply is an extreme example, goods with a limited supply of inputs are likely to feature highly inelastic supply curves. Examples include diamond rings or housing in prime locations such as apartments facing Central Park in New York City.
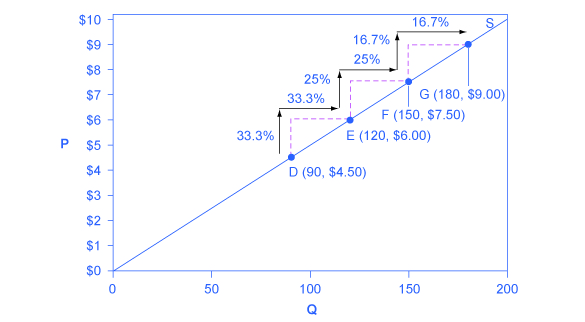
Constant unitary elasticity, in a supply curve, occurs when a price change of one percent results in a quantity change of one percent. Consider the price changes moving up the supply curve in Fig 6.10 C. Along the constant unitary elasticity supply curve, the percentage quantity increases on the horizontal axis exactly match the percentage price increases on the vertical axis—so this supply curve has a constant unitary elasticity at all points.
The elasticities are summarized in the table below:
Attributions
“4.1 Calculating Elasticity” in Principles of Microeconomics by Dr. Emma Hutchinson, University of Victoria is licensed under a Creative Commons Attribution 4.0 International License, except where otherwise noted.
“5.1 Price Elasticity of Demand and Price Elasticity of Supply” and “5.2 Polar Cases of Elasticity and Constant Elasticity” in Principles of Economics 2e by OpenStax is licensed under Creative Commons Attribution 4.0 International License.
- Price elasticities reported in absolute values ↵
