4.1 Demand and Consumer Surplus
Demand is based on needs and wants, and while consumers can differentiate between a need and a want, from an economist’s perspective, they are the same thing. Demand is also based on the ability to pay. If you cannot pay for it, you have no effective demand. This concept of a consumer’s maximum willingness to pay (WTP) serves as a starting point for the demand curve. A consumer’s maximum Willingness to Pay is equal to that consumer’s Marginal Benefit (MB). This is useful information if we want to use Marginal Analysis.
As we learned in Chapter 1, Marginal Analysis or “thinking on the margin” is how consumers decide whether or not to buy an additional unit. It is the process of considering the additional benefits and costs of an activity to make a decision. Therefore, when we say a consumer is willing to pay x dollars for another good, we are stating that the consumer believes they will receive x amount of benefit. As long as the consumer’s marginal benefit is greater than their marginal cost, they will purchase the good. Therefore, the maximum amount a consumer is willing to pay is equal to their marginal benefit.
Suppose, there are five people, each of whose maximum WTP for a tablet computer is given below:

|
|
Maximum WTP |
|---|---|
|
Tim |
$280.00 |
|
Josh |
$260.00 |
|
Mike |
$240.00 |
|
Mary |
$230.00 |
|
Sam |
$200.00 |
|
Rita |
$190.00 |
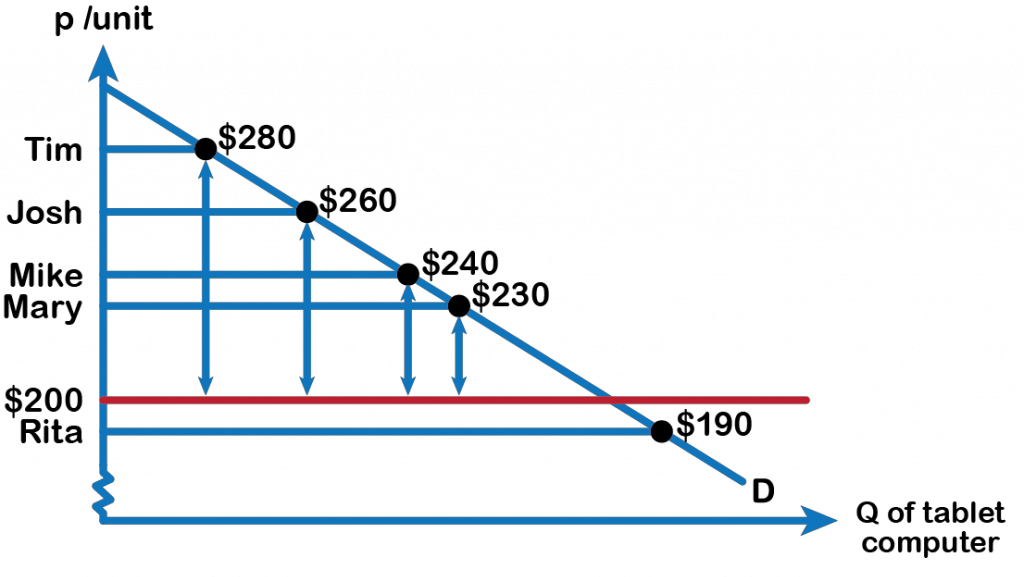
As noted from fig 4.2, the market price for a tablet computer is $200, therefore Tim’s consumer surplus is $80 ($280 minus $200), Josh’s consumer surplus is $60 ($260 − $200), and so on. Referring to the figure, we also find that Sam’s maximum willingness to pay is the same as the price, so Sam’s consumer surplus is zero. However, as long as the price coincides with his willingness to pay, the consumer can still purchase the good. Rita’s maximum willingness to pay is $190, which is below the price of the tablet, and therefore she does not obtain the good.

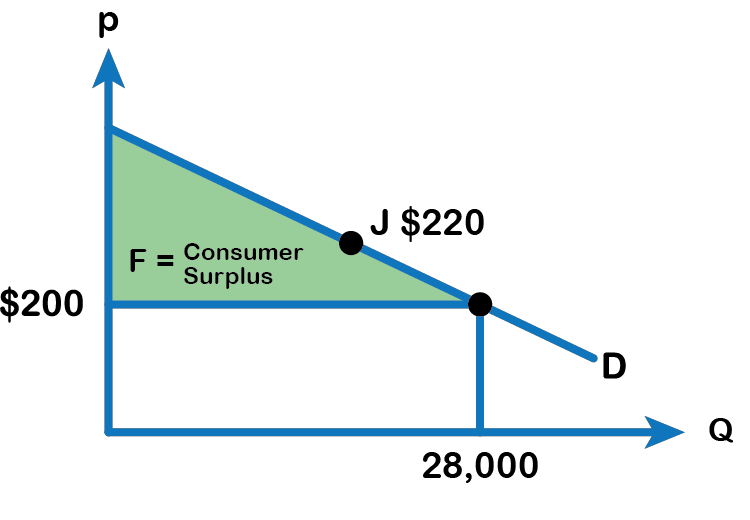
Consider the demand curve for tablet computers, as Figure 4.4 shows. The price of a tablet computer is $200 and the quantity demanded at that price is 28 million. To see the benefits to consumers, look at the segment of the demand curve above the price line and to the left. This portion of the demand curve shows that at least some consumers would have been willing to pay more than $200 for a tablet, as shown in the table in fig 4.3. Each point on the demand curve shows the consumers’ maximum willingness to pay for that quantity.
For example, point (J) shows that those consumers who would be willing to pay $220, for a tablet (based on the benefit they expect to receive from it) were able to pay the price of $200, clearly received a benefit beyond what they had to pay. Remember, the demand curve traces consumers’ willingness to pay for different quantities.
Definition: Consumer Surplus
The amount that individuals would have been willing to pay, minus the amount that they actually paid, is called Consumer Surplus. Consumer surplus is the area labelled F—that is, the area above the price and below the demand curve. The value of Consumer surplus is calculated as the Area of the triangle represented by F.
Consumer Surplus = (base × height) ÷ 2
Attribution
“3.2 Building Demand and Consumer Surplus” in Principles of Microeconomics by Dr. Emma Hutchinson, University of Victoria is licensed under a Creative Commons Attribution 4.0 International License, except where otherwise noted.

