12.2 Linear Equations
LEARNING OBJECTIVES
- Identify a linear equation, graphically or algebraically.
In this chapter we will be studying simple linear regression, which models the linear relationship between two variables [latex]x[/latex] and [latex]y[/latex]. A linear equation has the form [latex]y=b_0+b_1x[/latex] where [latex]b_0[/latex] is the [latex]y[/latex]-intercept of the line and [latex]b_1[/latex] is the slope of the line. For example, [latex]y=3+2x[/latex] and [latex]y=1-4x[/latex] are examples of linear equations. The graph of linear equation is a straight line.
EXAMPLE
TRY IT
The slope [latex]b_1[/latex] is a number that describes the steepness of a line. The slope tells us how the value of the [latex]y[/latex] variable will change for every one unit increase in the value of the [latex]x[/latex] variable.
The [latex]y[/latex]-intercept is the value of the [latex]y[/latex]-coordinate where the line crosses the [latex]y[/latex]-axis. Algebraically, the [latex]y[/latex]-intercept is the value of [latex]y[/latex] when [latex]x=0[/latex].
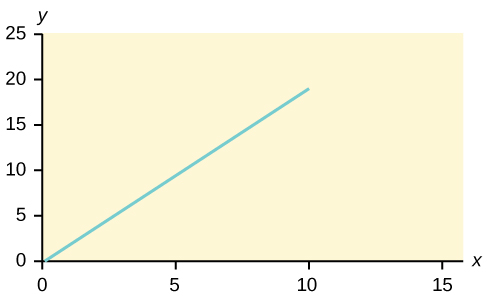
Consider the figure below, which illustrates three different linear equations:
- In (a), the line rises from left to right across the graph. This means that the slope [latex]b_1[/latex] is a positive number ([latex]b_1\gt 0[/latex]).
- In (b), the line is horizontal (parallel to the [latex]x[/latex]-axis). This means that the slope [latex]b_1[/latex] is zero ([latex]b_1=0[/latex]).
- In (c), the line falls from left to right across the graph. This means that the slope [latex]b_1[/latex] is a negative number ([latex]b_1\lt 0[/latex]).
 0 and so the line slopes upward to the right. For the second, b = 0 and the graph of the equation is a horizontal line. In the third graph, (c), b
 EXAMPLE
Consider the linear equation [latex]y=-25+15x[/latex].
- The slope is [latex]15[/latex]. This tells us that when the value of [latex]x[/latex] increases by [latex]1[/latex], the value of [latex]y[/latex] increases by [latex]15[/latex]. Because the slope is positive, the graph of [latex]y=-25+15x[/latex] rises from left to right.
- The [latex]y[/latex]-intercept is [latex]-25[/latex]. This tells us that when [latex]x=0[/latex], [latex]y=-25[/latex]. On the graph of [latex]y=-25+15x[/latex], the line crosses the [latex]y[/latex]-axis at [latex]-25[/latex].
TRY IT
Consider the linear equation [latex]y=17-10x[/latex]. Identify the slope and [latex]y[/latex]-intercept. Describe the slope and [latex]y[/latex]-intercept in sentences.
Click to see Solution
- The slope is [latex]-10[/latex]. This tells us that when the value of [latex]x[/latex] increases by [latex]1[/latex], the value of [latex]y[/latex] decreases by [latex]10[/latex]. Because the slope is negative, the graph of [latex]y=17-10x[/latex] falls from left to right.
- The [latex]y[/latex]-intercept is [latex]17[/latex]. This tells us that when [latex]x=0[/latex], [latex]y=17[/latex]. On the graph of [latex]y=17-10x[/latex], the line crosses the [latex]y[/latex]-axis at [latex]17[/latex].
Concept Review
The most basic type of association is a linear association. This type of relationship can be defined algebraically by the equation used, numerically with actual or predicted data values, or graphically from a plotted curve (lines are classified as straight curves). Algebraically, a linear equation typically takes the form [latex]y=b_0+b_1x[/latex], where [latex]b_0[/latex] is the [latex]y[/latex]-intercept and [latex]b_1[/latex] is the slope.
The slope is a value that describes the rate of change of the [latex]y[/latex] variable for a single unit increase in the [latex]x[/latex] variable. The [latex]y[/latex]-intercept is the value of [latex]y[/latex] when [latex]x=0[/latex].
Attribution
“12.1 Linear Equations” in Introductory Statistics by OpenStax is licensed under a Creative Commons Attribution 4.0 International License.


