10.2 The Chi Square Distribution
LEARNING OBJECTIVES
- Find the area under a [latex]\chi^2[/latex]-distribution.
- Find the [latex]\chi^2[/latex]-score for a given area under the curve of a [latex]\chi^2[/latex]-distribution.
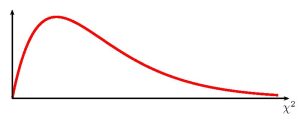
The [latex]\chi^2[/latex]-distribution is a continuous probability distribution. The graph of a [latex]\chi^2[/latex]-distribution is shown below.
Properties of the [latex]\chi^2[/latex]-distribution:
- The graph of a [latex]\chi^2[/latex]-distribution is positively-skewed and asymmetrical with a minimum value of 0 and no maximum value.
- A [latex]\chi^2[/latex]-distribution is determined by its degrees of freedom, [latex]df[/latex]. The value of the degrees of freedom depends on how the [latex]\chi^2[/latex]-distribution is used. There is a different [latex]\chi^2[/latex]-distribution for every value of [latex]df[/latex]. As the degrees of freedom increases, the [latex]\chi^2[/latex]-distribution approaches a normal distribution.
- The total area under the graph of a [latex]\chi^2[/latex]-distribution is 1.
- The mean of a [latex]\chi^2[/latex]-distribution is its degrees of freedom: [latex]\mu=df[/latex].
- The variance of a [latex]\chi^2[/latex]-distribution is twice its degrees of freedom: [latex]\sigma^2=2\times df[/latex].
- The mode of a [latex]\chi^2[/latex]-distribution is [latex]df-2[/latex]. The peak of the graph occurs at the mode.
- Probabilities associated with a [latex]\chi^2[/latex]-distribution are given by the area under the curve of the [latex]\chi^2[/latex]-distribution.
USING EXCEL TO CALCULATE THE AREA UNDER A [latex]{\color{white}{\chi^2}}[/latex]-DISTRIBUTION
To find the area in the left tail:
- To find the area under a [latex]\chi^2[/latex]-distribution to the left of a given [latex]\chi^2[/latex]-score, use the chisq.dist([latex]\chi^2[/latex], degrees of freedom, logic operator) function.
- For [latex]\chi^2[/latex], enter the [latex]\chi^2[/latex]-score.
- For degrees of freedom, enter the value of the degrees of freedom for the [latex]\chi^2[/latex]-distribution.
- For logic operator, enter true.
- The output from the chisq.dist function is the area to the left of the entered [latex]\chi^2[/latex]-score.
- Visit the Microsoft page for more information about the chisq.dist function.
To find the area in the right tail:
- To find the area under a [latex]\chi^2[/latex]-distribution to the right of a given [latex]\chi^2[/latex]-score, use the chisq.dist.rt([latex]\chi^2[/latex], degrees of freedom) function.
- For [latex]\chi^2[/latex], enter the [latex]\chi^2[/latex]-score.
- For degrees of freedom, enter the value of the degrees of freedom for the [latex]\chi^2[/latex]-distribution.
- The output from the chisq.dist.rt function is the area to the right of the entered [latex]\chi^2[/latex]-score.
- Visit the Microsoft page for more information about the chisq.dist.rt function.
EXAMPLE
Consider a [latex]\chi^2[/latex]-distribution with 12 degrees of freedom.
- Find the area under the [latex]\chi^2[/latex]-distribution to the left of [latex]\chi^2=3.71[/latex].
- Find the area under the [latex]\chi^2[/latex]-distribution to the right of [latex]\chi^2=6.29[/latex].
Solution:
-
Function chisq.dist Answer Field 1 3.71 0.0119 Field 2 12 Field 3 true -
Function chisq.dist.rt Answer Field 1 6.72 0.8755 Field 2 12
USING EXCEL TO CALCULATE [latex]{\color{white}{\chi^2}}[/latex]-SCORES
To find the [latex]\chi^2[/latex]-score for a given left-tail area:
- To find the [latex]\chi^2[/latex]-score for a given area under the [latex]\chi^2[/latex]-distribution to the left of the [latex]\chi^2[/latex]-score, use the chisq.inv(area to the left, degrees of freedom) function.
- For area to the left, enter the area to the left of required [latex]\chi^2[/latex]-score.
- For degrees of freedom, enter the value of the degrees of freedom for the [latex]\chi^2[/latex]-distribution.
- The output from the chisq.inv function is the value of [latex]\chi^2[/latex]-score so that the area to the left of the [latex]\chi^2[/latex]-score is the entered area.
- Visit the Microsoft page for more information about the chisq.inv function.
To find the [latex]\chi^2[/latex]-score for a given right-tail area:
- To find the [latex]\chi^2[/latex]-score for a given area under the [latex]\chi^2[/latex]-distribution to the right of the [latex]\chi^2[/latex]-score, use the chisq.inv.rt(area to the right, degrees of freedom) function.
- For area to the right, enter the area to the right of required [latex]\chi^2[/latex]-score.
- For degrees of freedom, enter the value of the degrees of freedom for the [latex]\chi^2[/latex]-distribution.
- The output from the chisq.inv.rt function is the value of [latex]\chi^2[/latex]-score so that the area to the right of the [latex]\chi^2[/latex]-score is the entered area.
- Visit the Microsoft page for more information about the chisq.inv.rt function.
EXAMPLE
Consider a [latex]\chi^2[/latex]-distribution with 37 degrees of freedom.
- Find the [latex]\chi^2[/latex]-score so that the area under the [latex]\chi^2[/latex]-distribution to the left of [latex]\chi^2[/latex] is 0.25.
- Find the [latex]\chi^2[/latex]-score so that the area under the [latex]\chi^2[/latex]-distribution to the right of [latex]\chi^2[/latex] is 0.148.
Solution:
-
Function chisq.inv Answer Field 1 0.25 30.89 Field 2 37 -
Function chisq.dist.rt Answer Field 1 0.148 45.97 Field 2 37
Concept Review
The [latex]\chi^2[/latex]-distribution is a useful tool for assessment in a series of problem categories. These problem categories include: determining if a data set fits a particular distribution, determining if the distributions of two populations are the same, determining if two categorical variables are independent or dependent, and determining if there is a different variability than expected within a population.
An important parameter in a [latex]\chi^2[/latex]-distribution is the degrees of freedom in a given problem. The [latex]\chi^2[/latex]-distribution curve is skewed to the right, and its shape depends on the degrees of freedom. As the degrees of freedom increases, the curve of a [latex]\chi^2[/latex]-distribution approaches a normal distribution.
Attribution
"11.1 Facts About the Chi-Square Distribution" in Introductory Statistics by OpenStax is licensed under a Creative Commons Attribution 4.0 International License.


