11.2 The F-Distribution
LEARNING OBJECTIVES
- Find the area under an [latex]F[/latex]-distribution.
- Find the [latex]F[/latex]-score for a given area under the curve of an [latex]F[/latex]-distribution.
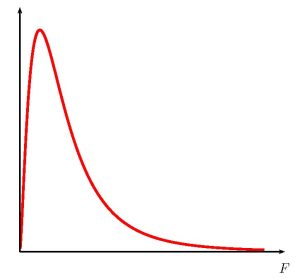
The [latex]F[/latex]-distribution is a continuous probability distribution. The graph of an [latex]F[/latex]-distribution is shown below. The [latex]F[/latex]-distribution is used in statistical inference to test the equality of population variances, test the difference in three or more population means, or to test the overall multiple regression model.
Properties of the [latex]F[/latex]-distribution:
- The graph of an [latex]F[/latex]-distribution is positively-skewed and asymmetrical with a minimum value of 0 and no maximum value.
- An [latex]F[/latex]-distribution is determined by two different degrees of freedom, [latex]df_1[/latex] and [latex]df_2[/latex]. [latex]df_1[/latex] is the degrees of freedom for the numerator of the [latex]F[/latex]-score and [latex]df_2[/latex] is the degrees of freedom for the denominator of the [latex]F[/latex]-score. The values of the degrees of freedom depends on how the [latex]F[/latex]-distribution is used. There is a different [latex]F[/latex]-distribution for every set of degrees of freedom. As the values of [latex]df_1[/latex] and [latex]df_2[/latex] get larger, the [latex]F[/latex]-distribution approaches a normal distribution.
- The total area under the graph of an [latex]F[/latex]-distribution is 1.
- Probabilities associated with an [latex]F[/latex]-distribution are given by the area under the curve of the [latex]F[/latex]-distribution.
USING EXCEL TO CALCULATE THE AREA UNDER AN [latex]{\color{white}{F}}[/latex]-DISTRIBUTION
To find the area in the left tail:
- To find the area under an [latex]F[/latex]-distribution to the left of a given [latex]F[/latex]-score, use the f.dist([latex]F[/latex], degrees of freedom 1, degrees of freedom 2, logic operator) function.
- For [latex]F[/latex], enter the [latex]F[/latex]-score.
- For degrees of freedom 1, enter the value of [latex]df_1[/latex] for the [latex]F[/latex]-distribution.
- For degrees of freedom 2, enter the value of [latex]df_2[/latex] for the [latex]F[/latex]-distribution.
- For logic operator, enter true.
- The output from the f.dist function is the area to the left of the entered [latex]F[/latex]-score.
- Visit the Microsoft page for more information about the f.dist function.
To find the area in the right tail:
- To find the area under an [latex]F[/latex]-distribution to the right of a given [latex]F[/latex]-score, use the f.dist.rt([latex]F[/latex], degrees of freedom 1, degrees of freedom 2) function.
- For [latex]F[/latex], enter the [latex]F[/latex]-score.
- For degrees of freedom 1, enter the value of [latex]df_1[/latex] for the [latex]F[/latex]-distribution.
- For degrees of freedom 2, enter the value of [latex]df_2[/latex] for the [latex]F[/latex]-distribution.
- The output from the f.dist.rt function is the area to the right of the entered [latex]F[/latex]-score.
- Visit the Microsoft page for more information about the f.dist.rt function.
EXAMPLE
Consider an [latex]F[/latex]-distribution with [latex]df_1=12[/latex] and [latex]df_2=27[/latex].
- Find the area under the [latex]F[/latex]-distribution to the left of [latex]F=0.69[/latex].
- Find the area under the [latex]F[/latex]-distribution to the right of [latex]F=1.53[/latex].
Solution:
-
Function f.dist Answer Field 1 0.69 0.2535 Field 2 12 Field 3 27 Field 4 true -
Function f.dist.rt Answer Field 1 1.53 0.1738 Field 2 12 Field 3 27
USING EXCEL TO CALCULATE [latex]{\color{white}{F}}[/latex]-SCORES
To find the [latex]F[/latex]-score for the a given left-tail area:
- To find the [latex]F[/latex]-score for a given area under an [latex]F[/latex]-distribution to the left of the [latex]F[/latex]-score, use the f.inv(area to the left, degrees of freedom 1, degrees freedom 2) function.
- For area to the left, enter the area to the left of required [latex]F[/latex]-score.
- For degrees of freedom 1, enter the value of [latex]df_1[/latex] for the [latex]F[/latex]-distribution.
- For degrees of freedom 2, enter the value of [latex]df_2[/latex] for the [latex]F[/latex]-distribution.
- The output from the f.inv function is the value of [latex]F[/latex]-score so that the area to the left of the [latex]F[/latex]-score is the entered area.
- Visit the Microsoft page for more information about the f.inv function.
To find the [latex]F[/latex]-score for the a given right-tail area:
- To find the [latex]F[/latex]-score for a given area under an [latex]F[/latex]-distribution to the right of the [latex]F[/latex]-score, use the f.inv.rt(area to the right, degrees of freedom 1, degrees of freedom 2) function.
- For area to the right, enter the area to the right of required [latex]F[/latex]-score.
- For degrees of freedom 1, enter the value of [latex]df_1[/latex] for the [latex]F[/latex]-distribution.
- For degrees of freedom 2, enter the value of [latex]df_2[/latex] for the [latex]F[/latex]-distribution.
- The output from the f.inv.rt function is the value of [latex]F[/latex]-score so that the area to the right of the [latex]F[/latex]-score is the entered area.
- Visit the Microsoft page for more information about the f.inv.rt function.
EXAMPLE
Consider an [latex]F[/latex]-distribution with [latex]df_1=37[/latex] and [latex]df_2=15[/latex].
- Find the [latex]F[/latex]-score so that the area under the [latex]F[/latex]-distribution to the left of [latex]F[/latex] is 0.413.
- Find the [latex]F[/latex]-score so that the area under the [latex]F[/latex]-distribution to the right of [latex]F[/latex] is 0.148.
Solution:
-
Function f.inv Answer Field 1 0.413 0.934 Field 2 37 Field 3 15 -
Function f.dist.rt Answer Field 1 0.269 1.354 Field 2 37 Field 3 15
Concept Review
The [latex]F[/latex]-distribution is a useful tool for assessment in a series of problem categories. These problem categories include: statistical inference for two population variances, testing the equality of three or more population means (one-way ANOVA), and testing the overall significance of the multiple regression model.
Important parameters in an [latex]F[/latex]-distribution are the degrees of freedom in a given problem. The [latex]F[/latex]-distribution curve is skewed to the right, and its shape depends on the degrees of freedom. As the degrees of freedom increase, the curve of an [latex]F[/latex]-distribution approaches a normal distribution.
Attribution
"13.3 Facts About the F Distribution" in Introductory Statistics by OpenStax is licensed under a Creative Commons Attribution 4.0 International License.


