1.8 – Self-Check, Critical Thinking & Review Questions for Demand Markets
Self Check Questions
- In the labour market, what causes a movement along the demand curve? What causes a shift in the demand curve?
- In the labour market, what causes a movement along the supply curve? What causes a shift in the supply curve?
- Why is a living wage considered a price floor? Does imposing a living wage have the same outcome as a minimum wage?
- In the financial market, what causes a movement along the demand curve? What causes a shift in the demand curve?
- In the financial market, what causes a movement along the supply curve? What causes a shift in the supply curve?
- If a usury law limits interest rates to no more than 35%, what would the likely impact be on the amount of loans made and interest rates paid?
- Which of the following changes in the financial market will lead to a decline in interest rates:
- a rise in demand
- a fall in demand
- a rise in supply
- a fall in supply
- Which of the following changes in the financial market will lead to an increase in the quantity of loans made and received:
- a rise in demand
- a fall in demand
- a rise in supply
- a fall in supply
- Identify the most accurate statement. A price floor will have the largest effect if it is set:
- substantially above the equilibrium price
- slightly above the equilibrium price
- slightly below the equilibrium price
- substantially below the equilibrium price
Sketch all four of these possibilities on a demand and supply diagram to illustrate your answer
- A price ceiling will have the largest effect:
- substantially below the equilibrium price
- slightly below the equilibrium price
- substantially above the equilibrium price
- slightly above the equilibrium price
Sketch all four of these possibilities on a demand and supply diagram to illustrate your answer.
- Select the correct answer. A price floor will usually shift:
- demand
- supply
- both
- neither
Illustrate your answer with a diagram.
- Select the correct answer. A price ceiling will usually shift:
- demand
- supply
- both
- neither
Check your Answer[1]
Critical Thinking Questions
- Other than the demand for labour, what would be another example of a “derived demand?”
- Suppose that a 5% increase in the minimum wage causes a 5% reduction in employment. How would this affect employers and how would it affect workers? In your opinion, would this be a good policy?
- Under what circumstances would a minimum wage be a nonbinding price floor? Under what circumstances would a living wage be a binding price floor?
- Suppose the U.S. economy began to grow more rapidly than other countries in the world. What would be the likely impact on U.S. financial markets as part of the global economy?
- If the government imposed a federal interest rate ceiling of 20% on all loans, who would gain and who would lose?
- Why are the factors that shift the demand for a product different from the factors that shift the demand for labour? Why are the factors that shift the supply of a product different from those that shift the supply of labour?
- During a discussion several years ago on building a pipeline to Alaska to carry natural gas, the U.S. Senate passed a bill stipulating that there should be a guaranteed minimum price for the natural gas that would flow through the pipeline. The thinking behind the bill was that if private firms had a guaranteed price for their natural gas, they would be more willing to drill for gas and to pay to build the pipeline.
- Using the demand and supply framework, predict the effects of this price floor on the price, quantity demanded, and quantity supplied.
- With the enactment of this price floor for natural gas, what are some of the likely unintended consequences in the market?
- Suggest some policies other than the price floor that the government can pursue if it wishes to encourage drilling for natural gas and for a new pipeline in Alaska.
Review Questions
- What is the “price” commonly called in the labour market?
- Are households demanders or suppliers in the goods market? Are firms demanders or suppliers in the goods market? What about the labour market and the financial market?
- Name some factors that can cause a shift in the demand curve in labour markets.
- Name some factors that can cause a shift in the supply curve in labour markets.
- How do economists define equilibrium in financial markets?
- What would be a sign of a shortage in financial markets?
- Would usury laws help or hinder resolution of a shortage in financial markets?
- Whether the product market or the labour market, what happens to the equilibrium price and quantity for each of the four possibilities: increase in demand, decrease in demand, increase in supply, and decrease in supply.
Exercises
- Identify each of the following as involving either demand or supply. Draw a circular flow diagram and label the flows A through F. (Some choices can be on both sides of the goods market.)
- Households in the labour market
- Firms in the goods market
- Firms in the financial market
- Households in the goods market
- Firms in the labour market
- Households in the financial market
- Predict how each of the following events will raise or lower the equilibrium wage and quantity of oil workers in Texas. In each case, sketch a demand and supply diagram to illustrate your answer.
- The price of oil rises.
- New oil-drilling equipment is invented that is cheap and requires few workers to run.
- Several major companies that do not drill oil open factories in Texas, offering many well-paid jobs outside the oil industry.
- Government imposes costly new regulations to make oil-drilling a safer job.
- Predict how each of the following economic changes will affect the equilibrium price and quantity in the financial market for home loans. Sketch a demand and supply diagram to support your answers.
- The number of people at the most common ages for home-buying increases.
- People gain confidence that the economy is growing and that their jobs are secure.
- Banks that have made home loans find that a larger number of people than they expected are not repaying those loans.
- Because of a threat of a war, people become uncertain about their economic future.
- The overall level of saving in the economy diminishes.
- The federal government changes its bank regulations in a way that makes it cheaper and easier for banks to make home loans.
- Table 1.8a (seen below) shows the amount of savings and borrowing in a market for loans to purchase homes, measured in millions of dollars, at various interest rates. What is the equilibrium interest rate and quantity in the capital financial market? How can you tell? Now, imagine that because of a shift in the perceptions of foreign investors, the supply curve shifts so that there will be $10 million less supplied at every interest rate. Calculate the new equilibrium interest rate and quantity, and explain why the direction of the interest rate shift makes intuitive sense.
Table 1.8a Interest Rate (%) Qs Qd 5 130 170 6 135 150 7 140 140 8 145 135 9 150 125 10 155 110 - Imagine that to preserve the traditional way of life in small fishing villages, a government decides to impose a price floor that will guarantee all fishermen a certain price for their catch.
- Using the demand and supply framework, predict the effects on the price, quantity demanded, and quantity supplied.
- With the enactment of this price floor for fish, what are some of the likely unintended consequences in the market?
- Suggest some policies other than the price floor to make it possible for small fishing villages to continue.
- What happens to the price and the quantity bought and sold in the cocoa market if countries producing cocoa experience a drought and a new study is released demonstrating the health benefits of cocoa? Illustrate your answer with a demand and supply graph.
Attribution
Except where otherwise noted, this chapter is adapted from “Self-Check Questions” , “Review Questions“, “Critical Thinking Questions, ““Problems“ , and “Answer Key – Chapter 4” In Principles of Microeconomics 2e (Open Stax) by Steven A. Greenlaw & David Shapiro, licensed under CC BY 4.0.
Access for free at Principles of Microeconomics 2e
-
- Changes in the wage rate (the price of labour) cause a movement along the demand curve. A change in anything else that affects demand for labour (e.g., changes in output, changes in the production process that use more or less labour, government regulation) causes a shift in the demand curve.
- Since a living wage is a suggested minimum wage, it acts like a price floor (assuming, of course, that it is followed). If the living wage is binding, it will cause an excess supply of labour at that wage rate.
- Changes in the interest rate (i.e., the price of financial capital) cause a movement along the demand curve. A change in anything else (non-price variable) that affects demand for financial capital (e.g., changes in confidence about the future, changes in needs for borrowing) would shift the demand curve.
- Changes in the interest rate (i.e., the price of financial capital) cause a movement along the supply curve. A change in anything else that affects the supply of financial capital (a non-price variable) such as income or future needs would shift the supply curve.
- If market interest rates stay in their normal range, an interest rate limit of 35% would not be binding. If the equilibrium interest rate rose above 35%, the interest rate would be capped at that rate, and the quantity of loans would be lower than the equilibrium quantity, causing a shortage of loans.
- b and c will lead to a fall in interest rates. At a lower demand, lenders will not be able to charge as much, and with more available lenders, competition for borrowers will drive rates down.
- a and c will increase the quantity of loans. More people who want to borrow will result in more loans being given, as will more people who want to lend.
- A price floor prevents a price from falling below a certain level, but has no effect on prices above that level. It will have its biggest effect in creating excess supply (as measured by the entire area inside the dotted lines on the graph, from D to S) if it is substantially above the equilibrium price. This is illustrated in the following figure.
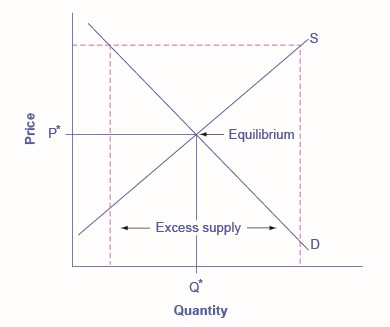 Question 9 Figure 1.8A: Substantially Above Equilibrium Price. Figure by Steven A. Greenlaw & David Shapiro (OpenStax), licensed under CC BY 4.0.It will have a lesser effect if it is slightly above the equilibrium price. This is illustrated in the next figure.
Question 9 Figure 1.8A: Substantially Above Equilibrium Price (Text Version)
The vertical axis is Price (P) and the horizontal axis is Quantity (Q). The supply curve (S) slopes upward from left to right the demand curve (D) slopes downward from left to right. The equilibrium occurs where S and D intersect, at point P* and Q*. The graph shows a dashed price floor line substantially above the equilibrium price with excess supply beneath the equilibrium.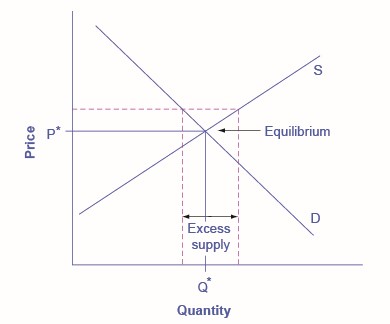 Question 9 Figure 1.8B: Slightly Above Equilibrium Price. Figure by Steven A. Greenlaw & David Shapiro (OpenStax), licensed under CC BY 4.0.It will have no effect if it is set either slightly or substantially below the equilibrium price, since an equilibrium price above a price floor will not be affected by that price floor. The following figure illustrates these situations.
Question 9 Figure 1.8B: Slightly Above Equilibrium Price (Text Version)
The vertical axis is Price (P) and the horizontal axis is Quantity (Q). The supply curve (S) slopes more gradually upward from left to right then Question 9 Figure 1.8A . The demand curve (D) slopes downward from left to right. The equilibrium occurs where S and D intersect, at point P* and Q*. The graph shows a dashed price floor line that is just slightly above equilibrium and there is less excess supply.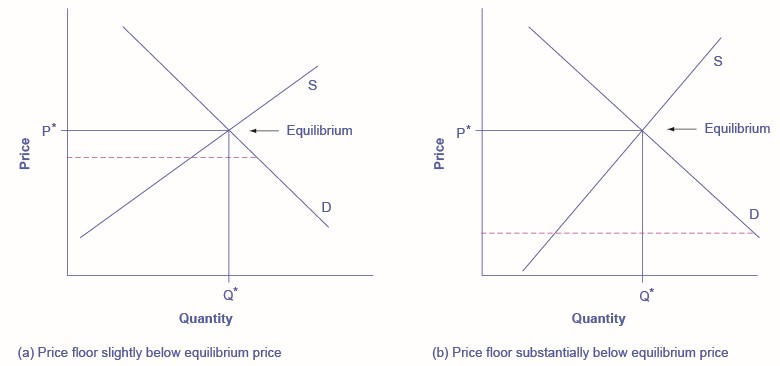 Question 9 Figure 1.8C: Set Either Slightly or Substantially Below the Equilibrium Price. Figure by Steven A. Greenlaw & David Shapiro (OpenStax), licensed under CC BY 4.0.
Question 9 Figure 1.8C: Set Either Slightly or Substantially Below the Equilibrium Price (Text Version)
There are two graphs with the same vertical axis is Price (P) and the horizontal axis is Quantity (Q). Graph A: The supply curve (S) slopes more gradually upward from left to right and the demand curve (D) slopes downward from left to right. The equilibrium occurs where S and D intersect, at point P* and Q*. Shows a dashed price floor line that is just slightly below equilibrium Graph B: The supply curve (S) slopes upward from left to right and the demand curve (D) slopes downward from left to right. The equilibrium occurs where S and D intersect, at point P* and Q*. Shows a dashed price floor line that is substantially below equilibrium. - A price ceiling prevents a price from rising above a certain level, but has no effect on prices below that level. It will have its biggest effect in creating excess demand if it is substantially below the equilibrium price. The following figure illustrates these situations.
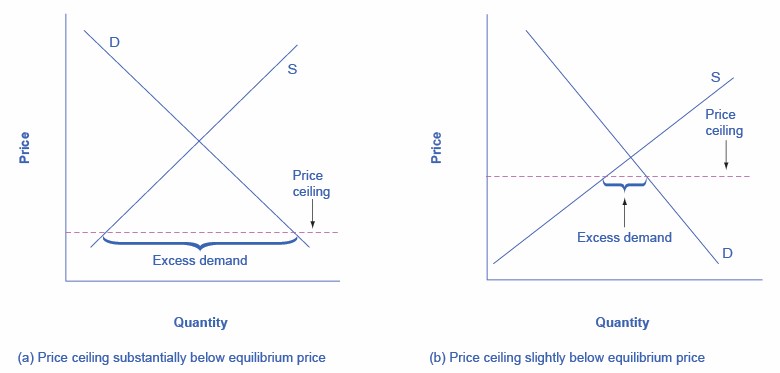 Question 10 Figure 1.8D: Excess Demand if it is Substantially Below the Equilibrium Price. Figure by Steven A. Greenlaw & David Shapiro (OpenStax), licensed by CC BY 4.0.
When the price ceiling is set substantially or slightly above the equilibrium price, it will have no effect on creating excess demand. The following figure illustrates these situations.
Question 10 Figure 1.8D: Excess Demand if it is Substantially Below the Equilibrium Price. Figure by Steven A. Greenlaw & David Shapiro (OpenStax), licensed by CC BY 4.0.
When the price ceiling is set substantially or slightly above the equilibrium price, it will have no effect on creating excess demand. The following figure illustrates these situations.Question 10 Figure 1.8D: Excess Demand if it is Substantially Below the Equilibrium Price (Text Version)
There are two graphs with the same vertical axis is Price (P) and the horizontal axis is Quantity (Q). Graph A: Price ceiling substantially below equilibrium price. The supply curve (S) slopes upward from left to right. The demand curve (D) occurs slightly to the left slopes downward from left to right. Shows a dashed price ceiling line that is substantially below equilibrium has more excess demand. Graph B: Price ceiling slightly below equilibrium price. The supply curve (S) occurs slightly to lower to the left and slopes more gradually upward from left to right. The demand curve (D) slopes downward from left to right. Shows a dashed price floor line that is just slightly below equilibrium has less excess demand.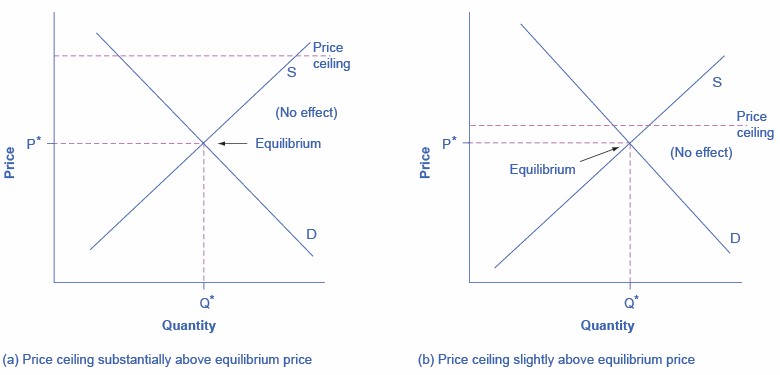 Question 10 Figure 1.8E: Price Ceiling is Set Substantially or Slightly Above the Equilibrium Price. Figure by Steven A. Greenlaw & David Shapiro (OpenStax), licensed under CC BY 4.0.
Question 10 Figure 1.8E: Price Ceiling is Set Substantially or Slightly Above the Equilibrium Price (Text Version)
There are two graphs with the same vertical axis is Price (P) and the horizontal axis is Quantity (Q). Graph A: Price ceiling substantially above equilibrium price. The supply curve (S) slopes upward from left to right and the demand curve (D) slopes downward from left to right. The equilibrium occurs where S and D intersect, at point P* and Q*. Shows a dashed price ceiling line that is substantially above equilibrium. Graph B: Price ceiling slightly above equilibrium price. The supply curve (S) slopes upward from left to right and the demand curve (D) slopes downward from left to right. The equilibrium occurs where S and D intersect, at point P* and Q*. Shows a dashed price ceiling line that is just slightly above equilibrium. - Neither. A shift in demand or supply means that at every price, either a greater or a lower quantity is demanded or supplied. A price floor does not shift a demand curve or a supply curve. However, if the price floor is set above the equilibrium, it will cause the quantity supplied on the supply curve to be greater than the quantity demanded on the demand curve, leading to excess supply.
- Neither. A shift in demand or supply means that at every price, either a greater or a lower quantity is demanded or supplied. A price ceiling does not shift a demand curve or a supply curve. However, if the price ceiling is set below the equilibrium, it will cause the quantity demanded on the demand curve to be greater than the quantity supplied on the supply curve, leading to excess demand.
