8.8 – Self-Check, Critical Thinking & Review Questions
Self-Check Questions
- Suppose the adult population over the age of 16 is 237.8 million and the labour force is 153.9 million (of whom 139.1 million are employed). How many people are “not in the labour force?” What are the proportions of employed, unemployed and not in the labour force in the population? Hint: Proportions are percentages.
- Using the above data, what is the unemployment rate? These data are U.S. statistics from 2010. How does it compare to the February 2015 unemployment rate computed earlier?
- Over the long term, has the U.S. unemployment rate generally trended up, trended down, or remained at basically the same level?
-
- Whites or non-Whites?
- The young or the middle-aged?
- College graduates or high school graduates?
-
- Beginning in the 1970s and continuing for three decades, women entered the U.S. labour force in a big way. If we assume that wages are sticky in a downward direction, but that around 1970 the demand for labour equaled the supply of labour at the current wage rate, what do you imagine happened to the wage rate, employment, and unemployment as a result of increased labour force participation?
- Is the increase in labour force participation rates among women better thought of as causing an increase in cyclical unemployment or an increase in the natural rate of unemployment? Why?
- Many college students graduate from college before they have found a job. When graduates begin to look for a job, they are counted as what category of unemployed?
Check your answers[1]
Critical Thinking Questions
- Using the definition of the unemployment rate, is an increase in the unemployment rate necessarily a bad thing for a nation?
- Is a decrease in the unemployment rate necessarily a good thing for a nation? Explain.
- If many workers become discouraged from looking for jobs, explain how the number of jobs could decline but the unemployment rate could fall at the same time.
- Would you expect hidden unemployment to be higher, lower, or about the same when the unemployment rate is high, say 10%, versus low, say 4%? Explain.
- Is the higher unemployment rates for minority workers necessarily an indication of discrimination? What could be some other reasons for the higher unemployment rate?
- While unemployment is highly negatively correlated with the level of economic activity, in the real world it responds with a lag. In other words, firms do not immediately lay off workers in response to a sales decline. They wait a while before responding. Similarly, firms do not immediately hire workers when sales pick up. What do you think accounts for the lag in response time?
- Why do you think that unemployment rates are lower for individuals with more education?
- Do you think it is rational for workers to prefer sticky wages to wage cuts, when the consequence of sticky wages is unemployment for some workers? Why or why not? How do the reasons for sticky wages explained in this section apply to your argument?
- Under what condition would a decrease in unemployment be bad for the economy?
- Under what condition would an increase in the unemployment rate be a positive sign?
- As the baby boom generation retires, the ratio of retirees to workers will increase noticeably. How will this affect the Social Security program? How will this affect the standard of living of the average American?
- Unemployment rates have been higher in many European countries in recent decades than in the United States. Is the main reason for this long-term difference in unemployment rates more likely to be cyclical unemployment or the natural rate of unemployment? Explain briefly.
- Is it desirable to pursue a goal of zero unemployment? Why or why not?
- Is it desirable to eliminate natural unemployment? Why or why not? Hint: Think about what our economy would look like today and what assumptions would have to be met to have a zero rate of natural unemployment.
- The U.S. unemployment rate increased from 4.6% in July 2001 to 5.9% by June 2002. Without studying the subject in any detail, would you expect that a change of this kind is more likely to be due to cyclical unemployment or a change in the natural rate of unemployment? Why?
Review Questions
- What is the difference between being unemployed and being out of the labour force?
- How do you calculate the unemployment rate? How do you calculate the labour force participation rate?
- Are all adults who do not hold jobs counted as unemployed?
- If you are out of school but working part time, are you considered employed or unemployed in U.S. labour statistics? If you are a full time student and working 12 hours a week at the college cafeteria are you considered employed or not in the labour force? If you are a senior citizen who is collecting social security and a pension and working as a greeter at Wal-Mart are you considered employed or not in the labour force?
- What happens to the unemployment rate when unemployed workers are reclassified as discouraged workers?
- What happens to the labour force participation rate when employed individuals are reclassified as unemployed? What happens when they are reclassified as discouraged workers?
- What are some of the problems with using the unemployment rate as an accurate measure of overall joblessness?
- What criteria do the BLS use to count someone as employed? As unemployed?
- Assess whether the following would be counted as “unemployed” in the Current Employment Statistics survey.
- A husband willingly stays home with children while his wife works.
- A manufacturing worker whose factory just closed down.
- A college student doing an unpaid summer internship.
- A retiree.
- Someone who has been out of work for two years but keeps looking for a job.
- Someone who has been out of work for two months but isn’t looking for a job.
- Someone who hates her present job and is actively looking for another one.
- Someone who decides to take a part time job because she could not find a full time position.
- Are U.S. unemployment rates typically higher, lower, or about the same as unemployment rates in other high-income countries?
- Are U.S. unemployment rates distributed evenly across the population?
- When would you expect cyclical unemployment to be rising? Falling?
- Why is there unemployment in a labour market with flexible wages?
- Name and explain some of the reasons why wages are likely to be sticky, especially in downward adjustments.
- What term describes the remaining level of unemployment that occurs even when the economy is healthy?
- What forces create the natural rate of unemployment for an economy?
- Would you expect the natural rate of unemployment to be roughly the same in different countries?
- Would you expect the natural rate of unemployment to remain the same within one country over the long run of several decades?
- What is frictional unemployment? Give examples of frictional unemployment.
- What is structural unemployment? Give examples of structural unemployment.
- After several years of economic growth, would you expect the unemployment in an economy to be mainly cyclical or mainly due to the natural rate of unemployment? Why?
- What type of unemployment (cyclical, frictional, or structural) applies to each of the following:
- landscapers laid off in response to a drop in new housing construction during a recession.
- coal miners laid off due to EPA regulations that shut down coal fired power
- a financial analyst who quits his/her job in Chicago and is pursing similar work in Arizona
- printers laid off due to drop in demand for printed catalogues and flyers as firms go the
internet to promote an advertise their products. - factory workers in the U.S. laid off as the plants shut down and move to Mexico and Ireland.
Problems
- A country with a population of eight million adults has five million employed, 500,000 unemployed, and the rest of the adult population is out of the labour force. What’s the unemployment rate? What share of population is in the labour force? Sketch a pie chart that divides the adult population into these three groups.
- A government passes a family-friendly law that no companies can have evening, nighttime, or weekend hours, so that everyone can be home with their families during these times. Analyze the effect of this law using a demand and supply diagram for the labour market: first assuming that wages are flexible, and then assuming that wages are sticky downward.
- As the baby boomer generation retires, what should happen to wages and employment? Can you show this graphically?
Attribution
Except where otherwise noted, this chapter is adapted from “Self-Check Questions“, “Answer Key – Chapter 21“, “Critical Thinking Questions“, “Review Questions” and “Problems” In Principles of Microeconomics 2e (Open Stax) by Steven A. Greenlaw & David Shapiro, licensed under CC BY4.0.
Access for free at Principles of Microeconomics 2e
-
- The population is divided into those “in the labour force” and those “not in the labour force.” Thus, the number of adults not in the labour force is[latex]{\scriptsize 237.8 – 153.9 = 83.9 \; \text{million}}[/latex].. Since the labour force is divided into employed persons and unemployed persons, the number of unemployed persons is [latex]{\scriptsize 153.9 – 139.1 = 14.8 \; \text{million}}[/latex]. Thus, the adult population has the following proportions:
- [latex]{\scriptsize139.1 \div 237.8 = 58.5\%\; \text{employed persons}}[/latex]
- [latex]{\scriptsize14.8 \div 237.8 = 6.2\% \; \text{unemployed persons}}[/latex]
- [latex]{\scriptsize 83.9\div237.8= 35.3\% \; \text{persons out of the labour force}}[/latex]
- The unemployment rate is defined as the number of unemployed persons as a percentage of the labour force or [latex]{\scriptsize14.8 \div 153.9 = 9.6\%}[/latex]. This is higher than the February 2015 unemployment rate, computed earlier, of 5.5%.
- Over the long term, the U.S. unemployment rate has remained basically the same level.
- Non-Whites
- The young
- High school graduates
- Because of the influx of women into the labour market, the supply of labour shifts to the right. Since wages are sticky downward, the increased supply of labour causes an increase in people looking for jobs (Qs), but no change in the number of jobs available (Qe). As a result, unemployment increases by the amount of the increase in the labour supply. This can be seen in the following figure. Over time, as labour demand grows, the unemployment will decline and eventually wages will begin to increase again. But this increase in labour demand goes beyond the scope of this problem.
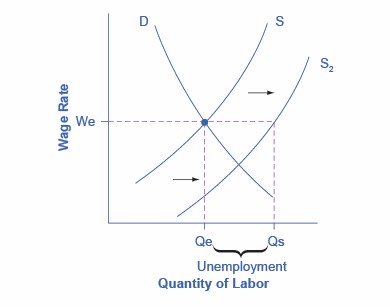
Figure 8.8a (Text Version)
The vertical axis is Wage Rate and the horizontal axis is Quantity of Labour. The demand curve (D) slopes downward from left to right. The original supply curve (S) slopes upward from left to right. S and D intersects at We and Qe. Because of the influx of women into the labour market, the original supply curve (S) shifts to the right and down to S2. Since wages are sticky downward, the increased supply of labour causes an increase in people looking for jobs (Qs), which occurs at the same wage rate (We); however, there is no change in the number of jobs available (Qe). As a result, unemployment increases by the amount of the increase in the labour supply. Unemployment is shown by the distance between Qe and Qs. - The increase in labour supply was a social demographic trend—it was not caused by the economy falling into a recession. Therefore, the influx of women into the work force increased the natural rate of unemployment.
- New entrants to the labour force, whether from college or otherwise, are counted as frictionally unemployed until they find a job.
- The population is divided into those “in the labour force” and those “not in the labour force.” Thus, the number of adults not in the labour force is[latex]{\scriptsize 237.8 – 153.9 = 83.9 \; \text{million}}[/latex].. Since the labour force is divided into employed persons and unemployed persons, the number of unemployed persons is [latex]{\scriptsize 153.9 – 139.1 = 14.8 \; \text{million}}[/latex]. Thus, the adult population has the following proportions:
