1.4 – How To Organize Economies: An Overview of Economic Systems
Learning Objectives
- Contrast traditional economies, command economies, and market economies
- Explain gross domestic product (GDP)
- Assess the importance and effects of globalization
Think about what a complex system a modern economy is. It includes all production of goods and services, all buying and selling, all employment. The economic life of every individual is interrelated, at least to a small extent, with the economic lives of thousands or even millions of other individuals. Who organizes and coordinates this system? Who ensures that, for example, the number of televisions a society provides is the same as the amount it needs and wants? Who ensures that the right number of employees work in the electronics industry? Who ensures that televisions are produced in the best way possible? How does it all get done?
There are at least three ways that societies organize an economy. The first is the traditional economy, which is the oldest economic system and is used in parts of Asia, Africa, and South America. Traditional economies organize their economic affairs the way they have always done (i.e., tradition). Occupations stay in the family. Most families are farmers who grow the crops using traditional methods. What you produce is what you consume. Because tradition drives the way of life, there is little economic progress or development.
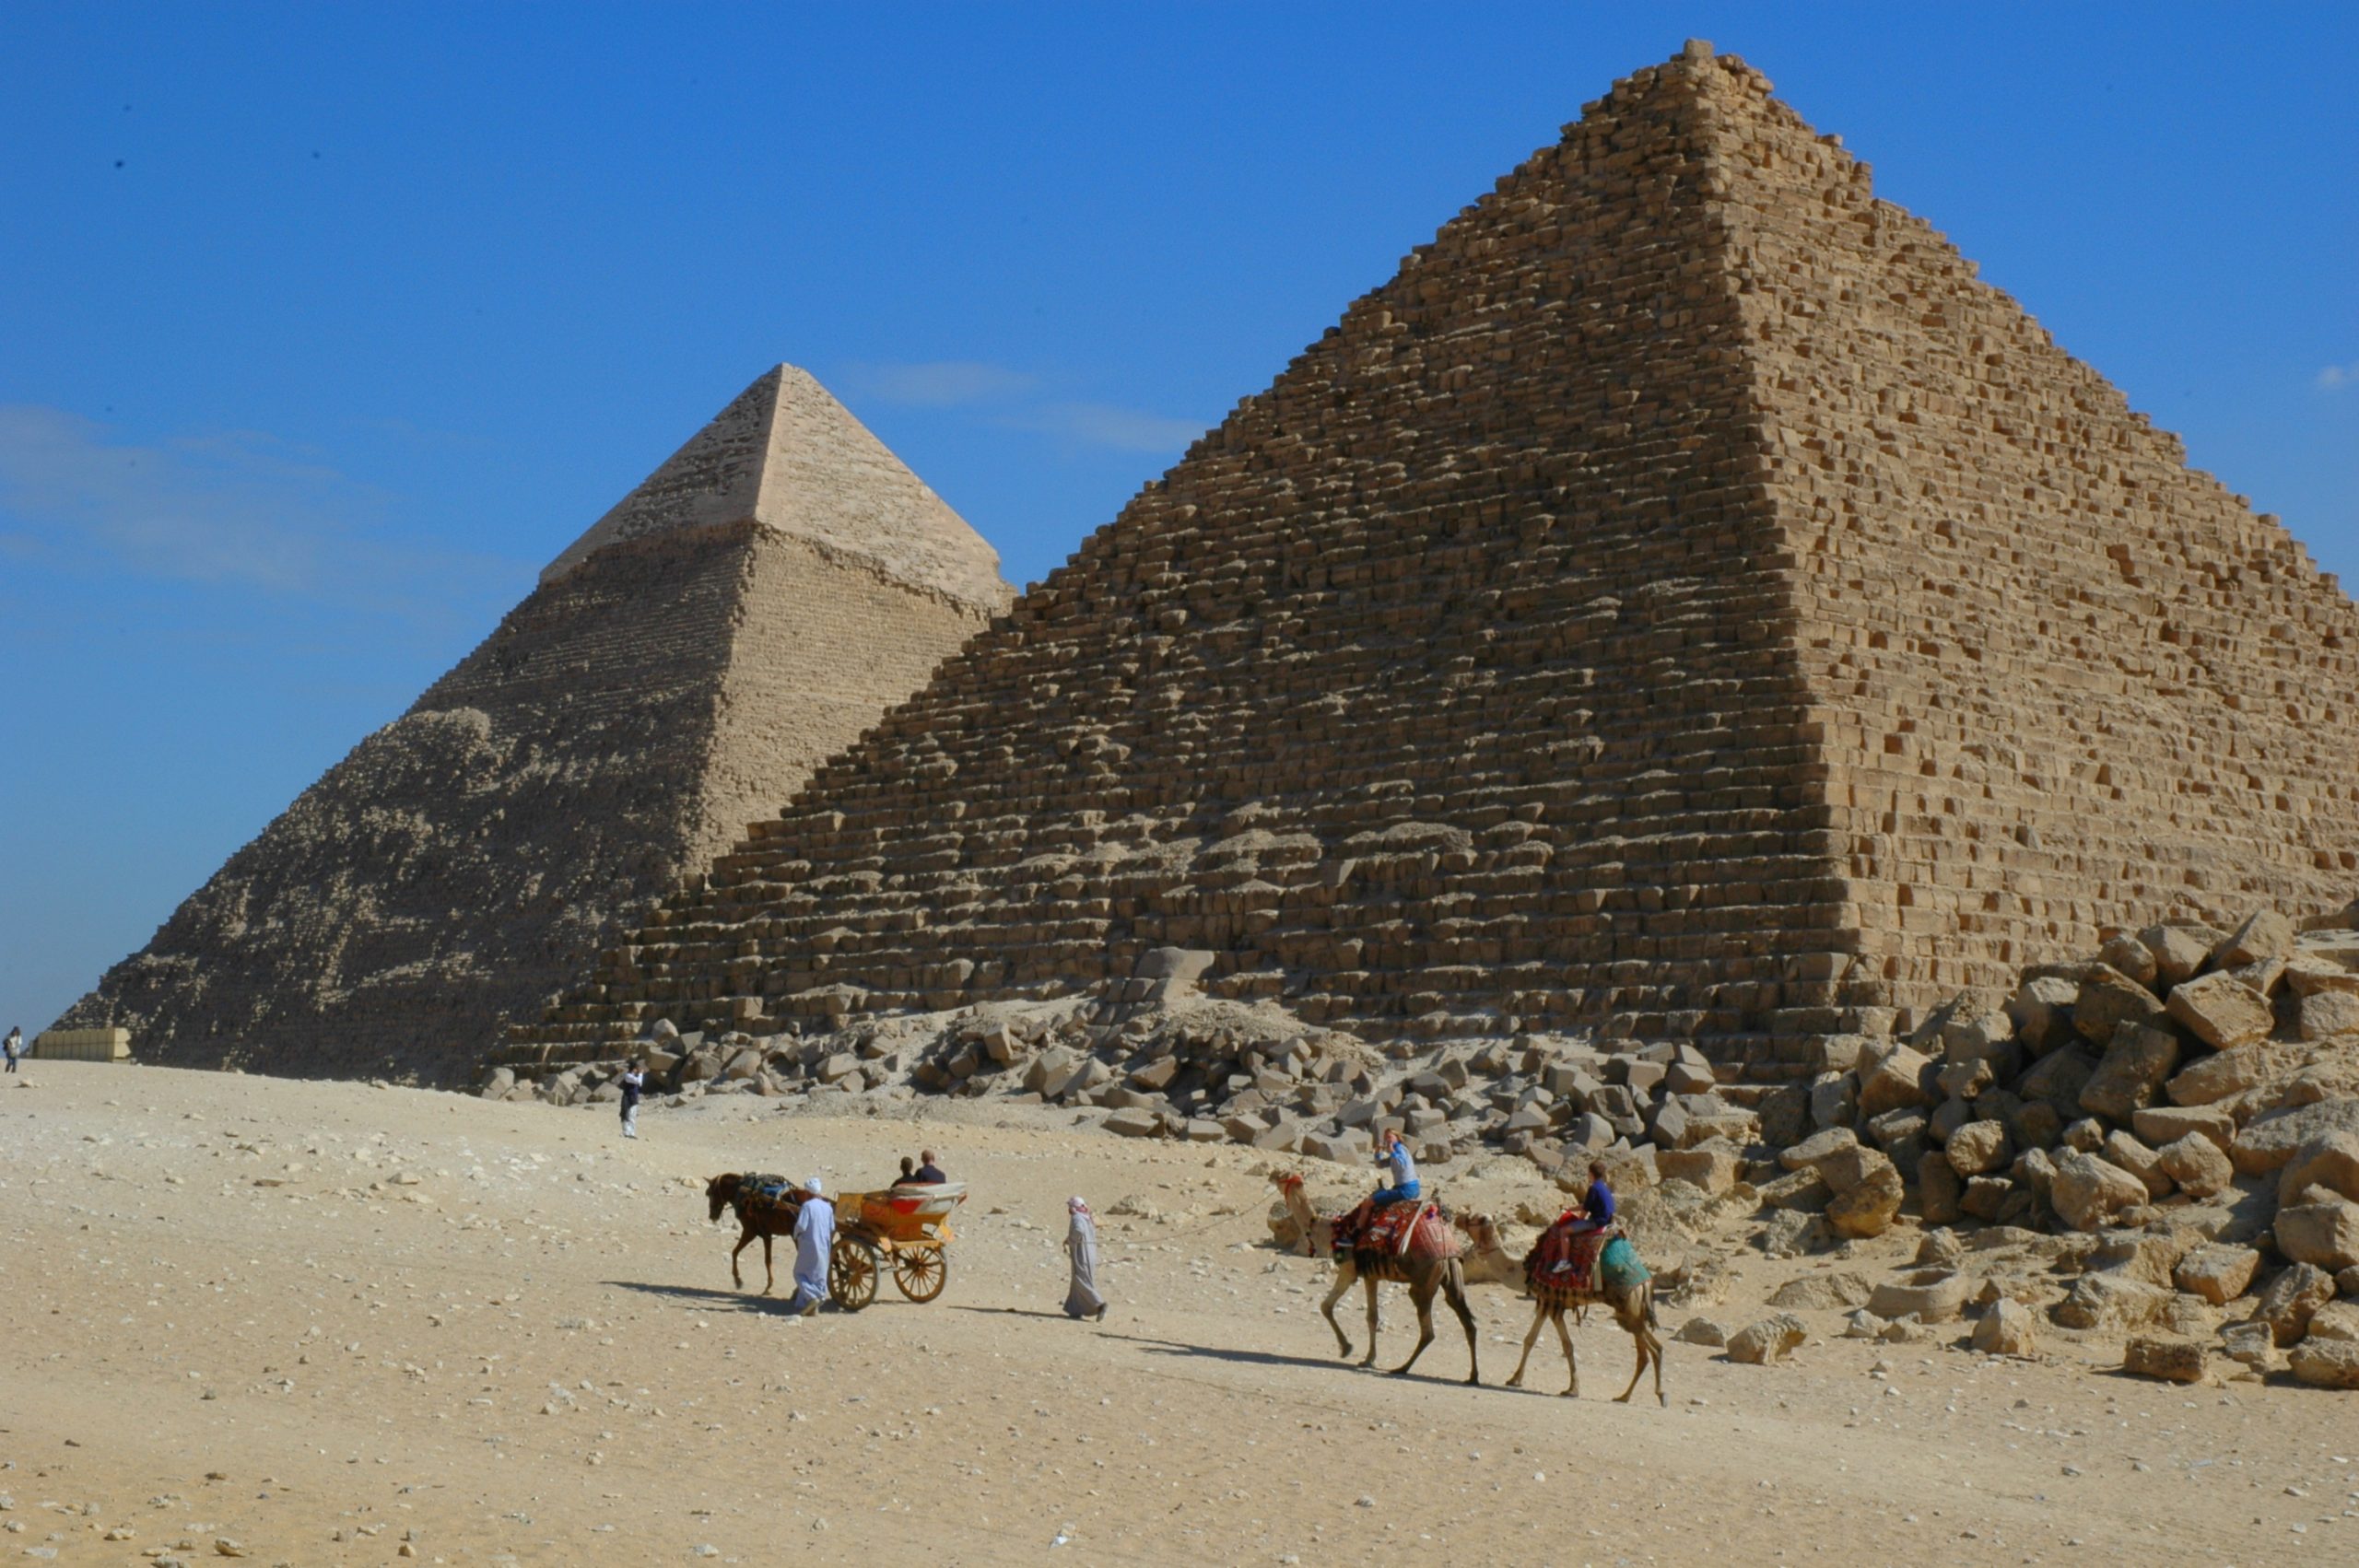
Command economies are very different. In a command economy, economic effort is devoted to goals passed down from a ruler or ruling class. Ancient Egypt was a good example: a large part of economic life was devoted to building pyramids, like those in Figure 1.4a, for the pharaohs. Medieval manor life is another example: the lord provided the land for growing crops and protection in the event of war. In return, vassals provided labour and soldiers to do the lord’s bidding. In the last century, communism emphasized command economies.
In a command economy, the government decides what goods and services will be produced and what prices it will charge for them. The government decides what methods of production to use and sets wages for workers. The government provides many necessities like healthcare and education for free. Currently, Cuba and North Korea have command economies.

Although command economies have a very centralized structure for economic decisions, market economies have a very decentralized structure. A market is an institution that brings together buyers and sellers of goods or services, who may be either individuals or businesses. The New York Stock Exchange (Figure 1.4b) is a prime example of a market which brings buyers and sellers together. In a market economy, decision-making is decentralized. Market economies are based on private enterprise: the private individuals or groups of private individuals own and operate the means of production (resources and businesses). Businesses supply goods and services based on demand. (In a command economy, by contrast, the government owns resources and businesses.) Supply of goods and services depends on what the demands are. A person’s income is based on his or her ability to convert resources (especially labour) into something that society values. The more society values the person’s output, the higher the income (think Lady Gaga or LeBron James). In this scenario, market forces, not governments, determine economic decisions.
Most economies in the real world are mixed. They combine elements of command and market (and even traditional) systems. The U.S. economy is positioned toward the market-oriented end of the spectrum. Many countries in Europe and Latin America, while primarily market-oriented, have a greater degree of government involvement in economic decisions than the U.S. economy. China and Russia, while over the past several decades have moved more in the direction of having a market-oriented system, remain closer to the command economy end of the spectrum. The Heritage Foundation provides perspective on countries’ economic freedom, as the following Clear It Up feature discusses.
Clear It UP
What countries are considered economically free?
Who is in control of economic decisions? Are people free to do what they want and to work where they want? Are businesses free to produce when they want and what they choose, and to hire and fire as they wish? Are banks free to choose who will receive loans, or does the government control these kinds of choices? Each year, researchers at the Heritage Foundation and the Wall Street Journal look at 50 different categories of economic freedom for countries around the world. They give each nation a score based on the extent of economic freedom in each category. Note that while the Heritage Foundation/WSJ index is widely cited by an array of scholars and publications, it should be regarded as only one viewpoint. Some experts indicate that the index’s category choices and scores are politically biased. However, the index and others like it provide a useful resource for critical discussion of economic freedom.
The 2016 Heritage Foundation’s Index of Economic Freedom report ranked 178 countries around the world: Table 1.4a lists some examples of the most free and the least free countries. Although technically not a separate country, Hong Kong has been granted a degree of autonomy such that, for purposes of measuring economic statistics, it is often treated as a separate country. Several additional countries were not ranked because of extreme instability that made judgments about economic freedom impossible. These countries include Afghanistan, Iraq, Libya, Syria, Somalia, and Yemen.
The assigned rankings are inevitably based on estimates, yet even these rough measures can be useful for discerning trends. In 2015, 101 of the 178 included countries shifted toward greater economic freedom, although 77 of the countries shifted toward less economic freedom. In recent decades, the overall trend has been a higher level of economic freedom around the world.
| Most Economic Freedom | Least Economic Freedom |
|---|---|
| 1. Hong Kong | 167. Timor-Leste |
| 2. Singapore | 168. Democratic Republic of Congo |
| 3. New Zealand | 169. Argentina |
| 4. Switzerland | 170. Equatorial Guinea |
| 5. Australia | 171. Iran |
| 6. Canada | 172. Republic of Congo |
| 7. Chile | 173. Eritrea |
| 8. Ireland | 74. Turkmenistan |
| 9. Estonia | 175. Zimbabwe |
| 10. United Kingdom | 176. Venezuela |
| 11. United States | 177. Cuba |
| 12. Denmark | 178. North Korea |
Regulations: The Rules of the Game
Markets and government regulations are always entangled. There is no such thing as an absolutely free market. Regulations always define the “rules of the game” in the economy. Economies that are primarily market-oriented have fewer regulations—ideally just enough to maintain an even playing field for participants. At a minimum, these laws govern matters like safeguarding private property against theft, protecting people from violence, enforcing legal contracts, preventing fraud, and collecting taxes. Conversely, even the most command-oriented economies operate using markets. How else would buying and selling occur? The government heavily regulates decisions of what to produce and prices to charge. Heavily regulated economies often have underground economies (or black markets), which are markets where the buyers and sellers make transactions without the government’s approval.The question of how to organize economic institutions is typically not a black-or-white choice between all market or all government, but instead involves a balancing act over the appropriate combination of market freedom and government rules.
The Rise of Globalization
Recent decades have seen a trend toward globalization, which is the expanding cultural, political, and economic connections between people around the world. One measure of this is the increased buying and selling of goods, services, and assets across national borders—in other words, international trade and financial capital flows.
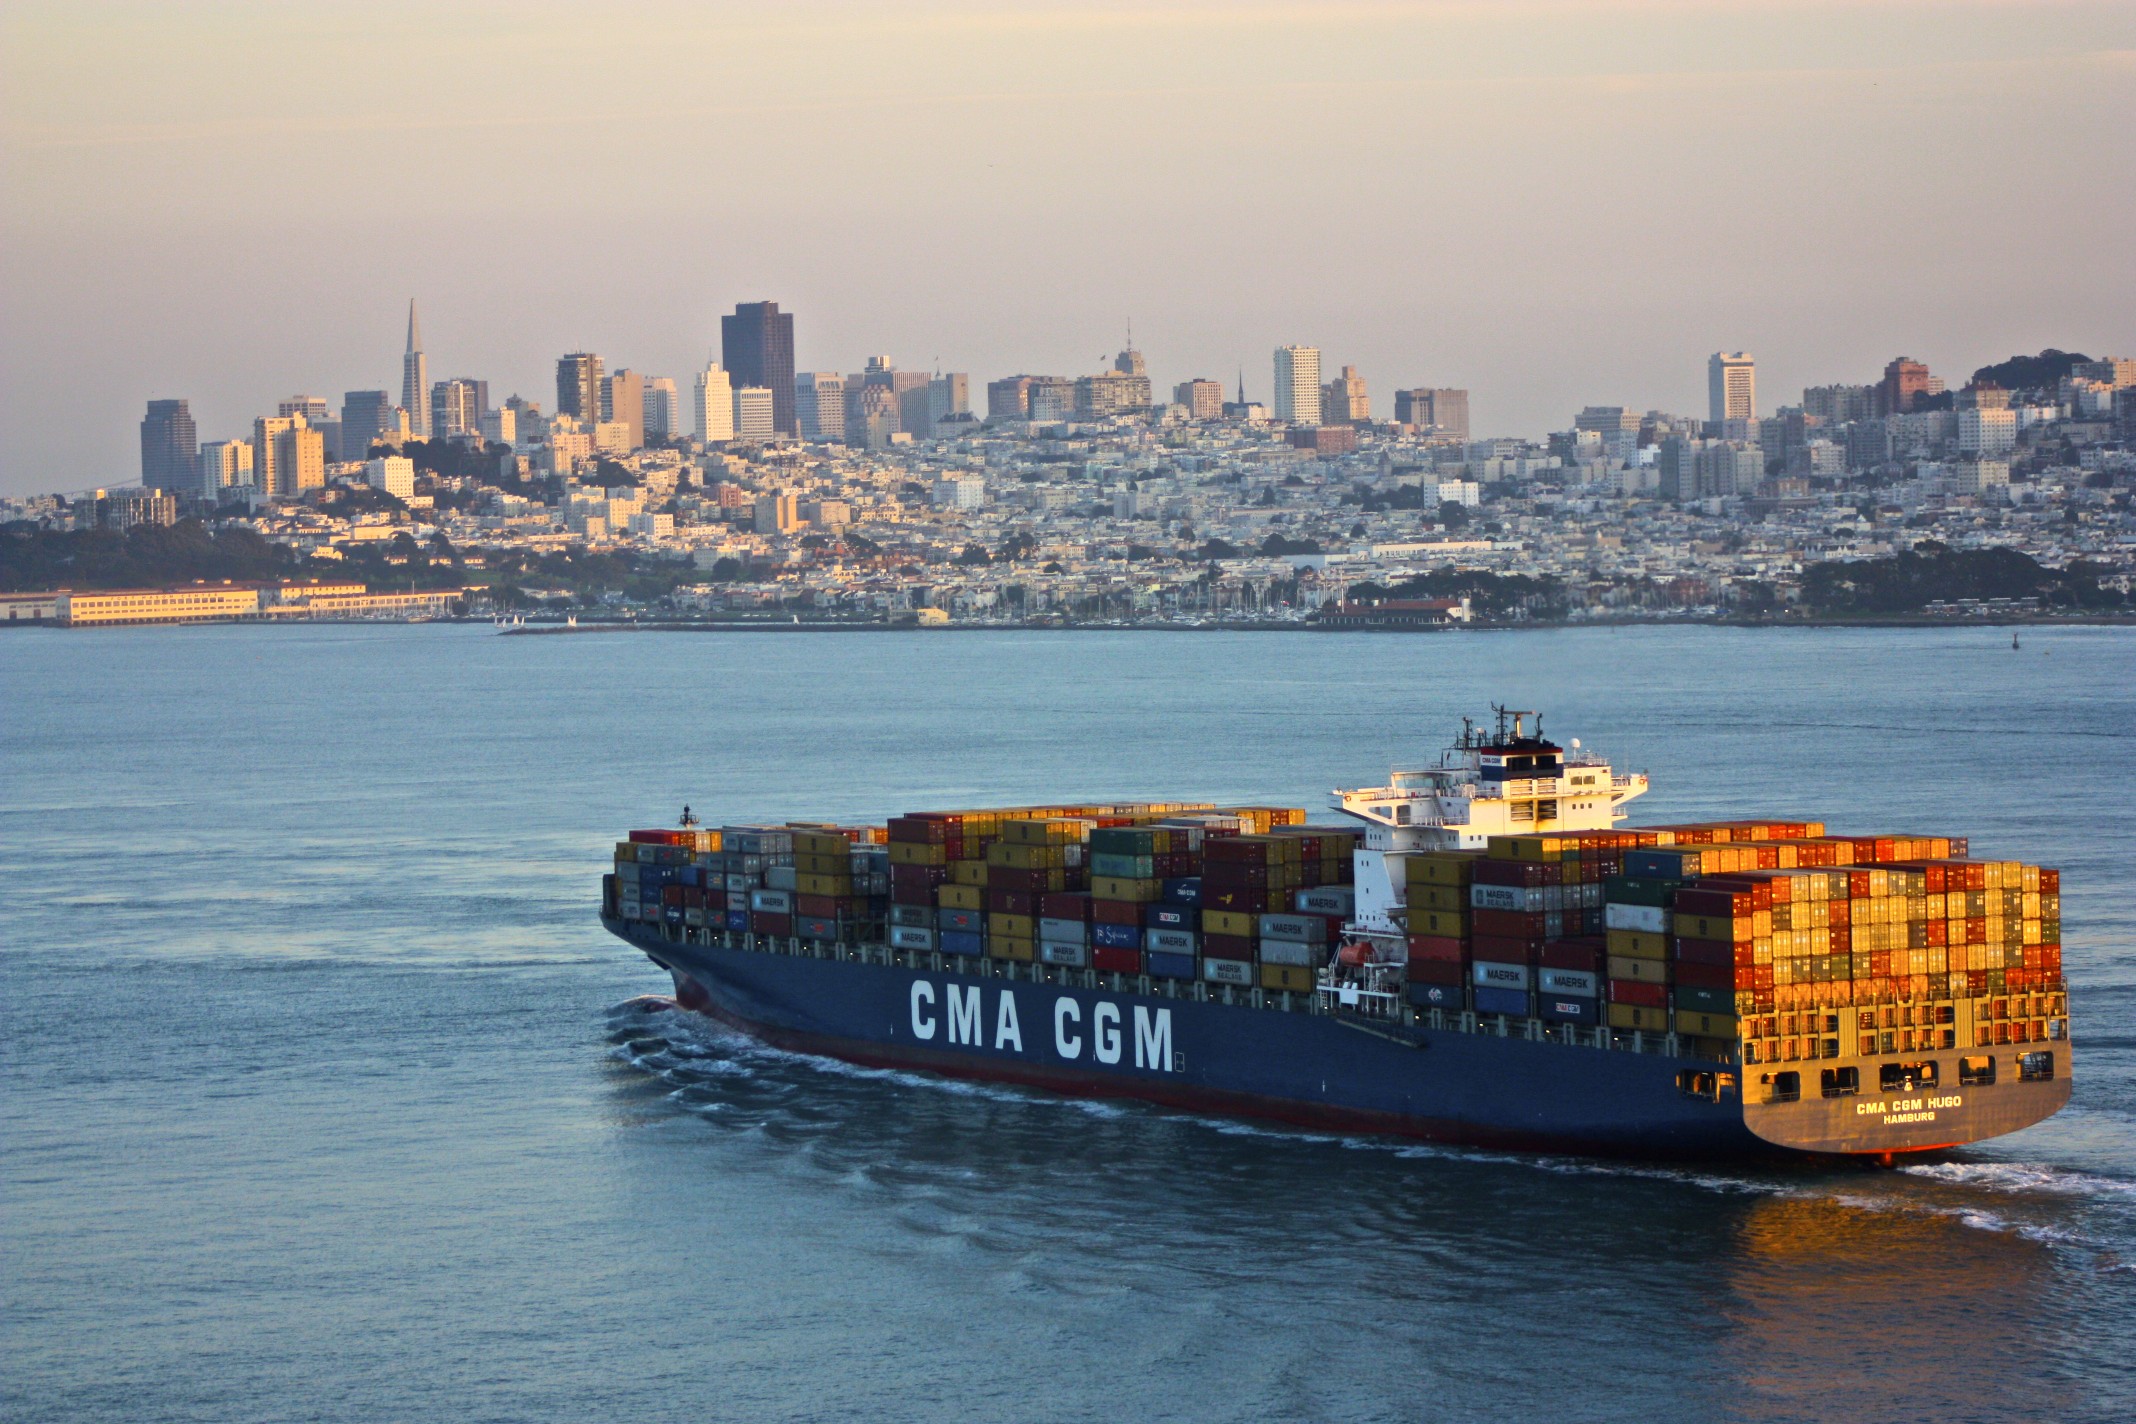
Globalization has occurred for a number of reasons. Improvements in shipping, as illustrated by the container ship in Figure 1.4c, and air cargo have driven down transportation costs. Innovations in computing and telecommunications have made it easier and cheaper to manage long-distance economic connections of production and sales. Many valuable products and services in the modern economy can take the form of information—for example: computer software; financial advice; travel planning; music, books and movies; and blueprints for designing a building. These products and many others can be transported over telephones and computer networks at ever-lower costs. Finally, international agreements and treaties between countries have encouraged greater trade.
Table 1.4b. presents one measure of globalization. It shows the percentage of domestic economic production that was exported for a selection of countries from 2010 to 2015, according to an entity known as The World Bank. Exports are the goods and services that one produces domestically and sells abroad. Imports are the goods and services that one produces abroad and then sells domestically. Gross domestic product (GDP) measures the size of total production in an economy. Thus, the ratio of exports divided by GDP measures what share of a country’s total economic production is sold in other countries.
| Country | 2010 | 2011 | 2012 | 2013 | 2014 | 2015 | |
|---|---|---|---|---|---|---|---|
| Higher Income Countries | |||||||
| United States | 12.4 | 13.6 | 13.6 | 13.5 | 13.5 | 12.6 | |
| Belgium | 76.2 | 81.4 | 82.2 | 82.8 | 84.0 | 84.4 | |
| Canada | 29.1 | 30.7 | 30.0 | 30.1 | 31.7 | 31.5 | |
| France | 26.0 | 27.8 | 28.1 | 28.3 | 29.0 | 30.0 | |
| Middle Income Countries | |||||||
| Brazil | 10.9 | 11.9 | 12.6 | 12.6 | 11.2 | 13.0 | |
| Mexico | 29.9 | 31.2 | 32.6 | 31.7 | 32.3 | 35.3 | |
| South Korea | 49.4 | 55.7 | 56.3 | 53.9 | 50.3 | 45.9 | |
| Lower Income Countries | |||||||
| Chad | 36.8 | 38.9 | 36.9 | 32.2 | 34.2 | 29.8 | |
| China | 29.4 | 28.5 | 27.3 | 26.4 | 23.9 | 22.4 | |
| India | 22.0 | 23.9 | 24.0 | 24.8 | 22.9 | – | |
| Nigeria | 25.3 | 31.3 | 31.4 | 18.0 | 18.4 | – | |
In recent decades, the export/GDP ratio has generally risen, both worldwide and for the U.S. economy.Interestingly, the share of U.S. exports in proportion to the U.S. economy is well below the global average, in part because large economies like the United States can contain more of the division of labour inside their national borders.However, smaller economies like Belgium, Korea, and Canada need to trade across their borders with other countries to take full advantage of division of labour, specialization, and economies of scale. In this sense, the enormous U.S. economy is less affected by globalization than most other countries.
Table 1.4b indicates that many medium and low income countries around the world, like Mexico and China, have also experienced a surge of globalization in recent decades. If an astronaut in orbit could put on special glasses that make all economic transactions visible as brightly colored lines and look down at Earth, the astronaut would see the planet covered with connections.
Despite the rise in globalization over the last few decades, in recent years we’ve seen significant pushback against globalization from people across the world concerned about loss of jobs, loss of political sovereignty, and increased economic inequality. Prominent examples of this pushback include the 2016 vote in Great Britain to exit the European Union (i.e. Brexit), and the election of Donald J. Trump for President of the United States.
Bring It Home
Decisions in the Social Media Age
The world we live in today provides nearly instant access to a wealth of information. Consider that as recently as the late 1970s, the Farmer’s Almanac, along with the Weather Bureau of the U.S. Department of Agriculture, were the primary sources American farmers used to determine when to plant and harvest their crops. Today, farmers are more likely to access, online, weather forecasts from the National Oceanic and Atmospheric Administration or watch the Weather Channel. After all, knowing the upcoming forecast could drive when to harvest crops. Consequently, knowing the upcoming weather could change the amount of crop harvested.
Some relatively new information forums, such as Facebook, are rapidly changing how information is distributed; hence, influencing decision making. In 2014, the Pew Research Center reported that 71% of online adults use Facebook. This social media forum posts topics ranging from the National Basketball Association, to celebrity singers and performers, to farmers.
Information helps us make decisions as simple as what to wear today to how many reporters the media should send to cover a crash. Each of these decisions is an economic decision. After all, resources are scarce. If the media send ten reporters to cover an accident, they are not available to cover other stories or complete other tasks. Information provides the necessary knowledge to make the best possible decisions on how to utilize scarce resources. Welcome to the world of economics!
Key Concepts & Summary
We can organize societies as traditional, command, or market-oriented economies. Most societies are a mix. The last few decades have seen globalization evolve as a result of growth in commercial and financial networks that cross national borders, making businesses and workers from different economies increasingly interdependent.
Attribution & References
Except where otherwise noted, this chapter is adapted from “How To Organize Economies: An Overview of Economic Systems and “Key Concepts and Summary“” In Principles of Microeconomics 2e (Open Stax) by Steven A. Greenlaw & David Shapiro, licensed under CC BY 4.0. / Adaptations include formatting and accessibility fixes, addition of key concepts and summary.
Access for free at Principles of Microeconomics 2e
Original Source Chapter References
Bureau of Labor Statistics, U.S. Department of Labor. 2015. “The Employment Situation—February 2015.” Accessed March 27, 2015. http://www.bls.gov/news.release/pdf/empsit.pdf.
Williamson, Lisa. “US Labor Market in 2012.” Bureau of Labor Statistics. Accessed December 1, 2013. http://www.bls.gov/opub/mlr/2013/03/art1full.pdf.
The Heritage Foundation. 2015. “2015 Index of Economic Freedom.” Accessed March 11, 2015. https://web.archive.org/web/20160529175624/http: //www.heritage.org/index/ranking
Garling, Caleb. “S.F. plane crash: Reporting, emotions on social media,” The San Francisco Chronicle. July 7, 2013. http://www.sfgate.com/news/article/S-F-plane-crash-Reporting-emotions-on-social-4651639.php.
Irvine, Jessica. “Social Networking Sites are Factories of Modern Ideas.” The Sydney Morning Herald. November 25, 2011.http://www.smh.com.au/federal-politics/society-and-culture/social-networking-sites-are-factories-of-modern-ideas-20111124-1nwy3.html#ixzz2YZhPYeME.
Pew Research Center. 2015. “Social Networking Fact Sheet.” Accessed March 11, 2015. http://www.pewinternet.org/fact-sheets/social-networking-fact-sheet/.
The World Bank Group. 2015. “World Data Bank.” Accessed March 30, 2014. http://databank.worldbank.org/data/.
Media Attributions
- Pyramids at Giza © Jay Bergesen is licensed under a CC BY (Attribution) license
- New York Stock Exchange © Erik Drost is licensed under a CC BY (Attribution) license
- Cargo Ship © Raul valdez is licensed under a CC BY (Attribution) license
Typically an agricultural economy where things are done the same as they have always been done
An economy where economic decisions are passed down from government authority and where the government owns the resources
Interaction between potential buyers and sellers; a combination of demand and supply
An economy where economic decisions are decentralized, private individuals own resources, and businesses supply goods and services based on demand
System where private individuals or groups of private individuals own and operate the means of production (resources and businesses)
A market where the buyers and sellers make transactions in violation of one or more government regulations
The trend in which buying and selling in markets have increasingly crossed national borders
Products (goods and services) made domestically and sold abroad
Products (goods and services) made abroad and then sold domestically
Measure of the size of total production in an economy
The way in which different workers divide required tasks to produce a good or service
When workers or firms focus on particular tasks for which they are well-suited within the overall production process
When the average cost of producing each individual unit declines as total output increases
