9.7 – Self-Check, Critical Thinking & Review Questions
Self-Check Questions
- Describe how each of these changes is likely to affect poverty and inequality:
- Incomes rise for low-income and high-income workers, but rise more for the high-income earners.
- Incomes fall for low-income and high-income workers, but fall more for high-income earners.
- Jonathon is a single father with one child. He can work as a server for $6 per hour for up to 1,500 hours per year. He is eligible for welfare, and so if he does not earn any income, he will receive a total of $10,000 per year. He can work and still receive government benefits, but for every $1 of income, his welfare stipend is $1 less. Create a table similar to Table 9.4b that shows Jonathan’s options. Use four columns, the first showing number of hours to work, the second showing his earnings from work, the third showing the government benefits he will receive, and the fourth column showing his total income (earnings + government support). Sketch a labour-leisure diagram of Jonathan’s opportunity set with and without government support.
- Imagine that the government reworks the welfare policy that was affecting Jonathan in question 1, so that for each dollar someone like Jonathan earns at work, his government benefits diminish by only 30 cents. Reconstruct the table from question 1 to account for this change in policy. Draw Jonathan’s labour-leisure opportunity sets, both for before this welfare program is enacted and after it is enacted.
- We have discovered that the welfare system discourages recipients from working because the more income they earn, the less welfare benefits they receive. How does the earned income tax credit attempt to loosen the poverty trap?
- How does the TANF attempt to loosen the poverty trap?
- A group of 10 people have the following annual incomes: $24,000, $18,000, $50,000, $100,000, $12,000, $36,000, $80,000, $10,000, $24,000, $16,000. Calculate the share of total income that each quintile receives from this income distribution. Do the top and bottom quintiles in this distribution have a greater or larger share of total income than the top and bottom quintiles of the U.S. income distribution?
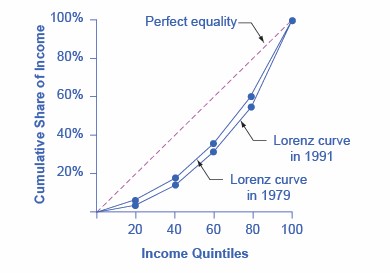
- Table 9.7a (see below) shows the share of income going to each quintile of the income distribution for the United Kingdom in 1979 and 1991. Use this data to calculate what the points on a Lorenz curve would be, and sketch the Lorenz curve. How did inequality in the United Kingdom shift over this time period? How can you see the patterns in the quintiles in the Lorenz curves?
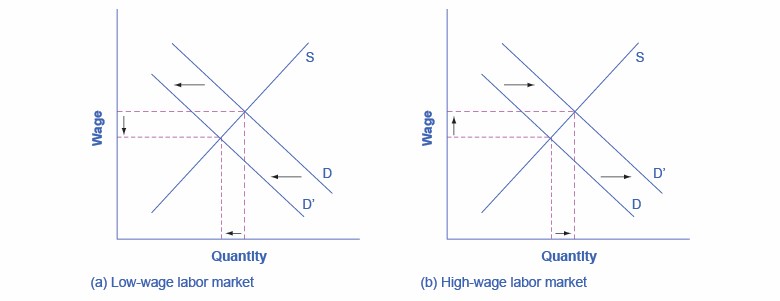
Table 9.7a Income Distribution in the United Kingdom, 1979 and 1991 Share of Income 1979 1991 Top quintile 39.7% 42.9% Fourth quintile 24.8% 22.7% Middle quintile 17.0% 16.3% Second quintile 11.5% 11.5% Bottom quintile 7.0% 6.6% - Using two demand and supply diagrams, one for the low-wage labour market and one for the high-wage labour market, explain how information technology can increase income inequality if it is a complement to high-income workers like salespeople and managers, but a substitute for low-income workers like file clerks and telephone receptionists.
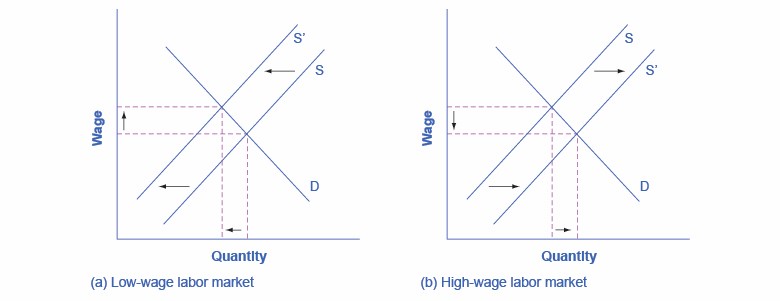
- Using two demand and supply diagrams, one for the low-wage labour market and one for the high-wage labour market, explain how a program that increased educational levels for a substantial number of low-skill workers could reduce income inequality.
- Here is one hypothesis: A well-funded social safety net can increase economic equality but will reduce economic output. Explain why this might be so, and sketch a production possibility curve that shows this tradeoff.
- Here is a second hypothesis: A well-funded social safety net may lead to less regulation of the market economy. Explain why this might be so, and sketch a production possibility curve that shows this tradeoff.
- Which set of policies is more likely to cause a tradeoff between economic output and equality: policies of redistribution or policies aimed at the ladder of opportunity? Explain how the production possibility frontier tradeoff between economic equality and output might look in each case.
- Why is there reluctance on the part of some in the United States to redistribute income so that greater equality can be achieved?
Check your answers[1]
Critical Thinking Questions
- What goods and services would you include in an estimate of the basic necessities for a family of four?
- If a family of three earned $20,000, would they be able to make ends meet given the official poverty threshold?
- Self-Check Questions question 2 and question 3 asked you to describe the labour-leisure tradeoff for Jonathon. Since, in the first example, there is no monetary incentive for Jonathon to work, explain why he may choose to work anyway. Explain what the opportunity costs of working and not working might be for Jonathon in each example. Using your tables and graphs from Self-Check question 2 and question 3, analyze how the government welfare system affects Jonathan’s incentive to work.
- Explain how you would create a government program that would give an incentive for labour to increase hours and keep labour from falling into the poverty trap.
- Many critics of government programs to help low-income individuals argue that these programs create a poverty trap. Explain how programs such as TANF, EITC, SNAP, and Medicaid will affect low-income individuals and whether or not you think these programs will benefit families and children.
- Think about the business cycle: during a recession, unemployment increases; it decreases in an expansionary phase. Explain what happens to TANF, SNAP, and Medicaid programs at each phase of the business cycle (recession, trough, expansion, and peak).
- Explain how a country may experience greater equality in the distribution of income, yet still experience high rates of poverty. Hint: Look at the Clear It Up “How do governments measure poverty in low-income countries?” and compare to Table 9.5c. Share of Aggregate Income Received by Each Fifth and Top 5% of Households, 1967–2013 (Source: U.S. Census Bureau, Table 2).
- The demand for skilled workers in the United States has been increasing. To increase the supply of skilled workers, many argue that immigration reform to allow more skilled labour into the United States is needed. Explain whether you agree or disagree.
- Explain a situation using the supply and demand for skilled labour in which the increased number of college graduates leads to depressed wages. Given the rising cost of going to college, explain why a college education will or will not increase income inequality.
- What do you think is more important to focus on when considering inequality: income inequality or wealth inequality?
- To reduce income inequality, should the marginal tax rates on the top 1% be increased?
- Redistribution of income occurs through the federal income tax and government antipoverty programs. Explain whether or not this level of redistribution is appropriate and whether more redistribution should occur.
- How does a society or a country make the decision about the tradeoff between equality and economic output? Hint: Think about the political system.
- Explain what the long- and short-term consequences are of not promoting equality or working to reduce poverty.
Review Questions
- How is the poverty rate calculated?
- What is the poverty line?
- What is the difference between poverty and income inequality?
- How does the poverty trap discourage people from working?
- How can the effect of the poverty trap be reduced?
- Who are the near-poor?
- What is the safety net?
- Briefly explain the differences between TANF, the earned income tax credit, SNAP, and Medicaid.
- Who is included in the top income quintile?
- What is measured on the two axes of a Lorenz curve?
- If a country had perfect income equality what would the Lorenz curve look like?
- How has the inequality of income changed in the U.S. economy since the late 1970s?
- What are some reasons why a certain degree of inequality of income would be expected in a market economy?
- What are the main reasons economists give for the increase in inequality of incomes?
- Identify some public policies that can reduce the level of economic inequality.
- Describe how a push for economic equality might reduce incentives to work and produce output. Then describe how a push for economic inequality might not have such effects.
Problems
- In country A, the population is 300 million and 50 million people are living below the poverty line. What is the poverty rate?
- In country B, the population is 900 million and 100 million people are living below the poverty line. What is the poverty rate?
- Susan is a single mother with three children. She can earn $8 per hour and works up to 1,800 hours per year. However, if she does not earn any income at all, she will receive government benefits totaling $16,000 per year. For every $1 of income she earns, her level of government support will be reduced by $1. Create a table, patterned after Self Check Question 3 Table Data. The table should have columns: number of work hours, earnings from work, government benefits, and total income. The first column should show Susan’s choices of how many hours to work per year, up to 1,800 hours. The second column should show her earnings from work. The third column should show her level of government support, given her earnings. The final column should show her total income, combining earnings and government support. Based on the table you created, what are the likely impacts of this kind of assistance program on Susan’s incentive to work? Are there additional opportunity costs that may reduce her incentive to work?
- A group of 10 people have the following annual incomes: $55,000, $30,000, $15,000, $20,000, $35,000, $80,000, $40,000, $45,000, $30,000, $50,000. Calculate the share of total income each quintile of this income distribution received. Do the top and bottom quintiles in this distribution have a greater or larger share of total income than the top and bottom quintiles of the U.S. income distribution for 2005?
Attribution
Except where otherwise noted, this chapter is adapted from “Self-Check Questions“, “Answer Key – Chapter 15“, “Critical Thinking Questions“, “Review Questions” and “Problems” In Principles of Microeconomics 2e (Open Stax) by Steven A. Greenlaw & David Shapiro, licensed under CC BY 4.0.
Access for free at Principles of Microeconomics 2e
-
- a)Poverty falls, inequality rises. b)Poverty rises, inequality falls.
- Jonathon’s options for working and total income are shown in the following table. His labour-leisure diagram is shown in the figure following the table.
Table 9.7b Question 2 Table Data Number of Work Hours Earnings from Work Government Benefits Total Income 1,500 $9,000 $1,000 $10,000 1,200 $7,200 $2,800 $10,000 900 $5,400 $4,600 $10,000 600 $3,600 $6,400 $10,000 300 $1,800 $8,200 $10,000 0 $0 $10,000 $10,000 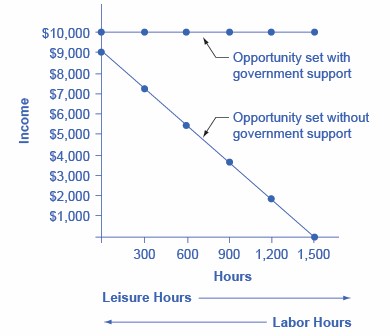 Question 2 Figure 9.7a. Figure by Steven A. Greenlaw & David Shapiro (OpenStax), licensed under CC BY 4.0.
Question 2 Figure 9.7a (Text Version)
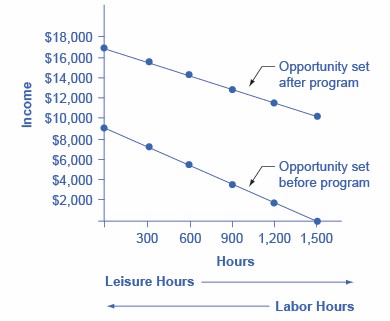
The vertical axis is Income (thousands of dollars) and the horizontal axis is leisure in hours. Line 1: "Opportunity set without government support" line slopes downward from left to right at points listed in Question 2 Table Data above in columns Number of Work Hours and Earnings from Work (Line 1). Line 2: "Opportunity set with government support" is a horizontal line at $10,000. Points listed in Question 2 Table Data above in columns Government Benefits and Total Income (Line 2). - The following table shows a policy where only 30 cents in government support is pulled right back for every $1 of income earned. Jonathon’s labour-leisure diagram is shown in the figure following the Question 3 Table Data. “Opportunity set after program” extends from (0 hours, $16,300) to (1,500 hours, $10,000). “Opportunity set before program” slopes downward from (0 hours, $9,000) to (1,500 hours, $0).
Table 9.7c - Question 3 Table Data Number of Work Hours Earnings from Work Government Benefits Total Income 1,500 $9,000 $7,300 $16,300 1,200 $7,200 $7,840 $15,040 900 $5,400 $8,380 $13,780 600 $3,600 $8,920 $12,520 300 $1,800 $9,460 $22,260 0 $0 $10,000 $10,000 - The earned income tax credit works like this: a poor family receives a tax break that increases according to how much they work. Families that work more get more. In that sense it loosens the poverty trap by encouraging work. As families earn above the poverty level, the earned income tax credit is gradually reduced. For those near-poor families, the earned income tax credit is a partial disincentive to work.
- TANF attempts to loosen the poverty trap by providing incentives to work in other ways. Specifically, it requires that people work (or complete their education) as a condition of receiving TANF benefits, and it places a time limit on benefits.
- QA useful first step is to rank the households by income, from lowest to highest. Then, since there are 10 households total, the bottom quintile will be the bottom two households, the second quintile will be the third and fourth households, and so on up to the top quintile. The quintiles and percentage of total income for the data provided are shown in the following table. Comparing this distribution to the U.S. income distribution for 2005, the top quintile in the example has a smaller share of total income than in the U.S. distribution and the bottom quintile has a larger share. This pattern usually means that the income distribution in the example is more equal than the U.S. distribution.
Table 9.7d Question 6 Table Data Income Quintile % of Total Income $10,000 Total first quintile income: $22,000 6.0% $12,000 $16,000 Total second quintile income: $34,000 9.2% $18,000 $24,000 Total third quintile income: $48,000 13.0% $24,000 $36,000 Total fourth quintile income: $86,000 23.2% $50,000 $80,000 Total top quintile income: $180,000 48.6% $100,000 $370,000 Total Income - - Just from glancing at the quintile information, it is fairly obvious that income inequality increased in the United Kingdom over this time: The top quintile is getting a lot more, and the lowest quintile is getting a bit less. Converting this information into a Lorenz curve, however, is a little trickier, because the Lorenz curve graphs the cumulative distribution, not the amount received by individual quintiles. Thus, as explained in the text, you have to add up the individual quintile data to convert the data to this form. The following table shows the actual calculations for the share of income in 1979 versus 1991. The figure following the table shows the perfect equality line and the Lorenz curves for 1979 and 1991. As shown, the income distribution in 1979 was closer to the perfect equality line than the income distribution in 1991—that is, the United Kingdom income distribution became more unequal over time.
- In the market for low-wage labour, information technology shifts the demand for low-wage labour to the left. One reason is that technology can often substitute for low-wage labour in certain kinds of telephone or bookkeeping jobs. In addition, information technology makes it easier for companies to manage connections with low-wage workers in other countries, thus reducing the demand for low-wage workers in the United States. In the market for high-wage labour, information technology shifts the demand for high-wage labour to the right. By using the new information and communications technologies, high-wage labour can become more productive and can oversee more tasks than before. The following figure illustrates these two labour markets. The combination of lower wages for low-wage labour and higher wages for high-wage labour means greater inequality.
- In the market for low-wage labour, a skills program will shift supply to the left, which will tend to drive up wages for the remaining low-skill workers. In the market for high-wage labour, a skills program will shift supply to the right (because after the training program there are now more high-skilled workers at every wage), which will tend to drive down wages for high-skill workers. The combination of these two programs will result in a lesser degree of inequality. The following figure illustrates these two labour markets. In the market for high-wage labour, a skills program will shift supply to the right, which will tend to drive down wages for high-skill workers.
- A very strong push for economic equality might include extremely high taxes on high-wage earners to pay for extremely large government social payments for the poor. Such a policy could limit incentives for the high-wage workers, lock the poor into a poverty trap, and thus reduce output. The PPF in this case will have the standard appearance: it will be downward sloping.
- For the second hypothesis, a well-funded social safety net might make people feel that even if their company goes bankrupt or they need to change jobs or industries, they will have some degree of protection. As a result, people may be more willing to allow markets to work without interference, and not to lobby as hard for rules that would prevent layoffs, set price controls, or block foreign trade. In this case, safety net programs that increase equality could also allow the market to work more freely in a way that could increase output. In this case, at least some portion of the PPF between equality and economic output would slope up.
- Pure redistribution is more likely to cause a sharp tradeoff between economic output and equality than policies aimed at the ladder of opportunity. A production possibility frontier showing a strict tradeoff between economic output and equality will be downward sloping. A PPF showing that it is possible to increase equality, at least to some extent, while either increasing output or at least not diminishing it would have a PPF that first rises, perhaps has a flat area, and then falls.