2.7 – Applications of the Production Possibilities Model
Learning Objectives
- Define economic growth in terms of the production possibilities model and discuss factors that make such growth possible.
- Explain the classification of economic systems, the role of government in different economic systems, and the strengths and weaknesses of different systems.
The production possibilities curve gives us a model of an economy. The model provides powerful insights about the real world, insights that help us to answer some important questions: What determines the rate at which production will increase over time? What is the role of economic freedom in the economy? In this section we explore applications of the model to questions of economic growth and the choice of an economic system.
Economic Growth
An increase in the physical quantity or in the quality of factors of production available to an economy or a technological gain will allow the economy to produce more goods and services; it will shift the economy’s production possibilities curve outward. The process through which an economy achieves an outward shift in its production possibilities curve is called economic growth. An outward shift in a production possibilities curve is illustrated in Figure 2.7a “Economic Growth and the Production Possibilities Curve”. In Panel (a), a point such as N is not attainable; it lies outside the production possibilities curve. Growth shifts the curve outward, as in Panel (b), making previously unattainable levels of production possible.
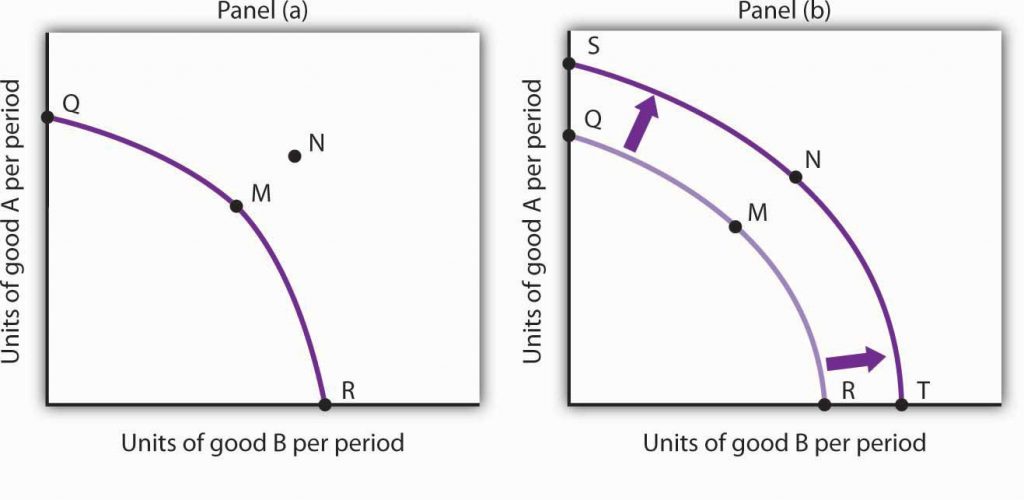
Figure 2.7a Economic Growth and the Production Possibilities Curve (Text version)
Figure 2.7a depits two graphs, both have a vertical axis of Units of goods A per period and a horizontal axis Units of good B per period.
Panel A, has a downward sloping convex curve which slopes from left to right starting midway up the vertical axis at Point Q goes through Point M and ending at R on the horizontal axis. Point N lays outside and above the curve; therefore, a point such as N is not attainable as it lies outside the production possibilities curve.
Panel B shows growth that shifts the curve outward, making previously unattainable levels of production possible. Panel B is the same graph as Panel A but depicts the curve shifting outwards to obtain Point N. The curve shifts outward: Point Q shifts upwards to Point S, Point M shift to Point N and Point R shift to the left to Point T.
An economy capable of producing two goods, A and B, is initially operating at point M on production possibilities curve OMR in Panel (a). Given this production possibilities curve, the economy could not produce a combination such as shown by point N, which lies outside the curve. An increase in the factors of production available to the economy would shift the curve outward to SNT, allowing the choice of a point such as N, at which more of both goods will be produced.
The Sources of Economic Growth
Economic growth implies an outward shift in an economy’s production possibilities curve. Recall that when we draw such a curve, we assume that the quantity and quality of the economy’s factors of production and its technology are unchanged. Changing these will shift the curve. Anything that increases the quantity or quality of the factors of production available to the economy or that improves the technology available to the economy contributes to economic growth.
Consider, for example, the dramatic gains in human capital that have occurred in the United States since the beginning of the past century. In 1900, about 3.5% of U.S. workers had completed a high school education. By 2006, that percentage rose almost to 92. Fewer than 1% of the workers in 1900 had graduated from college; as late as 1940 only 3.5% had graduated from college. By 2006, nearly 32% had graduated from college. In addition to being better educated, today’s workers have received more and better training on the job. They bring far more economically useful knowledge and skills to their work than did workers a century ago.
Moreover, the technological changes that have occurred within the past 100 years have greatly reduced the time and effort required to produce most goods and services. Automated production has become commonplace. Innovations in transportation (automobiles, trucks, and airplanes) have made the movement of goods and people cheaper and faster. A dizzying array of new materials is available for manufacturing. And the development of modern information technology—including computers, software, and communications equipment—that seemed to proceed at breathtaking pace especially during the final years of the last century and continuing to the present has transformed the way we live and work.
Look again at the technological changes of the last few years described in the Case in Point on advances in technology. Those examples of technological progress through applications of computer technology—from new ways of mapping oil deposits to new methods of milking cows—helped propel the United States and other economies to dramatic gains in the ability to produce goods and services. They have helped shift the countries’ production possibilities curve outward. They have helped fuel economic growth.
Waiting for Growth
One key to growth is, in effect, the willingness to wait, to postpone current consumption in order to enhance future productive capability. When Stone Age people fashioned the first tools, they were spending time building capital rather than engaging in consumption. They delayed current consumption to enhance their future consumption; the tools they made would make them more productive in the future.
Resources society could have used to produce consumer goods are being used to produce new capital goods and new knowledge for production instead—all to enhance future production. An even more important source of growth in many nations has been increased human capital. Increases in human capital often require the postponement of consumption. If you are a college student, you are engaged in precisely this effort. You are devoting time to study that could have been spent working, earning income, and thus engaging in a higher level of consumption. If you are like most students, you are making this choice to postpone consumption because you expect it will allow you to earn more income, and thus enjoy greater consumption, in the future.
Think of an economy as being able to produce two goods, capital and consumer goods (those destined for immediate use by consumers). By focusing on the production of consumer goods, the people in the economy will be able to enjoy a higher standard of living today. If they reduce their consumption—and their standard of living—today to enhance their ability to produce goods and services in the future, they will be able to shift their production possibilities curve outward. That may allow them to produce even more consumer goods. A decision for greater growth typically involves the sacrifice of present consumption.
Arenas for Choice: A Comparison of Economic Systems
Under what circumstances will a nation achieve efficiency in the use of its factors of production? The discussion above suggested that Christie Ryder would have an incentive to allocate her plants efficiently because by doing so she could achieve greater output of skis and snowboards than would be possible from inefficient production. But why would she want to produce more of these two goods—or of any goods? Why would decision makers throughout the economy want to achieve such efficiency?
Economists assume that privately owned firms seek to maximize their profits. The drive to maximize profits will lead firms such as Alpine Sports to allocate resources efficiently to gain as much production as possible from their factors of production. But whether firms will seek to maximize profits depends on the nature of the economic system within which they operate.
Classifying Economic Systems
Each of the world’s economies can be viewed as operating somewhere on a spectrum between market capitalism and command socialism. In a market capitalist economy, resources are generally owned by private individuals who have the power to make decisions about their use. A market capitalist system is often referred to as a free enterprise economic system. In a command socialist economy, the government is the primary owner of capital and natural resources and has broad power to allocate the use of factors of production. Between these two categories lie mixed economies that combine elements of market capitalist and of command socialist economic systems.
No economy represents a pure case of either market capitalism or command socialism. To determine where an economy lies between these two types of systems, we evaluate the extent of government ownership of capital and natural resources and the degree to which government is involved in decisions about the use of factors of production.
Figure 2.7b “Economic Systems” suggests the spectrum of economic systems. Market capitalist economies lie toward the left end of this spectrum; command socialist economies appear toward the right. Mixed economies lie in between. The market capitalist end of the spectrum includes countries such as the United States, the United Kingdom, and Canada. Hong Kong, though now part of China, has a long history as a market capitalist economy and is generally regarded as operating at the market capitalist end of the spectrum. Countries at the command socialist end of the spectrum include North Korea and Cuba.
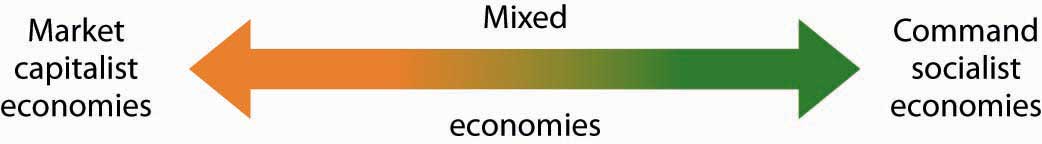
Some European economies, such as France, Germany, and Sweden, have a sufficiently high degree of regulation that we consider them as operating more toward the center of the spectrum. Russia and China, which long operated at the command socialist end of the spectrum, can now be considered mixed economies. Most economies in Latin America once operated toward the right end of the spectrum. While their governments did not exercise the extensive ownership of capital and natural resources that are one characteristic of command socialist systems, their governments did impose extensive regulations. Many of these nations are in the process of carrying out economic reforms that will move them further in the direction of market capitalism.
The global shift toward market capitalist economic systems that occurred in the 1980s and 1990s was in large part the result of three important features of such economies. First, the emphasis on individual ownership and decision-making power has generally yielded greater individual freedom than has been available under command socialist or some more heavily regulated mixed economic systems that lie toward the command socialist end of the spectrum. People seeking political, religious, and economic freedom have thus gravitated toward market capitalism. Second, market economies are more likely than other systems to allocate resources on the basis of comparative advantage. They thus tend to generate higher levels of production and income than do other economic systems. Third, market capitalist-type systems appear to be the most conducive to entrepreneurial activity.
Suppose Christie Ryder had the same three plants we considered earlier in this chapter but was operating in a mixed economic system with extensive government regulation. In such a system, she might be prohibited from transferring resources from one use to another to achieve the gains possible from comparative advantage. If she were operating under a command socialist system, she would not be the owner of the plants and thus would be unlikely to profit from their efficient use. If that were the case, there is no reason to believe she would make any effort to assure the efficient use of the three plants. Generally speaking, it is economies toward the market capitalist end of the spectrum that offer the greatest inducement to allocate resources on the basis of comparative advantage. They tend to be more productive and to deliver higher material standards of living than do economies that operate at or near the command socialist end of the spectrum.
Government in a Market Economy
The production possibilities model provides a menu of choices among alternative combinations of goods and services. Given those choices, which combinations will be produced?
In a market economy, this question is answered in large part through the interaction of individual buyers and sellers. As we have already seen, government plays a role as well. It may seek to encourage greater consumption of some goods and discourage consumption of others. In the United States, for example, taxes imposed on cigarettes discourage smoking, while special treatment of property taxes and mortgage interest in the federal income tax encourages home ownership. Government may try to stop the production and consumption of some goods altogether, as many governments do with drugs such as heroin and cocaine. Government may supplement the private consumption of some goods by producing more of them itself, as many U.S. cities do with golf courses and tennis courts. In other cases, there may be no private market for a good or service at all. In the choice between security and defense versus all other goods and services outlined at the beginning of this chapter, government agencies are virtually the sole providers of security and national defense.
All nations also rely on government to provide defense, enforce laws, and redistribute income. Even market economies rely on government to regulate the activities of private firms, to protect the environment, to provide education, and to produce a wide range of other goods and services. Government’s role may be limited in a market economy, but it remains fundamentally important.
Key Takeaways
- The ideas of comparative advantage and specialization suggest that restrictions on international trade are likely to reduce production of goods and services.
- Economic growth is the result of increasing the quantity or quality of an economy’s factors of production and of advances in technology.
- Policies to encourage growth generally involve postponing consumption to increase capital and human capital.
- Market capitalist economies have generally proved more productive than mixed or command socialist economies.
- Government plays a crucial role in any market economy.
Try It!
Draw a production possibilities curve for an economy that can produce two goods, CD players and jackets. You do not have numbers for this one—just draw a curve with the usual bowed-out shape. Put the quantity of CD players per period on the vertical axis and the quantity of jackets per period on the horizontal axis. Now mark a point A on the curve you have drawn; extend dotted lines from this point to the horizontal and vertical axes. Mark the initial quantities of the two goods as CDA and JA, respectively. Explain why, in the absence of economic growth, an increase in jacket production requires a reduction in the production of CD players. Now show how economic growth could lead to an increase in the production of both goods.
Check your answers [1]
Case in Point: The European Union and the Production Possibilities Curve

Formed by the Maastricht Treaty of 1993, The European Union represents one of the boldest efforts of our time to exploit the theory of comparative advantage. The Treaty sought to eliminate all trade barriers between the European Union’s members. It established a European Parliament and a European Central Bank. The Bank introduced the euro in 1999, a currency that replaced national currencies such as the German deutsche mark and the French franc. At first, the euro was used only for transactions between banks. 320 million people in 15 EU nations (Austria, Belgium, Cyprus, Finland, France, Germany, Greece, Ireland, Italy, Luxembourg, Malta, the Netherlands, Portugal, Slovenia, and Spain) used the euro by 2008. While the dollar continues to be more widely used, the total value of euros in circulation exceeds that of dollars.
The movement toward European integration can be dated back more than half a century. In 1950, just five years after a war that had devastated much of the world, Robert Schuman, the French Minister of Foreign Affairs, proposed a union between France and Germany to cooperate in the production of iron and steel. In the context of the time, Schuman’s proposal was a radical one. World War II had begun with Germany’s attempt to seize control of Europe—and ultimately the world. Japan and Italy joined Germany in this effort. Germany had captured France; France had been liberated in 1944 by the Allied invasion in Normandy. The proposal for cooperation between two countries that had been the most bitter of enemies was a revolutionary one. Schuman’s speech, delivered on May 9, 1950, is celebrated throughout Europe as “Europe Day.”
In effect, the European Union has created an entity very much like the United States. Countries within the European Union retain their own languages and cultural differences, but they have ceded a remarkable degree of sovereignty to the Union. Members of the European Union can trade as freely with each other as can states within the United States. Just as the U.S. Constitution prohibits states from restricting trade with other states, the European Union has dismantled all forms of restrictions that countries within the Union used to impose on one another. Just as restrictions on specialization among Ms. Ryder’s plants in Alpine Sports would have forced it to operate inside its production possibilities curve, restrictions that had existed among members of the European Union once put the members of the Union inside their collective production possibilities curve.
The experiment appears to have been a success. Trade among member nations has expanded sharply. A study by Carmen Diaz Mora, an economist at the University of Castilla-La Mancha in Spain, found that the bulk of the expanded trade within the Union was trade within industries and that it was driven by comparative advantage. In particular, she found that countries in the northern part of the Union, such as France and Germany, tended to specialize in relatively high-valued goods—office equipment and electrical goods—while countries in the southern part of the Union specialized in relatively low-valued goods such as food and textile products. In trade within the clothing industry, countries such as Italy tend to specialize in the production of higher-valued clothing, while lower-income countries such as Portugal specialize in the production of cheaper clothing. In sparkling wines, France specializes in the higher-quality end of the spectrum, while Spain specializes in the low-quality end. Similarly, Germany specializes in the production of higher-quality cars while Spain specializes in lower-quality vehicles. Similar exchanges occur across a wide range of goods and services.
Diaz Mora found that comparative advantage tended to correspond to income levels. Countries in the northern part of the European Union tend to have high per capita incomes and high levels of human capital and technology—these countries gained by specializing in the production of high-valued goods. Countries in the southern part of the Union also gained by specialization—in the production of low-valued goods. This specialization has increased the welfare of people throughout the Union.
Sources: Carmen Diaz Mora, “The Role of Comparative Advantage in Trade Within Industries: A Panel Data Approach for the European Union,” Weltwirtschaftliches Archiv 138:2 (2002), 291–316.
Attribution
Except where otherwise noted, this chapter is adapted from “Applications of the Production Possibilities Model” In BUS 400 Business Economics by Sandra Wellman, licensed under CC BY-NC-SA 4.0 / A derivative of Principles of Economics by University of Minnesota Libraries Publishing, licensed under CC BY-NC-SA. / Adaptations include removal of:
- Table 2.1 Sources of U.S. Economic Growth, 1948–2002 and accompanying content
- Figure 2.15 Economic Freedom and Income and accompanying content.
Media Attributions
- Economic Growth and the Production Possibilities Curve © University of Minnesota is licensed under a CC BY-NC-SA (Attribution NonCommercial ShareAlike) license
- Economic Systems © University of Minnesota is licensed under a CC BY-NC-SA (Attribution NonCommercial ShareAlike) license
- Found euros © Dana McMahan is licensed under a CC BY-NC (Attribution NonCommercial) license
-
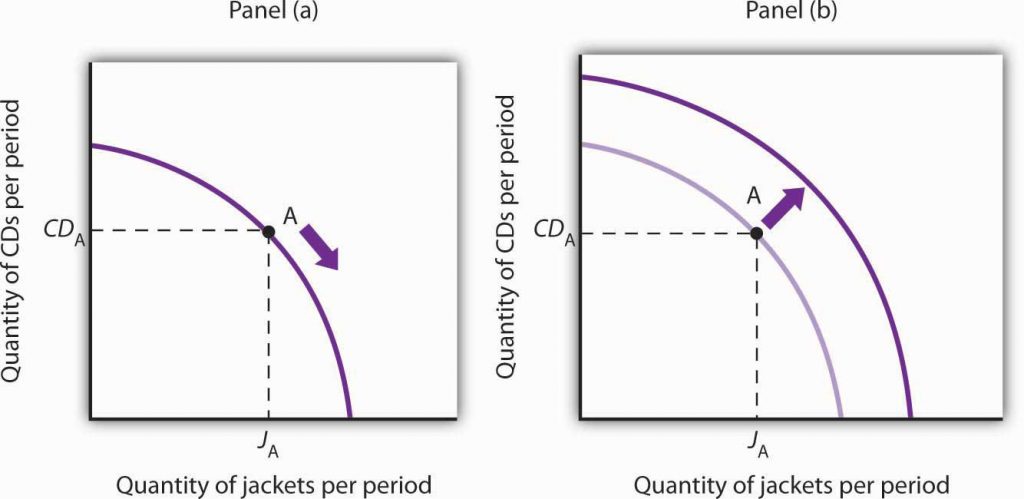 Figure 2.7c. Figure by University of Minnesota, licensed under CC BY-NC-SA 4.0.
Your first production possibilities curve should resemble the one in Panel (a). Starting at point A, an increase in jacket production requires a move down and to the right along the curve, as shown by the arrow, and thus a reduction in the production of CD players. Alternatively, if there is economic growth, it shifts the production possibilities curve outward, as in Panel (b). This shift allows an increase in production of both goods, as suggested by the arrow.
↵
Figure 2.7c. Figure by University of Minnesota, licensed under CC BY-NC-SA 4.0.
Your first production possibilities curve should resemble the one in Panel (a). Starting at point A, an increase in jacket production requires a move down and to the right along the curve, as shown by the arrow, and thus a reduction in the production of CD players. Alternatively, if there is economic growth, it shifts the production possibilities curve outward, as in Panel (b). This shift allows an increase in production of both goods, as suggested by the arrow.
↵Figure 2.7c Answer to Try it! Problem Text Version
Figure 2.7c depicts two graphs that have the horizontal axis Quantity of CDs per period and a vertical axis Quantity of jackets per period. Panel A depicts a downward sloping convex curve which slopes from left to right, intersecting Point A is located at ( JA, CDA). Starting at point A, an increase in jacket production requires a move down and to the right along the curve (shown downward arrow) and thus a reduction in the production of CD players. Panel B depicts the same base figure as Panel A, a downward sloping convex curve which slopes from left to right, intersecting Point A is located at ( JA, CDA). The curve shifts outward from Point A, shifting from left to right (shown by arrow pointing left to right).
