3.11 – Learn By Doing: Shortage and Surplus
Try It
Rather than have you read more about shortage and surplus, we’d prefer to have you practice what you’ve learned so far and see for yourself if you understand it.
These questions allow you to get as much practice as you need, as you can click the link at the top of the first question (“Try another version of these questions”) to get a new version of the questions. Practice until you feel comfortable doing these questions.
Try it (Text Version)
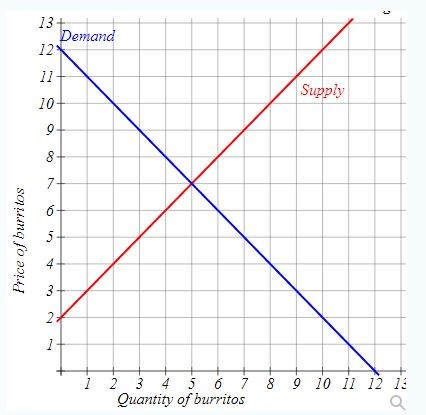
H5P Graph (Text Version)
The vertical axis is price of burritos and the horizontal axis is quantity of burritos. The demand curve slopes downward from left to right and the supply curve slopes upward from right to left. The demand and supply curve intersects at 7 price of burritos and 3 quantity of burritos. See table below for graph data.
| Supply Curve (quantity of burritos, price of burritos) | Demand Curve (quantity of burritos, price of burritos) |
|---|---|
| 0 quantity of burritos, 2 price of burritos | 0 quantity of burritos, 12 price of burritos |
| 1 quantity of burritos, 3 price of burritos | 1 quantity of burritos, 11 price of burritos |
| 2 quantity of burritos, 4 price of burritos | 2 quantity of burritos, 10 price of burritos |
| 3 quantity of burritos, 5 price of burritos | 3 quantity of burritos, 9 price of burritos |
| 4 quantity of burritos, 6 price of burritos | 4 quantity of burritos, 8 price of burritos |
| 5 quantity of burritos, 7 price of burritos | 5quantity of burritos, 7 price of burritos |
| 6 quantity of burritos, 8 price of burritos | 6 quantity of burritos, 6 price of burritos |
| 7 quantity of burritos, 9 price of burritos | 7 quantity of burritos, 5 price of burritos |
| 8 quantity of burritos, 10 price of burritos | 8 quantity of burritos, 4 price of burritos |
| 9 quantity of burritos, 11 price of burritos | 9 quantity of burritos, 3 price of burritos |
| 10 quantity of burritos, 12 price of burritos | 10 quantity of burritos, 2 price of burritos |
| 11 quantity of burritos, 13 price of burritos | 11 quantity of burritos, 1 price of burritos |
| – | 12 quantity of burritos, 0 price of burritos |
Use the graph above to answer the following questions:
- First consider a situation without any government interventions and no price controls. In that case equilibrium quantity is: _____
Tip: At the equilibrium quantity, quantity supplied equals to quality demanded - First consider a situation without any government interventions and no price controls. In that case equilibrium quantity is: ______
Tip: At the equilibrium price, quantity supplied equals to quantity demanded - Now suppose that the government imposes a Price Ceiling equal to $ 7!
As a result of this new policy, quantity demanded is: _____
Tip: First consider if the price ceiling is binding or non binding. If binding, trace that price to the demand curve - Now suppose that the government imposes a Price Ceiling equal to $ 7!
As a result of this new policy, quantity supplied is:_____
Tip: First consider if the price ceiling is binding or non binding. If binding, trace that price to the supply curve - As a result of this Price Ceiling the market is experiencing:
- Surplus
- This price control is non-binding. There will be neither a shortage nor a surplus.
- Shortage
- The amount of surplus/shortage equals _____.
Tip: If this price ceiling is binding you should be looking at the difference between the quantity demanded and the quantity supplied in question above.
Check Your answer: [1]
Activity source: “Learn By Doing: Shortage and Surplus” In by Lumen Learning, licensed under CC BY. / Converted to H5P and Text.
Attribution
Except where otherwise noted, this chapter is adapted from “Learn By Doing: Shortage and Surplus” In Microeconomics by Lumen Learning, licensed under CC BY 4.0.
Media Attributions
- Image © Lumen Learning is licensed under a CC BY (Attribution) license
- Question 1) 3 , Question 2) 5, Question 3) 3, Question 4) 3, Question 5) b) This price control is non-binding. There will be neither a shortage nor a surplus. , Question 6) 0 ↵
