

Demographic data are data that describe the population – the number of people, the number of people being added to the population, the rate of population growth, the age and sex composition of the population, and the prevalence of various family structures. The make-up of the population could also be described in terms of race, sexual identity, type of residence, educational achievement, income, health status, and an infinite number of other descriptors.

Vital Statistics are those that relate to births and deaths, marriages and divorces. For much of human history, it was up to individual families to memorize or record these critical events. In the Middle Ages, European synagogues and churches recorded key life events; some of those records from the last few hundred years still survive. Today, many governments collect birth and death data, and also marriage and divorce data.
In some developing countries today, many people are born and live their lives without being officially registered. This interferes with their ability to vote, own land, and receive loans. It also impairs the ability of government to make informed and appropriate policy decisions.
In Canada, every citizen must report birth, marriage, divorce, and death information to the provincial government. Statistics Canada collects these vital statistics as well as vital statistics for Canadians living in some American states. Citizenship and Immigration Canada documents immigration and citizenship, but not emigration. Emigration data must be inferred from other data.
Until recently, Canada has not included racial information in its vital statistics, labour statistics, homelessness statistics, and other data, something for which it has been criticized by the United Nations. Canada does ask about Aboriginal identity, country of origin, and ethnic origin in its (anonymous) census, and publishes that for each community surveyed.


A survey is a questionnaire or interview. The survey can be broad in scope or can target a particular group. The survey can follow the same group of people over time, or can be repeated over time with a randomly-selected group of people. A survey that follows the same group over time is called a longitudinal survey. Some fabulous surveys to study are available online, including the USA’s Panel Study of Income Dynamics, which tracks individual households from 1968 on. Canada’s Survey of Labour and Income Dynamics begins in 1993 and can be found at the Canadian Research Data Centre Network’s website.
International agencies such as the World Health Organization conduct many informative surveys. Currently funded by USAID, the Demographic and Health Surveys Program collects demographic data in 205 developing countries. Demographic survey data is compiled on United Nations and World Bank websites.
The opposite of a longitudinal survey is a cross-sectional survey which is a snapshot of a population at one particular point in time. The most famous cross-sectional survey is the Census.

A census (latin root: censere, to assess) in its simplest form is a count of the entire population at one point in time. These go back to ancient times; the ancient censuses often focused on men of fighting age, or those able to pay a significant amount of taxes.
Regularly scheduled national surveys of the entire population became established in many countries in the early nineteenth century. Canada’s first national census took place in 1871.

The Canadian Census is not just a count of the Canadian population, but an extensive survey of the population’s characteristics. It is conducted by Statistics Canada every 5 years. Each household is mailed a form which must be filled out and mailed back. (Online responses are also accepted.) The form contains several questions having to do with the persons in the household: their names, ages, gender, first language, and how they are related. A longer form is sent to a smaller, random selection of addresses. The longer form version includes many more questions, including questions about country of origin, Aboriginal identity, occupation, income, who pays the rent, and the condition of the house.

In 2010, the Canadian government announced that the questions on the longer form were too intrusive and that filling in the longer form would not be mandatory. The following year, the longer form census was replaced by a voluntary “National Household Survey” which asked similar questions and was mailed to 4.5 million households. One of the questions it asked was whether respondents would waive their right to privacy after 92 years, in which case their responses will become part of the National Archives after 92 years.
The response rate for the (voluntary) National Household Survey was 68.6 percent, much lower than 93.8 percent for the previous (mandatory) long form census, and much lower than the 98.4% response rate for the re-introduced (mandatory) long form census of 2016. 2011 now represents an unfortunate blip in the series of Canadian census data, a blip of less complete and thus less reliable data.
Censuses suffer from overcoverage when they include people who should not be covered (for example, visitors to the country) or when they count the same persons twice. They also suffer from undercoverage – leaving out some people who should be included. These might be people to whom forms were not sent, or people who were unwilling or unable to fill in the form. In Canada, a few First Nations do not participate in the Census.
In 2016, the Canadian Census had an estimated undercoverage rate of 4.32%, while the overcoverage rate was 1.96%.[1]

Birth and death statistics tells us who should be living in a nation; the census tells us who actually is living in that nation. The difference is migration. With immigration data, we can infer emigration.
The fundamental equation of population growth is simple:

That is to say, Population growth = natural increase – net migration.
Canada typically includes permanent residents (who are not yet citizens) in its population count. It does not include temporary foreign workers or international students in its population count.
With birth and death information from Vital Statistics, and overall population numbers from the census and other sources, we can compute birth rates and death rates for the population. In its Quarterly Demographic Estimates, Statistics Canada publishes updated summary information on Canadian birth, death, and immigration rates.
National Identity Registers
To avoid the need to estimate or cobble together statistics, some countries maintain up-to-date population registers that list all individuals with their vital events, including change of residence. These are expensive, and raise concerns about privacy and personal freedom. Britain has a “National Identity Register”. Canada and the USA do not.
Historic Data
Much detective work and deduction must be applied to the limited historical record. For Canadian historical data up to the 1970s which cannot be found at Statistics Canada, the source below is a good place to search.

Now let’s calculate some important demographic statistics.

To find the crude birth rate for a population, calculate the number of live births (babies born alive) during the year, then divide by the mid-year population. The mid-year population can be approximated by averaging the population at the beginning and the end of the year. Multiply by 1000, and you have the birth rate per 1000 people. The reason we multiply by 1000 is so that we can avoid having to report tiny numbers such as 0.0086. “8.6 per 1000” is easier to say than “0.86 percent”.
Since the population’s overall size can be significantly different at the beginning of the year compared to the end of the year, we use the midyear population as a rough average population size for the year.
The crude death rate and the net migration rate are calculated the same way.
The population in the denominator of Canada’s crude birth and crude death rates is defined as all the people whose usual residence is in Canada, including soldiers and diplomats abroad, as well as non-permanent residents of Canada. Other countries may do things differently.
We call these rates “crude” because they do not take into account the composition of the population in question. Naturally, a population having a larger proportion of women of child-bearing age will have a higher birth rate than a population with a lower proportion of women of child-bearing age. If we compare only the crude birth rates, we might conclude that the population with more women of child-bearing age has larger families. That might not be true.
Fertility rates give us more precise data about family size than do than birth rates. The general fertility rate is the number of live births divided by the midyear population of women of childbearing age. This at least adjusts for the number of women of childbearing age. One can also calculate age-specific fertility rates, which are fertility rates specific to a particular age group. For example,

The general fertility rate, like the birth rate, will depend not only on the age-specific fertility rates but also on the age structure of the population and how many of each age are women.
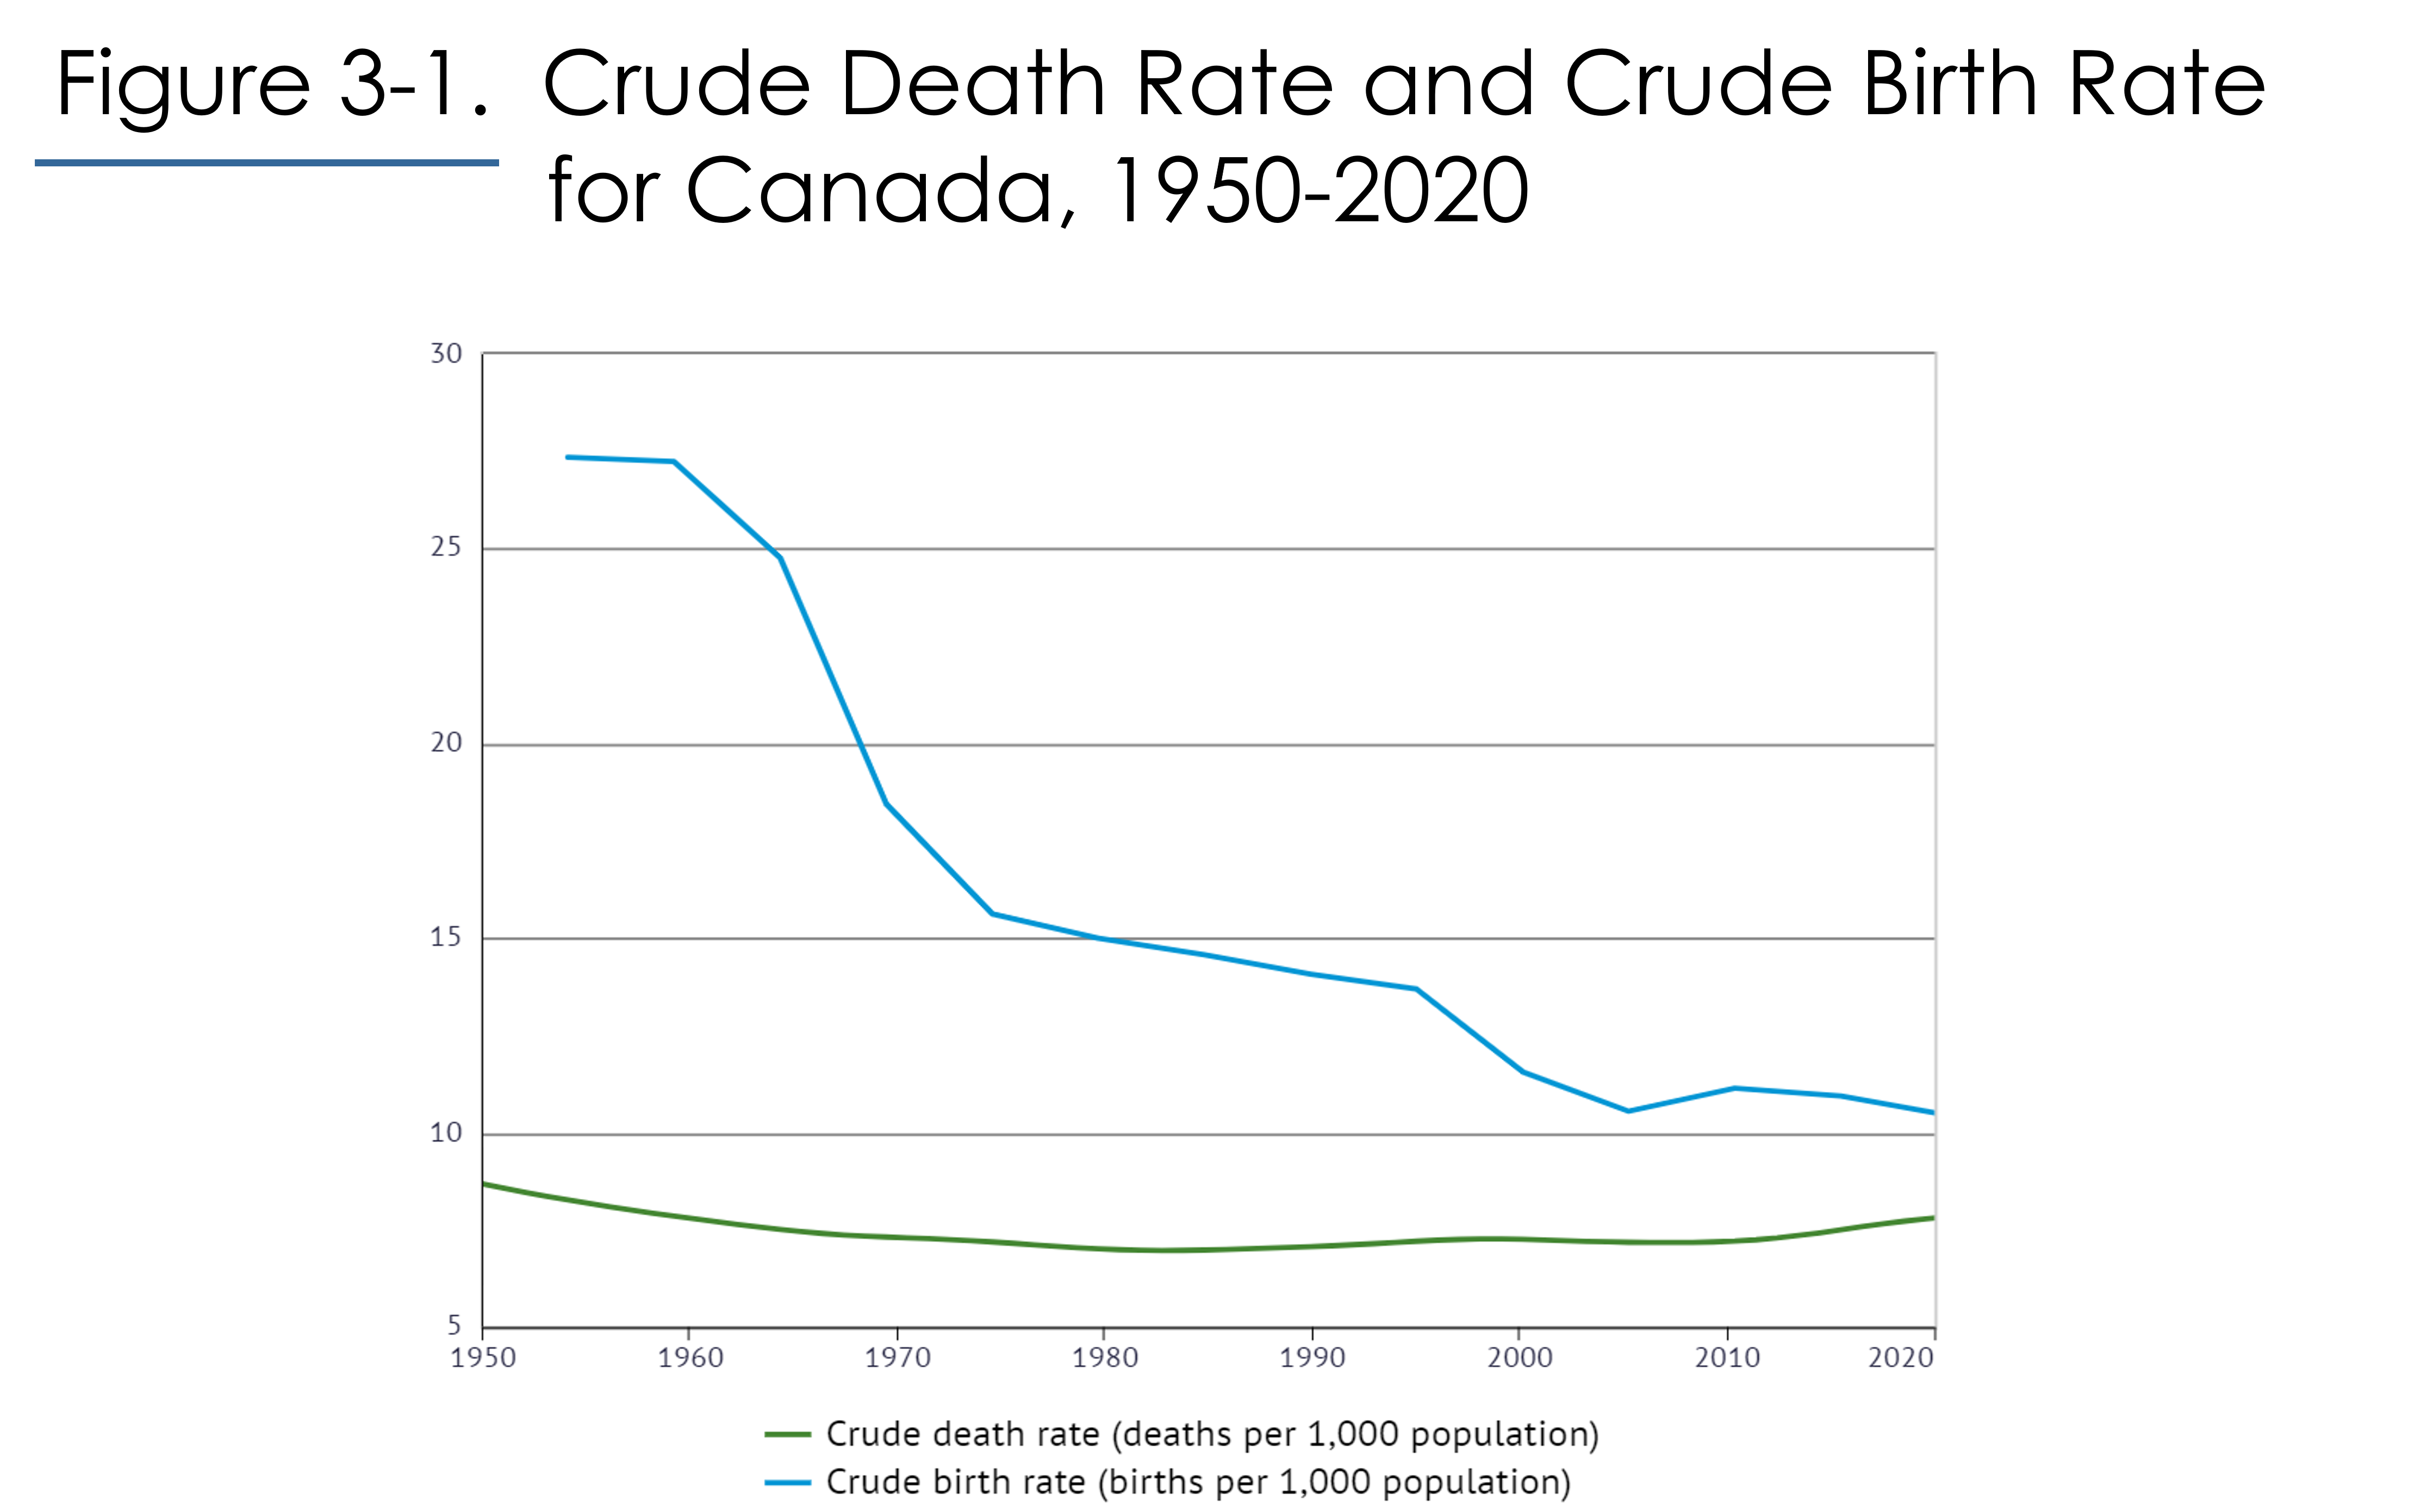
Similarly, the crude death rate depends on age-specific mortality rates and on the age structure of the population. So, looking at Figure 3-1 below, the death rate might be rising between 2000 and 2010 just because the population is getting older.

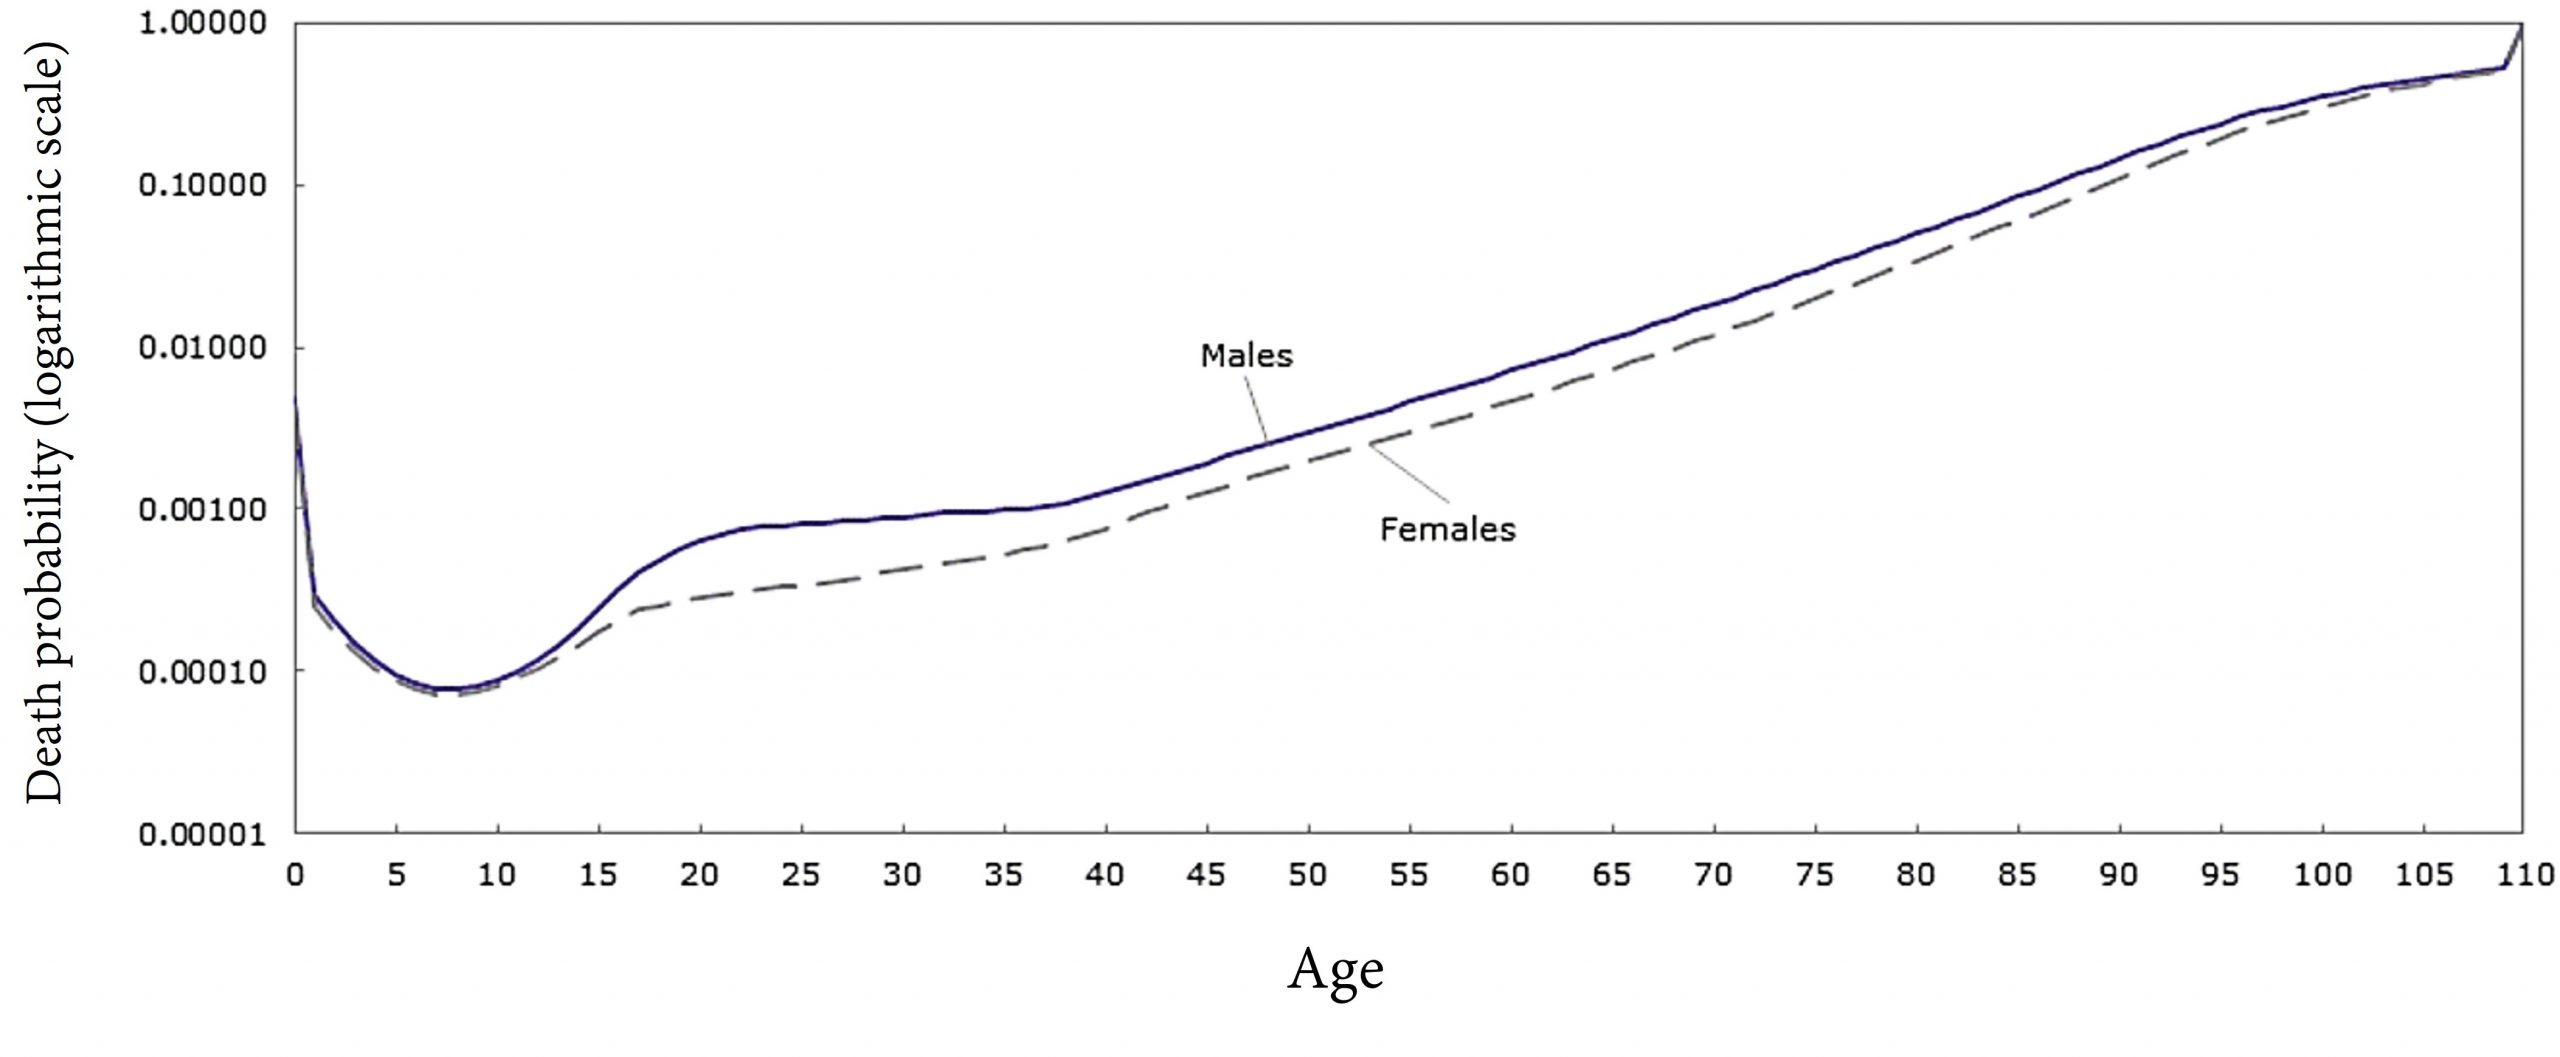
 Age-specific mortality rates are highest at birth and in one’s senior years. The Figure below shows probabilities of dying using a logarithmic scale to measure risk of death because the probabilities of dying when very young/old are so very much greater than the probabilities of dying at other ages. The Figure below also shows us that in Canada today, male mortality rates are typically higher than female rates.


The sex ratio is the ratio of males to females. Traditionally, male and female are the only two sex identities recorded. In our next chapter we will consider other sex identities. For now, consider “male”, “female”, “boy”, or “girl” etc. in terms of biological sex.
By nature, more boys than girls are born: the sex ratio at birth is typically 105 or 106 males to 100 females. The sex ratio appears to be naturally a bit higher in northern and Asian countries, and lower in southern climates. It is slightly negatively correlated with the age of the father, age of the mother, and birth order (whether the baby is the first, second, or higher order child).
The sex ratio changes with age. Because males typically have higher mortality rates than females, the sex ratio eventually falls below 100 males per 100 females.
The lower mortality of females has been attributed to several factors including
-a “spare” set of X chromosomes
-having less testosterone. Testosterone may impair immune function.
-a perception that girl children are more delicate leading to greater parental protection for girl children
-less risk-taking behaviour on the part of females
-lower participation of females in heavy manual labour, higher risk professions, and military combat
At the same time, girls and women are smaller and have less muscle mass; they also undergo unique stressors related to menstruation, pregnancy, childbirth, and breastfeeding.
Figure 3-3 shows future predicted and actual sex ratios for Canadians in 2021, with “0” on the horizontal axis meaning “ages 0-4”, “35” meaning “ages 35-39” and so on. Let’s start with the actual sex ratio, represented by the orange line. It shows that in 2021, the sex ratio increases with age for the children and teens residing in Canada in 2021. There is a big jump down between ages 20-24 and 25-29, and the sex ratio falls below 1 male per female for ages 30-34 and up. The sex ratio increases for 50 and 55 year olds, then declines again. A rapid decline occurs after age 75.
The blue line in Figure 3-3 shows what the sex ratio at any age 0,5,10,15 etc. will be if 105 boy babies are born for every 100 girls (the case in Canada in 2021) and if people go through life at the age and sex-specific mortality rates existing in 2021.

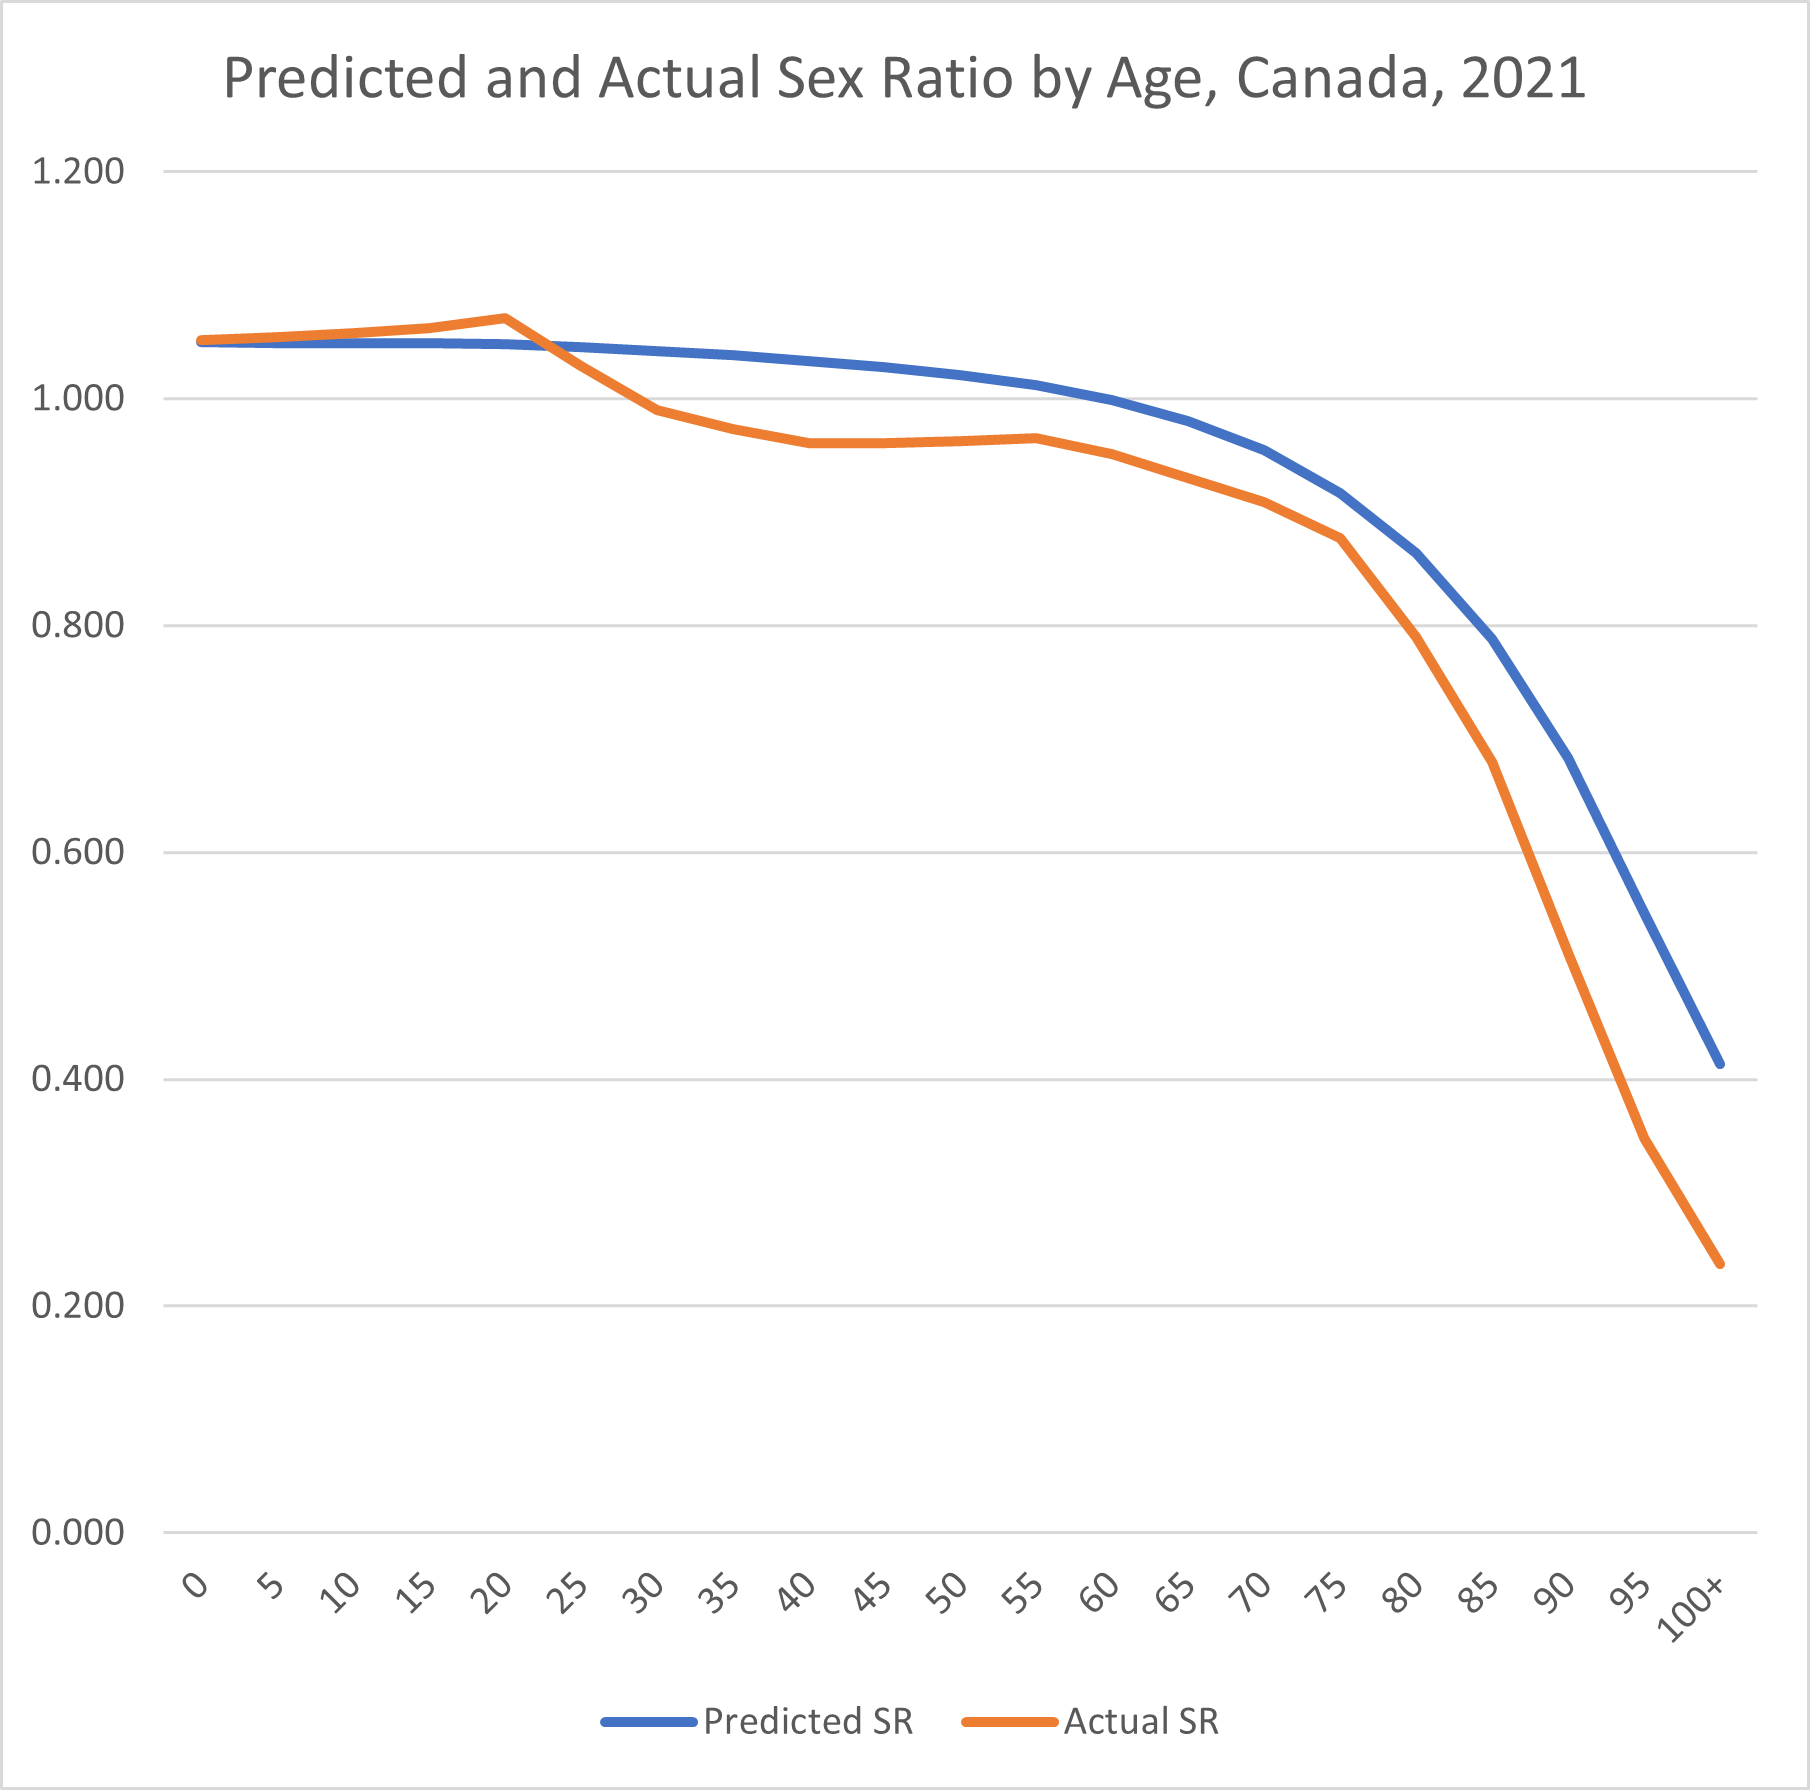
If the predicted line had been created using the mortality rates today’s men and women actually faced growing up, then the discrepancy between predicted and actual sex ratios would indicate missing men.
All we can say now is that, comparing these two lines, there were not as many men per woman in Canada in 2021 as we would expect from a sex ratio at birth of 1.05 and 2021 age-specific mortality rates.
The sex ratio can be a consequence of demographic and economic changes, such as changes in mortality rates or the arrival or immigrants and international students. The sex ratio in turn can affect demography and the economy. We’ll trace some of those impacts in this course.
The sex ratio differs significantly across countries. For example, in 2020 Latvia had a sex ratio of 85.5 men per 100 women, whereas Qatar had a sex ratio of 302. If we look at the sex ratio at birth, we see that Latvia (107) and Qatar (105) are not so far apart. The high sex ratio in Qatar is caused mostly by the number of male migrant workers. Migration has the potential to increase a community’s sex ratio overnight.
In our next chapter we’ll pause to consider the fact that not all people identify as male or female. How will this affect the collection of demographic statistics?

1. If the population at the beginning of the year is 100,000, and the population at the end of the year is 105,000, what is the population growth rate?
2. If the population at the beginning of the year is 105,000, and the population at the end of the year is 100,000, what is the population growth rate? The answer is NOT -5%.
3. If the population at the beginning of the year is 75,798, and the population at the end of the year is 80,352, what is the population growth rate?
4. If the population at the beginning of the year is 80,352, and the population at the end of the year is 75,798, what is the population growth rate?
5. The population of Canada on July 1, 2012 was 34,880,491. The population on June 30, 2013 was 35,284,483. What was
a) the increase in the population
b) the population growth rate
c) the midyear population
The number of births during this period was 383,822 and number of deaths during the period was 253,241.
d) what was the birth rate?
e) what was the death rate?
f) what was Natural Increase?
g) what was the rate of natural increase?
The number of immigrants during this period was 312,288.
h) what was the number of emigrants? (Use the fundamental equation of population change).
i) what was the net migration rate?
- Statistics Canada (October 8, 2019) ↵
fundamental equation of population growth:
population growth during the year = number of people who were born - number of people who died + number of people who immigrated - number of people who emigrated
Natural increase is the number of births during a period of time, typically a year, minus the number of deaths during that same period of time.
Net migration is the number of immigrants during a period of time minus the number of emigrants during that same period of time.
The crude birth rate is the birth rate as defined above under "birth rate", without any adjustments having been made.
The crude death rate is the death rate as defined below under "death rate", without any adjustments having been made.
The net migration rate is the number of immigrants (net of emigrants) during the year, divided by the midyear population, all multiplied by 1000. This number will be negative if there were more emigrants than immigrants.
The general fertility rate is the number of live births during the year, divided by the midyear population of women of child-bearing age, all multiplied by 1000.
The sex ratio has been defined only in binary terms and relies on official documents recording each person's sex. It is the number of males divided by the number of females. It is often expressed as the number of males for every 100 females.
