

Having studied the economic consequences of immigration, let’s consider the decisions Canada has made regarding who can immigrate, and how many.

The ability of a nation to control its borders depends on its financial resources, the level of corruption within government and law enforcement, the length and nature of its border, and the desperation of people to cross it. The Canadian government has it pretty easy with the Arctic to the north, oceans on each side, and the United States to the south. Canada is an attractive destination country for people from Central and South America and the Caribbean, but the United States is even more attractive, and it lies between. The US actively monitors the border crossing between itself and Canada. Americans themselves are not very interested in moving to Canada.
The Canada-United States Safe Third Country Agreement (2004), which states that people cannot seek refuge in Canada if they have been in the United States, has been used by Canada to dismiss requests for asylum from many refugees passing into Canada from the United States. The Agreement is predicated on the United States giving refugees safe treatment and a fair hearing.
Many people enter Canada first, then attempt to enter the United States. For example, in March 2023 a family of four from India on a tourist visa, together with a family of four from Romania who had been living in Canada, were found drowned in the St. Lawrence River in the vicinity of the Mohawk Nation of Akwesasne. A local man, presumed to have been transporting them to the United States illegally, was missing.

The Pew Research Center has estimated that there were about 10.5 million unauthorized immigrants in the United States in 2021, representing just over three percent of the American population[1]. For Canada, the high estimate in 2023 was 600,000 unauthorized workers, about 1.5 percent of the population, as reported by The Globe and Mail (December 14, 2023).
In 2008, migrants entering the US illegally made up 25% of farm workers, 19% of cleaners, and 17% of construction workers in the United States(Hanson, 2009). Many politicians would like to extend privileges to those migrants, to help with health care and education needs, but that would encourage more illegal immigration and be unpopular with voters.
The USA also offers H1B, H2A, H2B, and H4 visas for workers and their families to temporarily enter the country for up to three years at the request of an employer. Over 980,000 such visas were issued in 2022[2].
In a 2007 paper, Gordon Hanson suggested that migrants entering illegally [or legally but temporarily] to work in low-skilled jobs may be meeting a need: between 1960 and the date of his study, the share of native-born workers with less than a high-school diploma fell from 50% to 12%. A counterargument is that, if less-skilled labor is scarce, wages for less-skilled work should rise, attracting more native-born Americans to those jobs. The rebuttal is that there is a stigma to those jobs. The counter-rebuttal is that high-paying jobs may lose their stigma.
Hanson argued that migrants entering illegally are more likely than legal immigrants to be financially beneficial to American citizens. His arguments also apply to temporary workers entering legally:
- they improve the dependency ratio. Most are of working age and do not bring their families
- a significant portion of these migrants come and go according to the demand for their services
- their wages tend to be low, so their share of what they produce is not high
- they are ineligible for many public programs
- they end up paying some taxes such as payroll, sales, and property taxes
Hanson estimated that, in 2002, the net gain to native-born Americans from illegal immigration in terms of GDP, the bright blue triangle from the previous chapter, was about 0.03 percent of GDP. That was offset by net transfer of tax revenue to migrants of 0.10 percent of GDP. (Migrants were using more government services than they paid for.) So, illegal migration overall cost 0.07 percent of GDP to native-born Americans. This was less than proposed measures to keep migrants out, which were about 0.10% of GDP. Hanson did not estimate the efficiency benefits of immigrants or the costs that might occur if the border were not patrolled and many more migrants entered.

By calculating the triangle of lost surplus, Hanson is assuming that it doesn’t matter if employers gain at the expense of native-born workers. In Economics we only accept this if the “winners” (employers) compensate the “losers” (native-born workers). The Pareto criterion says that, for an economic outcome to be preferred, someone must be made better off and no one can be made worse off.
Though the pareto criterion is not being satisfied, and native-born workers feel the brunt of migrants entering illegally migrants, the United States as a whole appears willing to tolerate illegal migration to some degree to keep the wages in construction and agriculture competitive.
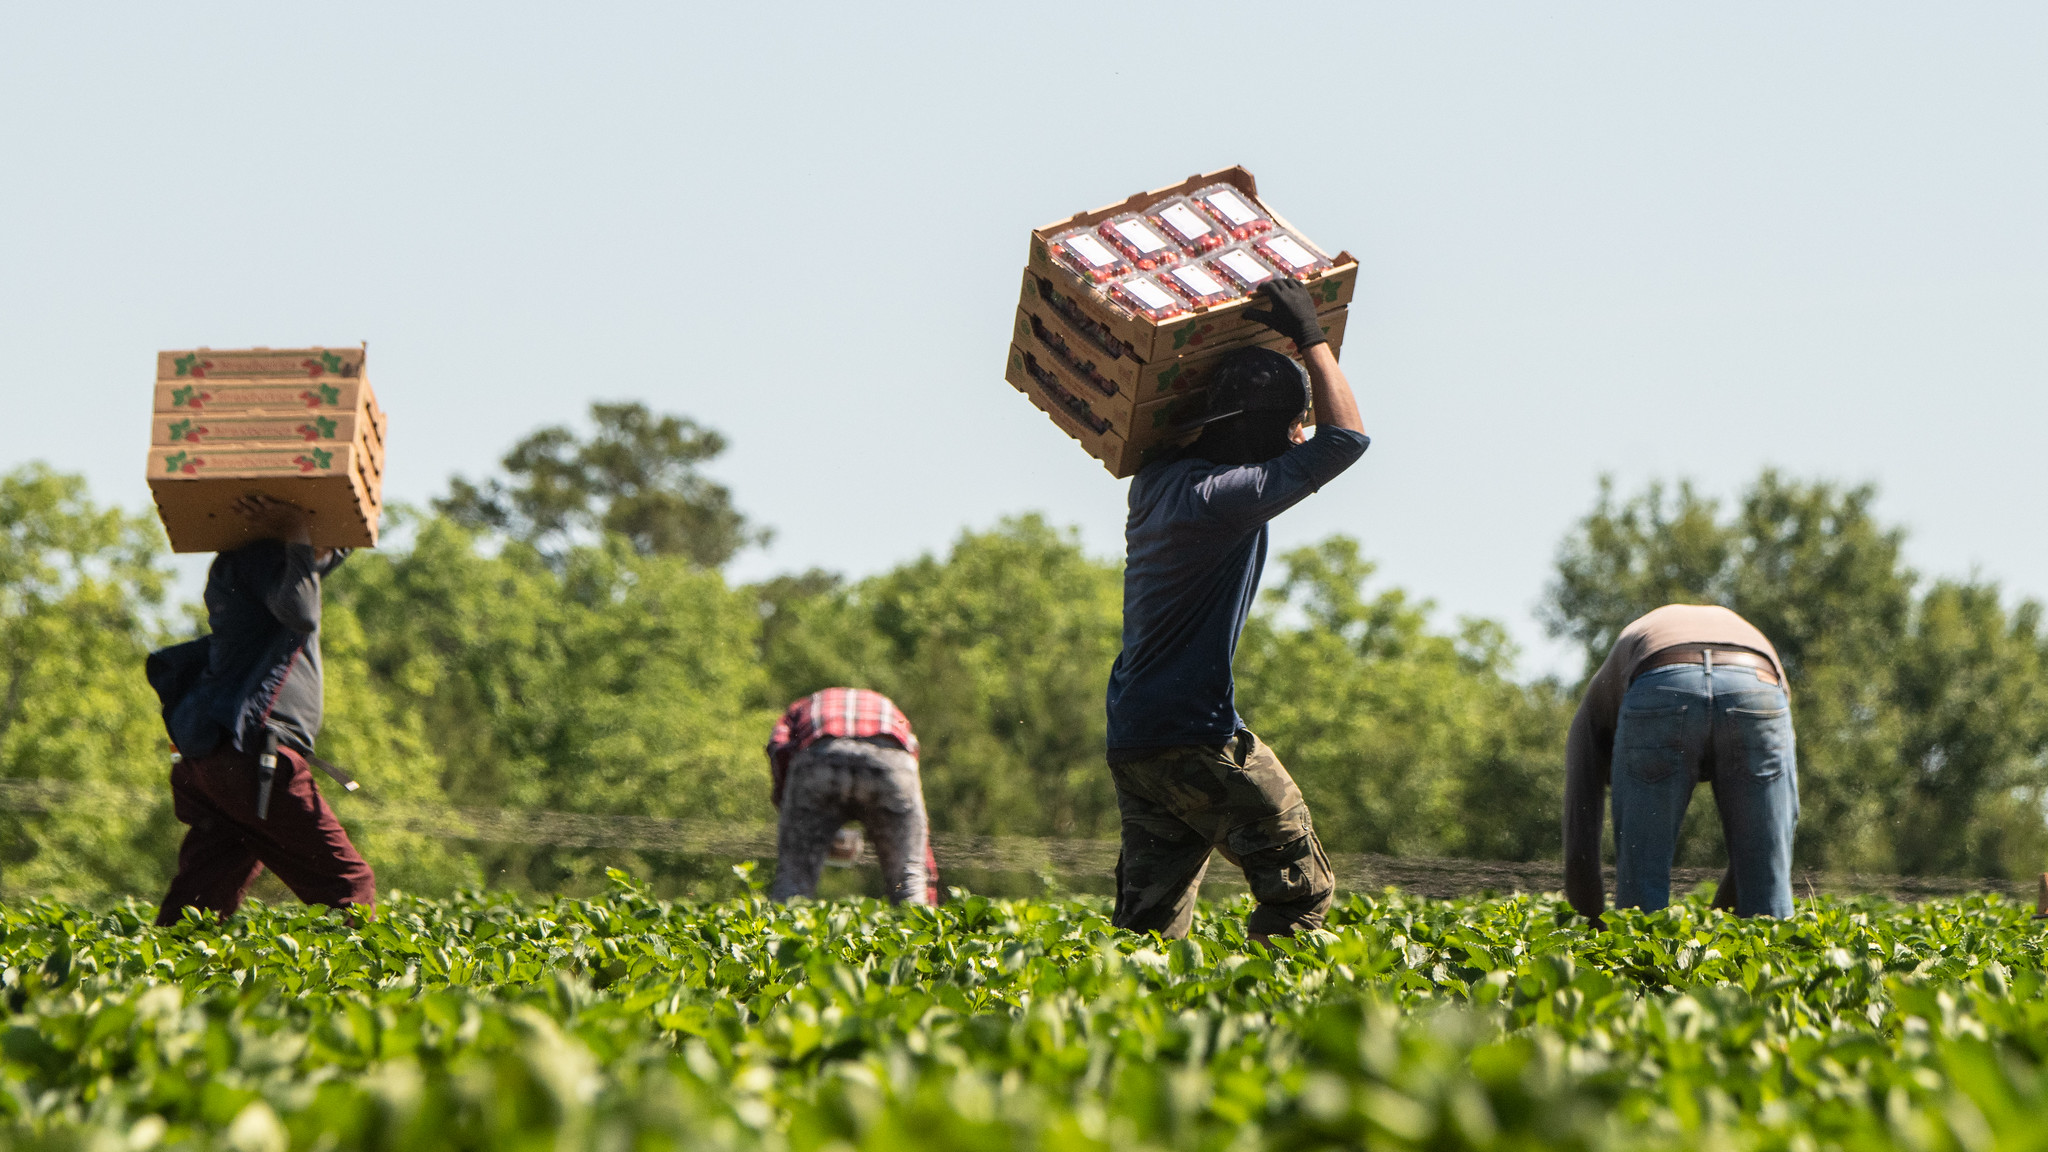
It’s not just the American economy that benefits from the labour of “second-class citizens”; Canada does too.

Most non-citizens living in Canada Have come to Canada legally using the Temporary Foreign Worker Program. This program allows employers to bring temporary foreign workers (TFWs) to Canada for up to four years. The employer must first advertise the job vacancy for a set period of time. The TFWs are to be paid at least the minimum wage, or the union wage if applicable. They must be paid at least 85% of what Canadians are paid for the same work.
TFWs cannot bring children to Canada. They can’t apply for social assistance or collect pensions. They do receive health care, and they may apply for permanent residency after their contracted work period ends.
In 2019, 6% of professional, scientific, and technical service workers, and 5% of information and cultural sector workers in Canada were TFWs.[3]Most TFWs, however, worked in less prestigious occupations.
According to a study by Yuqian Lu (2020), in 2017 TFWs represented about 3% of Canada’s workforce. They made up over one quarter of all crop production workers, and about 10% of nannies and caregivers working in private households. They also accounted for about 7% of workers in the accommodation and food services sector. Until 2012 there had even been an “exotic dancer” category, but we now realize how easily exotic dancing can tie in to human trafficking.
Because they are tied to one employer, who can cancel their work arrangement if displeased, lower-earning, less well-connected TFWs may be coerced into accepting abusive working conditions. Sometimes employers take advantage of the TFWs’ ignorance of Canadian law and their limited knowledge of English. For example, some employers have taken away a TFW’s passport. Some TFWs may be forced to give up most or all their wages for excessively-priced room and board. Employers are supposed to pay for the workers’ transportation to Canada, but some rely on recruiters who exploit the TFWs by demanding a share of their wages. In our next chapter we will learn more about slavery and the exploitation of labour.
Foreign students are not temporary foreign workers, but they are temporary residents who could be said to be exploited. Some are channeled into mass preparatory courses offered by private companies. Foreign students in colleges and universities were paying six times the domestic tuition rate in 2022/2023.[4] Many may be coming only for a chance at permanent residency in Canada. Incidentally, about half of foreign students earned taxable earnings in 2019. [5]
According to breaking news in the fall of 2023, there were 2.2 million temporary residents living in Canada including 807,26 foreign students,[6]. This amounted to a million more temporary residents than the federal government had been reporting. The government does not record who is leaving the country[7], and it was assuming that temporary residents left within 30 days of their visas or permits expiring. In reality, many of the foreign students and TFWs were overstaying their visas while they applied to stay longer or become permanent residents.
According to Statistics Canada (June 22, 2022), about 25% of TFWs and about 33% of foreign students do end up becoming Canadian citizens: in fact, these temporary programs are serving as the first step in a two-step immigration process that is yielding better labour market outcomes for new Canadians.


Canada will always have a high land:labour ratio compared to other countries; that is one reason why, since colonization, the settler government has invited newcomers to work the land. Today the capital:labour ratio is more relevant to international trade than the land:labour ratio. Although Canada has a lower capital:labour ratio than the United States, we are still rich in human, natural, environmental, physical, and social capital compared to many countries. Labour is relatively expensive in Canada, and that is a major reason why Canada continues to encourage temporary foreign workers, other temporary visitors such as students, and permanent residents to come to Canada. Canada’s net migration rate, 5.2 per 1000 in 2020[8], is similar to Australia’s and higher than most western nations including the USA (2020 net migration rate of 2.0 per 1000).
Doug Saunders, author of Maximum Canada: why 35 million Canadians is not enough (2017), has been a leading spokesperson in favour of immigration. In his book and his many newspaper columns, he has argued that Canada needs a much larger population to capture the scale economies and other advantages we described in Chapter 19. He also makes the case for urbanization and densification, noting the environmental benefits.
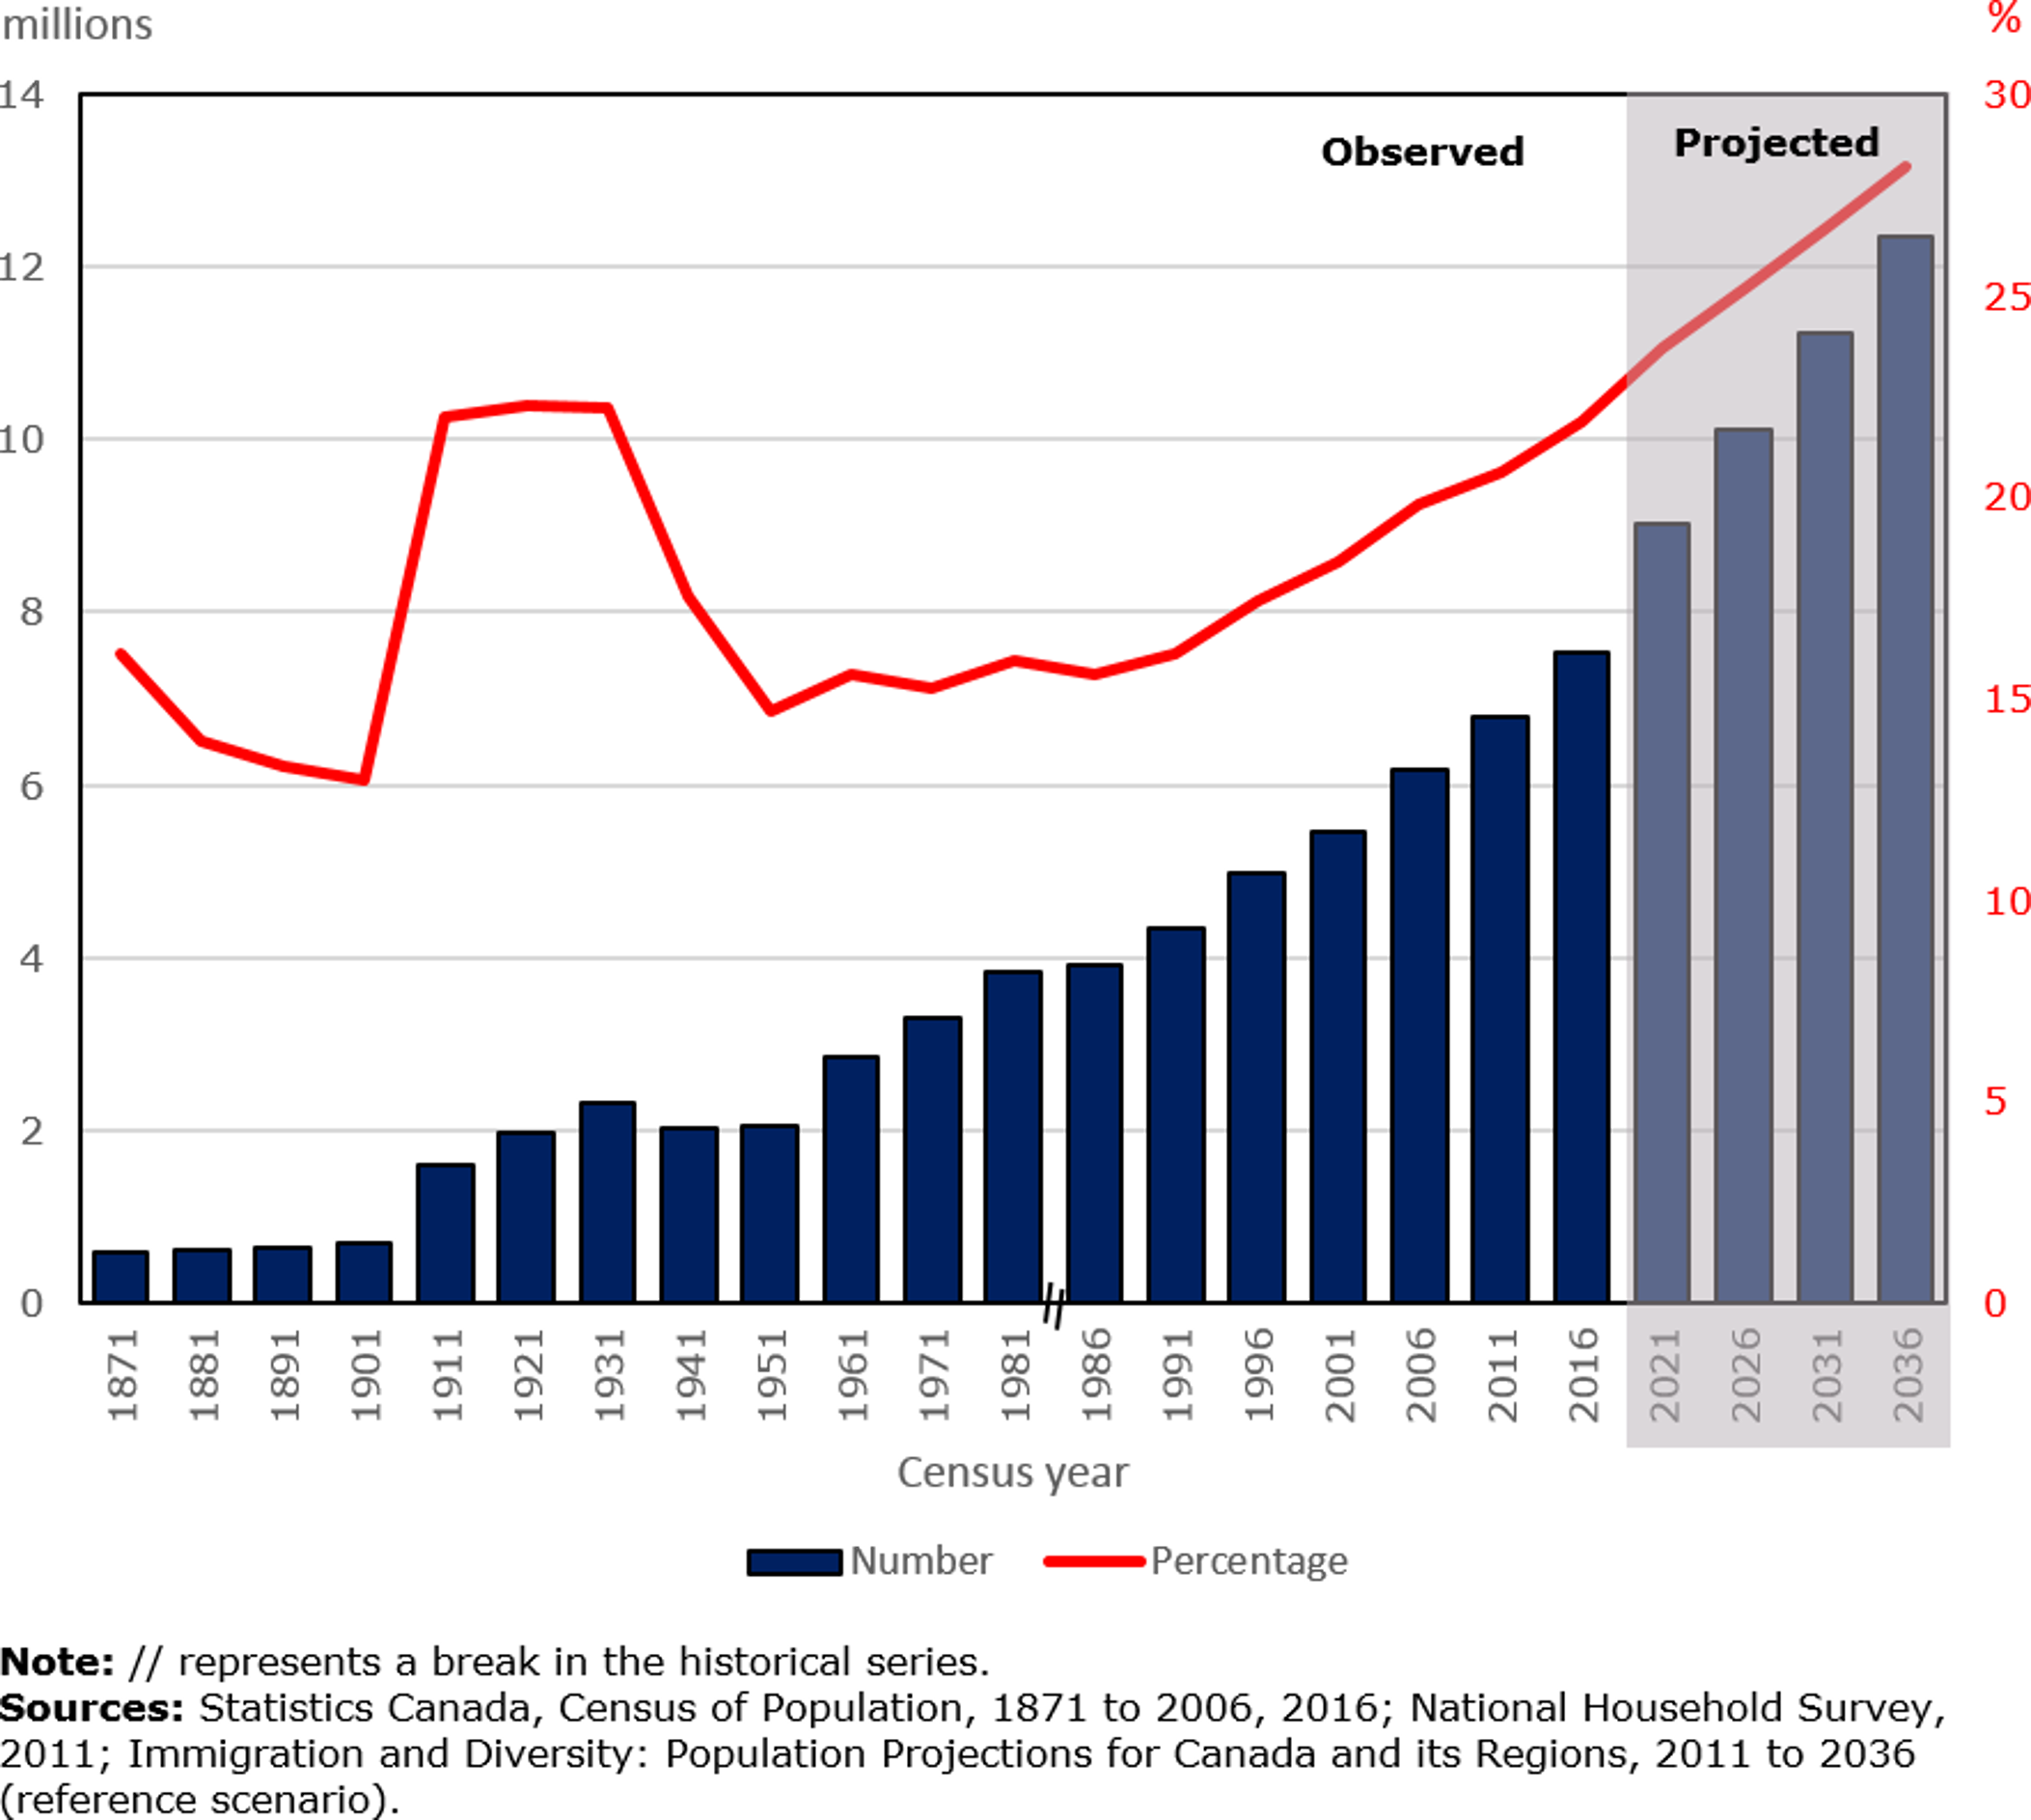
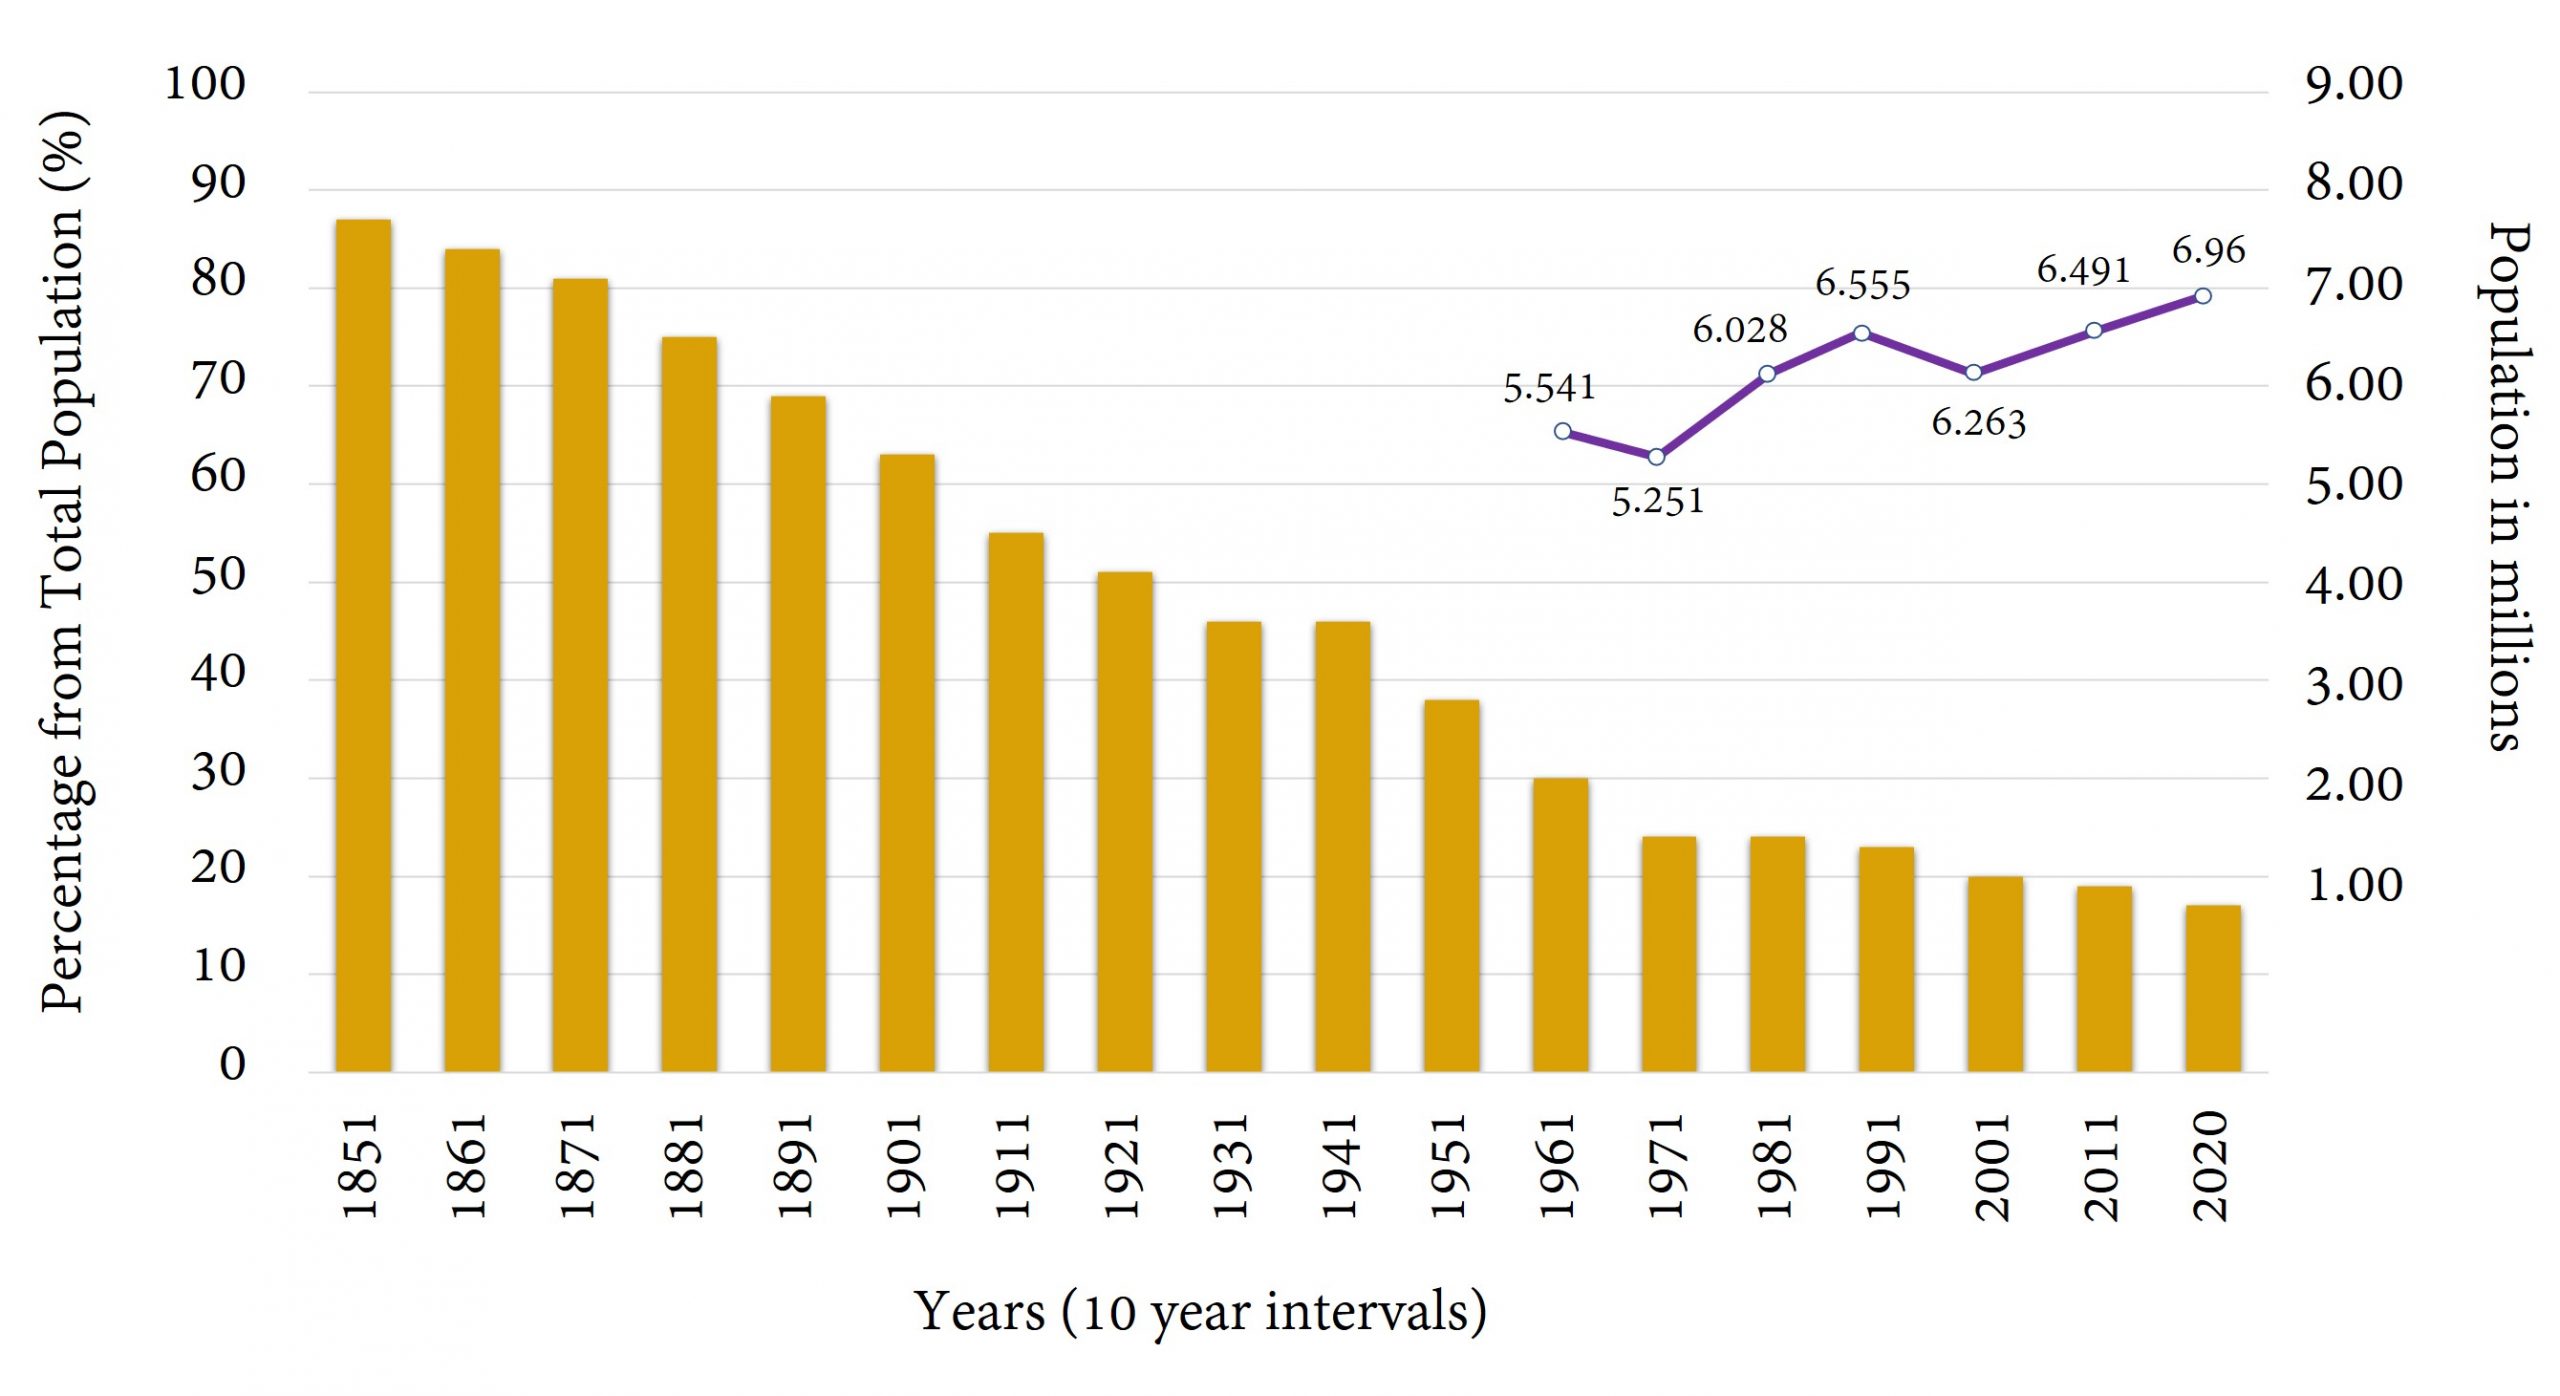
Figure 21-1 shows the number of immigrants living in Canada, people who came to Canada from various places in various years. The fraction of the population which represents immigrants has been trending up since 1951 and has now surpassed the high of 1911-1931. Figure 21-1’s projection for 2021 has been exceeded: in 2021, 23% of Canadian residents were foreign-born.

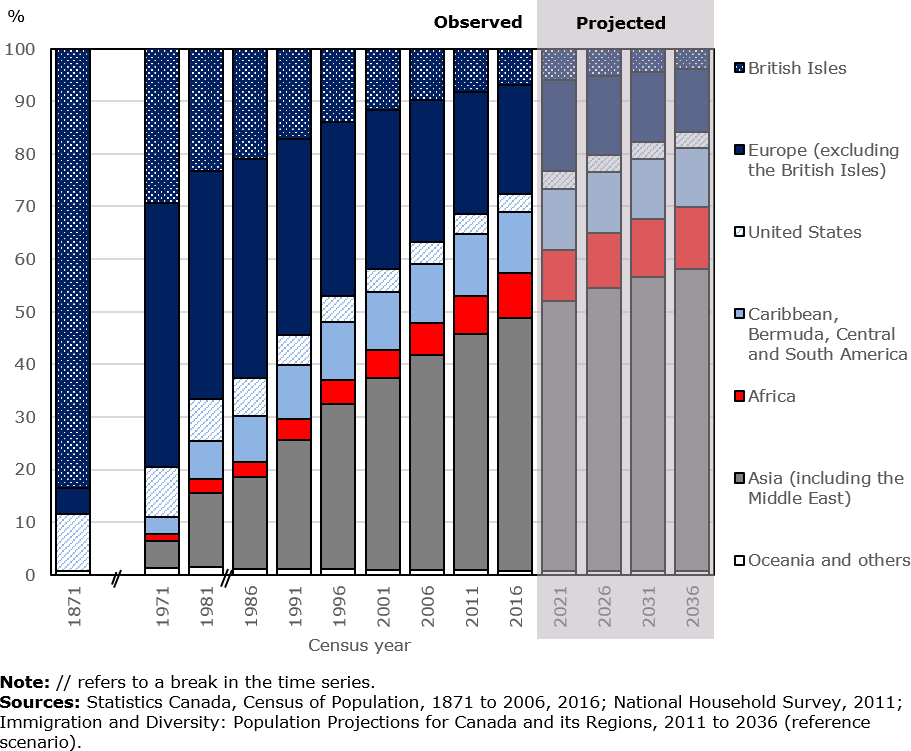
Immigration today is inclusive of many different ethnicities. Figure 21-2 shows that, shortly after Confederation, Canada’s foreign-born population was largely British-born, with some Americans and some continental Europeans. That changed decisively in the late 1960s. Today, most Canadians who were not born in Canada were born in Asia or the Middle East. In 2016, the country contributing the most immigrants to Canada was the Philippines, at 15.6% of recent immigrants.

In the late nineteenth century, visible minorities were not welcome, just tolerated if needed to perform work others would not do. For example, Chinese men were permitted to enter
Canada to work on railway construction, but had to pay a $500 head tax from 1885 to 1923, after which time only special categories of Chinese people, such as business people and students, were allowed to immigrate. During the Great Depression, Canada passed a law such that only Americans, Britons, and agriculturalists with money could immigrate.(Canadian Council for Refugees, 2000). Clearly, the racism so prevalent at the time shaped this policy.
After World War II, immigration rules were relaxed. In 1967, discrimination on the basis of race was forbidden. For more detail, see the Canadian Council for Refugees (2000) excellent summary article, “A hundred years of immigration to Canada 1900-1999.”

Canada today admits roughly three categories of immigrants on a permanent basis: economic immigrants, family members of Canadians, and refugees.
The 2019 target was about 331,000 immigrants, of which 58% were economic immigrants, 27% were extended family members, and 15% were refugees, protected persons and other humanitarian categories.
The COVID 19 pandemic in 2020 and 2021 disrupted immigration flow for fear of spreading the virus. To make up for lost immigration during the pandemic, in 2021 the government of Canada created the “Temporary Resident to Permanent Resident Pathway” to make citizens out of non-citizens already living in Canada. International students graduating in Canada could apply for one of 40,000 spots; foreigners working in Canada’s health care sector could apply for one of 20,000 spots; and other foreign workers could apply for one of the remaining 30,000 spots. This sums to potentially 90,000 new Canadians plus their spouses and children.
In 2023 the government was on track to admit 485,000 immigrants in 2024 and 500,000 in 2025, but was facing a public increasingly concerned about the lack of affordable housing and family doctors in most Canadian cities.
Economic Immigrants
There are a variety of tracks for economic immigrants. Applicants are usually given points for English and French proficiency, education, work experience, Canadian work experience, age, “adaptability”, and pre-arranged employment in Canada. They are admitted or not on the basis of their score.
There are no longer any investor and entrepreneur pathways to immigration, at least officially. In 2011 there were three categories of business immigrants: investors who made an $800,000 interest-free loan to Citizenship and Immigration Canada, to be repaid after five years; entrepreneurs, who had business experience and $300,000 to back it up; and self-employed people with experience in culture, recreation, or agriculture.
In contrast to Gordon Hanson’s recommendations, Canada has made it more difficult for lower skilled people to immigrate to Canada. Concerned about rising poverty rates for immigrants in the 1980s and 1990s, Canada selected higher educated and higher skilled immigrants beginning in 1993. Unfortunately, this made things worse.[9] Whereas in 1992, immigrants in Canada ten years or less had been twice as likely to have low income than native-born Canadians, in 2004 they were about 2.5 times more likely to have low income. In fact, by 2000 the skilled worker class of immigrant was more likely to experience low income and chronic low income than was the family class of immigrant! University-educated immigrants were earning no more than the high school-educated. Clearly, skilled workers were have difficulty translating their skills into employment.
University degrees earned in Asian universities are discounted by Canadian employers and professional associations. Economic immigrants also often lack the social support that immigrants in the family class enjoy.
Others have suggested that the way the ethnicity of immigrants has changed -fewer European and more Asian – accounts for some of the difficulty finding employment. Language acquisition or social adaptation may be more difficult. Racism may also be a factor.
In 2021, the poverty rate among all immigrants was 9.1% compared to 6.1% for native-born Canadians of the same age, but as high as 16.1% among immigrants in Canada five years or less.[10]. The poverty rate among immigrants in Canada ten years or less was not reported, suggesting that there has not been much improvement since the 1990s.
To sum up, immigrants to Canada have significantly higher poverty rates than native-born Canadians.
The picture is rosier for child immigrants. A 2022 study found that Canadians aged 20 or 25 years old in 2019 who had immigrated to Canada before the age of fifteen were more likely to be pursuing postsecondary education than other Canadians their age.[11]. Canadians who had immigrated as children and were thirty years of age in 2019 had median wages 29% higher than average than the average thirty-year-old Canadian, if their parents had come as economic class immigrants. This reflects, in part, the socioeconomic background of their parents; however, even thirty-year-olds who had come with their parents to Canada as refugees were making slightly more than the average thirty-year-old Canadian. If a thirty-year-old had come to Canada with their parents as family class immigrants, they were earning slightly less. Overall, Canadians who were once immigrant children earned higher median wages.[Ibid.]
To sum up, 2019 data showed that child immigrants had fared better educationally than the average Canadian. If they came as economic immigrants or refugees, they were also earning more.

The native-born children of immigrants have typically fared better economically than the children of Canadian-born parents. 2001 Census data indicate that children born 25 to 37 years previously in Canada to immigrant parents, were on average more highly educated and earning more income than other 25-37 year-olds.[12]
2016 Census data agree that most Canadian-born children of immigrants, both men and women, achieve significantly more higher education than their parents and the average Canadian their age, even after adjusting for province, location, age, and language spoken at home (Hou and Chen (Feb. 2019)).
To sum up, 2001 and 2016 data showed that Canadian-born children of immigrants had done better educationally than the average Canadian.
However, the same study shows that some Canadian-born children of immigrants are not taking great educational strides, and many are not able to translate their education into higher earnings. How the income of the children of immigrants compares to the Canadian average depends on the racial and cultural background of their parents who immigrated. As a whole, second-generation men earn more than men whose parents were not immigrants, but that’s partly because they are more likely to live in cities, for example. Once you adjust for province, location, age, language spoken at home, education completed, school attendance, and marital status, they earn less. Second-generation women earn the same superficially but once you make the adjustments, they are earning less. As Canadian immigration becomes more diverse, it becomes more complicated to predict the educational and income attainment of immigrants and their children.
To sum up, 2016 data shows that Canadian-born children of immigrants from many, but not all, cultural backgrounds were earning less than the average Canadian.
Having studied international immigration in detail, let’s now consider the flow of people within Canada.

Canadian citizens may live anywhere in Canada they wish; the only restriction may be found in Indigenous-governed communities, where family or ancestral ties to the community may be required.
For many years, the most-discussed feature of Canadian internal migration has been the flow of people from the East, especially the Maritime provinces, to Alberta, where work in the oil fields has been plentiful. Figure 21-3 below shows that in 2018/9, the flow to Ontario was even larger, at 70,000 people. Generally, the higher expected real wage in Ontario and other prosperous provinces has motivated in-migration.
While the Figure makes the flows look massive, the total number of Canadians (not all of whom were workers) moving to Ontario that year was only about one-tenth of one percent the number of people employed in Ontario that year.
In Figure 21-3, each place of origin has its own colour. For example, Quebec is blue. We see that many people moved from Quebec to Ontario in 2018/2019, likely because of economic opportunity. People from Ontario (orange), Alberta (medium green) and British Columbia (dark green) arrived in Quebec, as shown by the corresponding arrows arriving at Quebec’s blue arc. Some inflows are small and not shown, hence the empty space at the arc. There was about equal inflow and outflow for Quebec, the second-largest provincial economy in Canada.

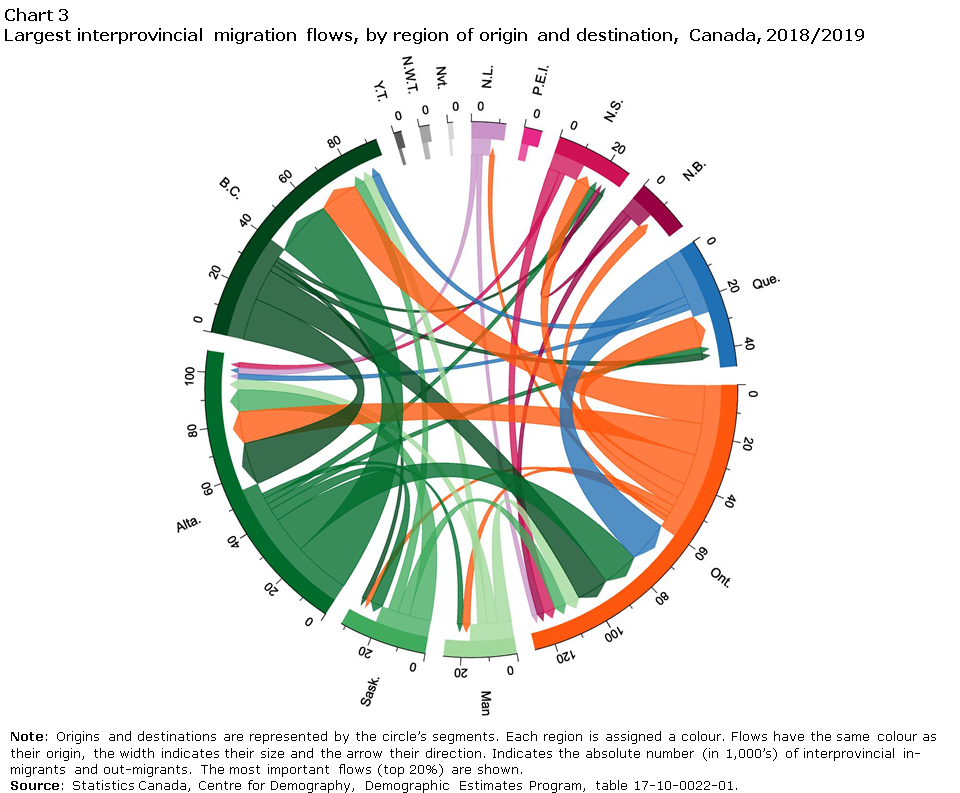
Figure 21-3 shows the most migration occurring between the three largest anglophone economies. About as many people left as entered each one in 2018/9, suggestive of a mobile group of people optimizing their employment prospects in particular occupations and competencies.

Urbanization is happening all around the world. In 1900, about 10% of the world’s population lived in cities, compared to 46% in 2014. The UN expects the urban population share to be 66% by 2050.
Canada has followed the same trend, as shown in Figure 21-4.

According to Moazzami (2014), Ontario’s urban population grew 15% between 2001 and 2011, but its rural population shrank at least 7%, for an overall population increase in Ontario of almost 13%. In 2011, 97% of Ontario’s immigrants headed to the city, where the average earnings were 51% higher than elsewhere.
Economic opportunity remains the strongest motive for people to voluntarily migrate. In our next chapter, we’ll look at the economic push and pull factors behind involuntary migration.


1. Which are likely to have a greater net positive effect on GDP per worker: legal immigrants or migrants entering illegally, and why?
2. How did Canada’s immigration policy change in the 1990s? Using one of our policy pointers from chapter 10, explain why this policy failed to alleviate poverty among immigrants.
3. A city wishes to grow via migration. How might it do so?
- Passel and Krogstad (2023) ↵
- Klobucista and Roy (2023) ↵
- Statistics Canada (June 22, 2022) ↵
- Statistics Canada (Sept 7, 2022) ↵
- Statistics Canada, June 22, 2022) ↵
- "Time to address the immigration number that matters now", Globe and Mail, November 2, 2023. ↵
- "Ottawa to refine way it counts non-permanent residents," Globe and Mail, September 15, 2023. ↵
- undata.org ↵
- Picot et al. (2007) ↵
- Statistics Canada, November 9, 2022 ↵
- Statistics Canada (February 2022) ↵
- M. Corak (2008) ↵
The Pareto criterion is one of the norms of Economics, though it is often ignored. It says that one situation cannot be preferred to another if someone will be made worse off. For a situation to be preferable, someone must be made better off and no one can be made worse off. Thus, for a new situation to be preferred to an existing situation, there must be enough gain available to compensate those who are hurt by the change, and the compensation must take place.
