

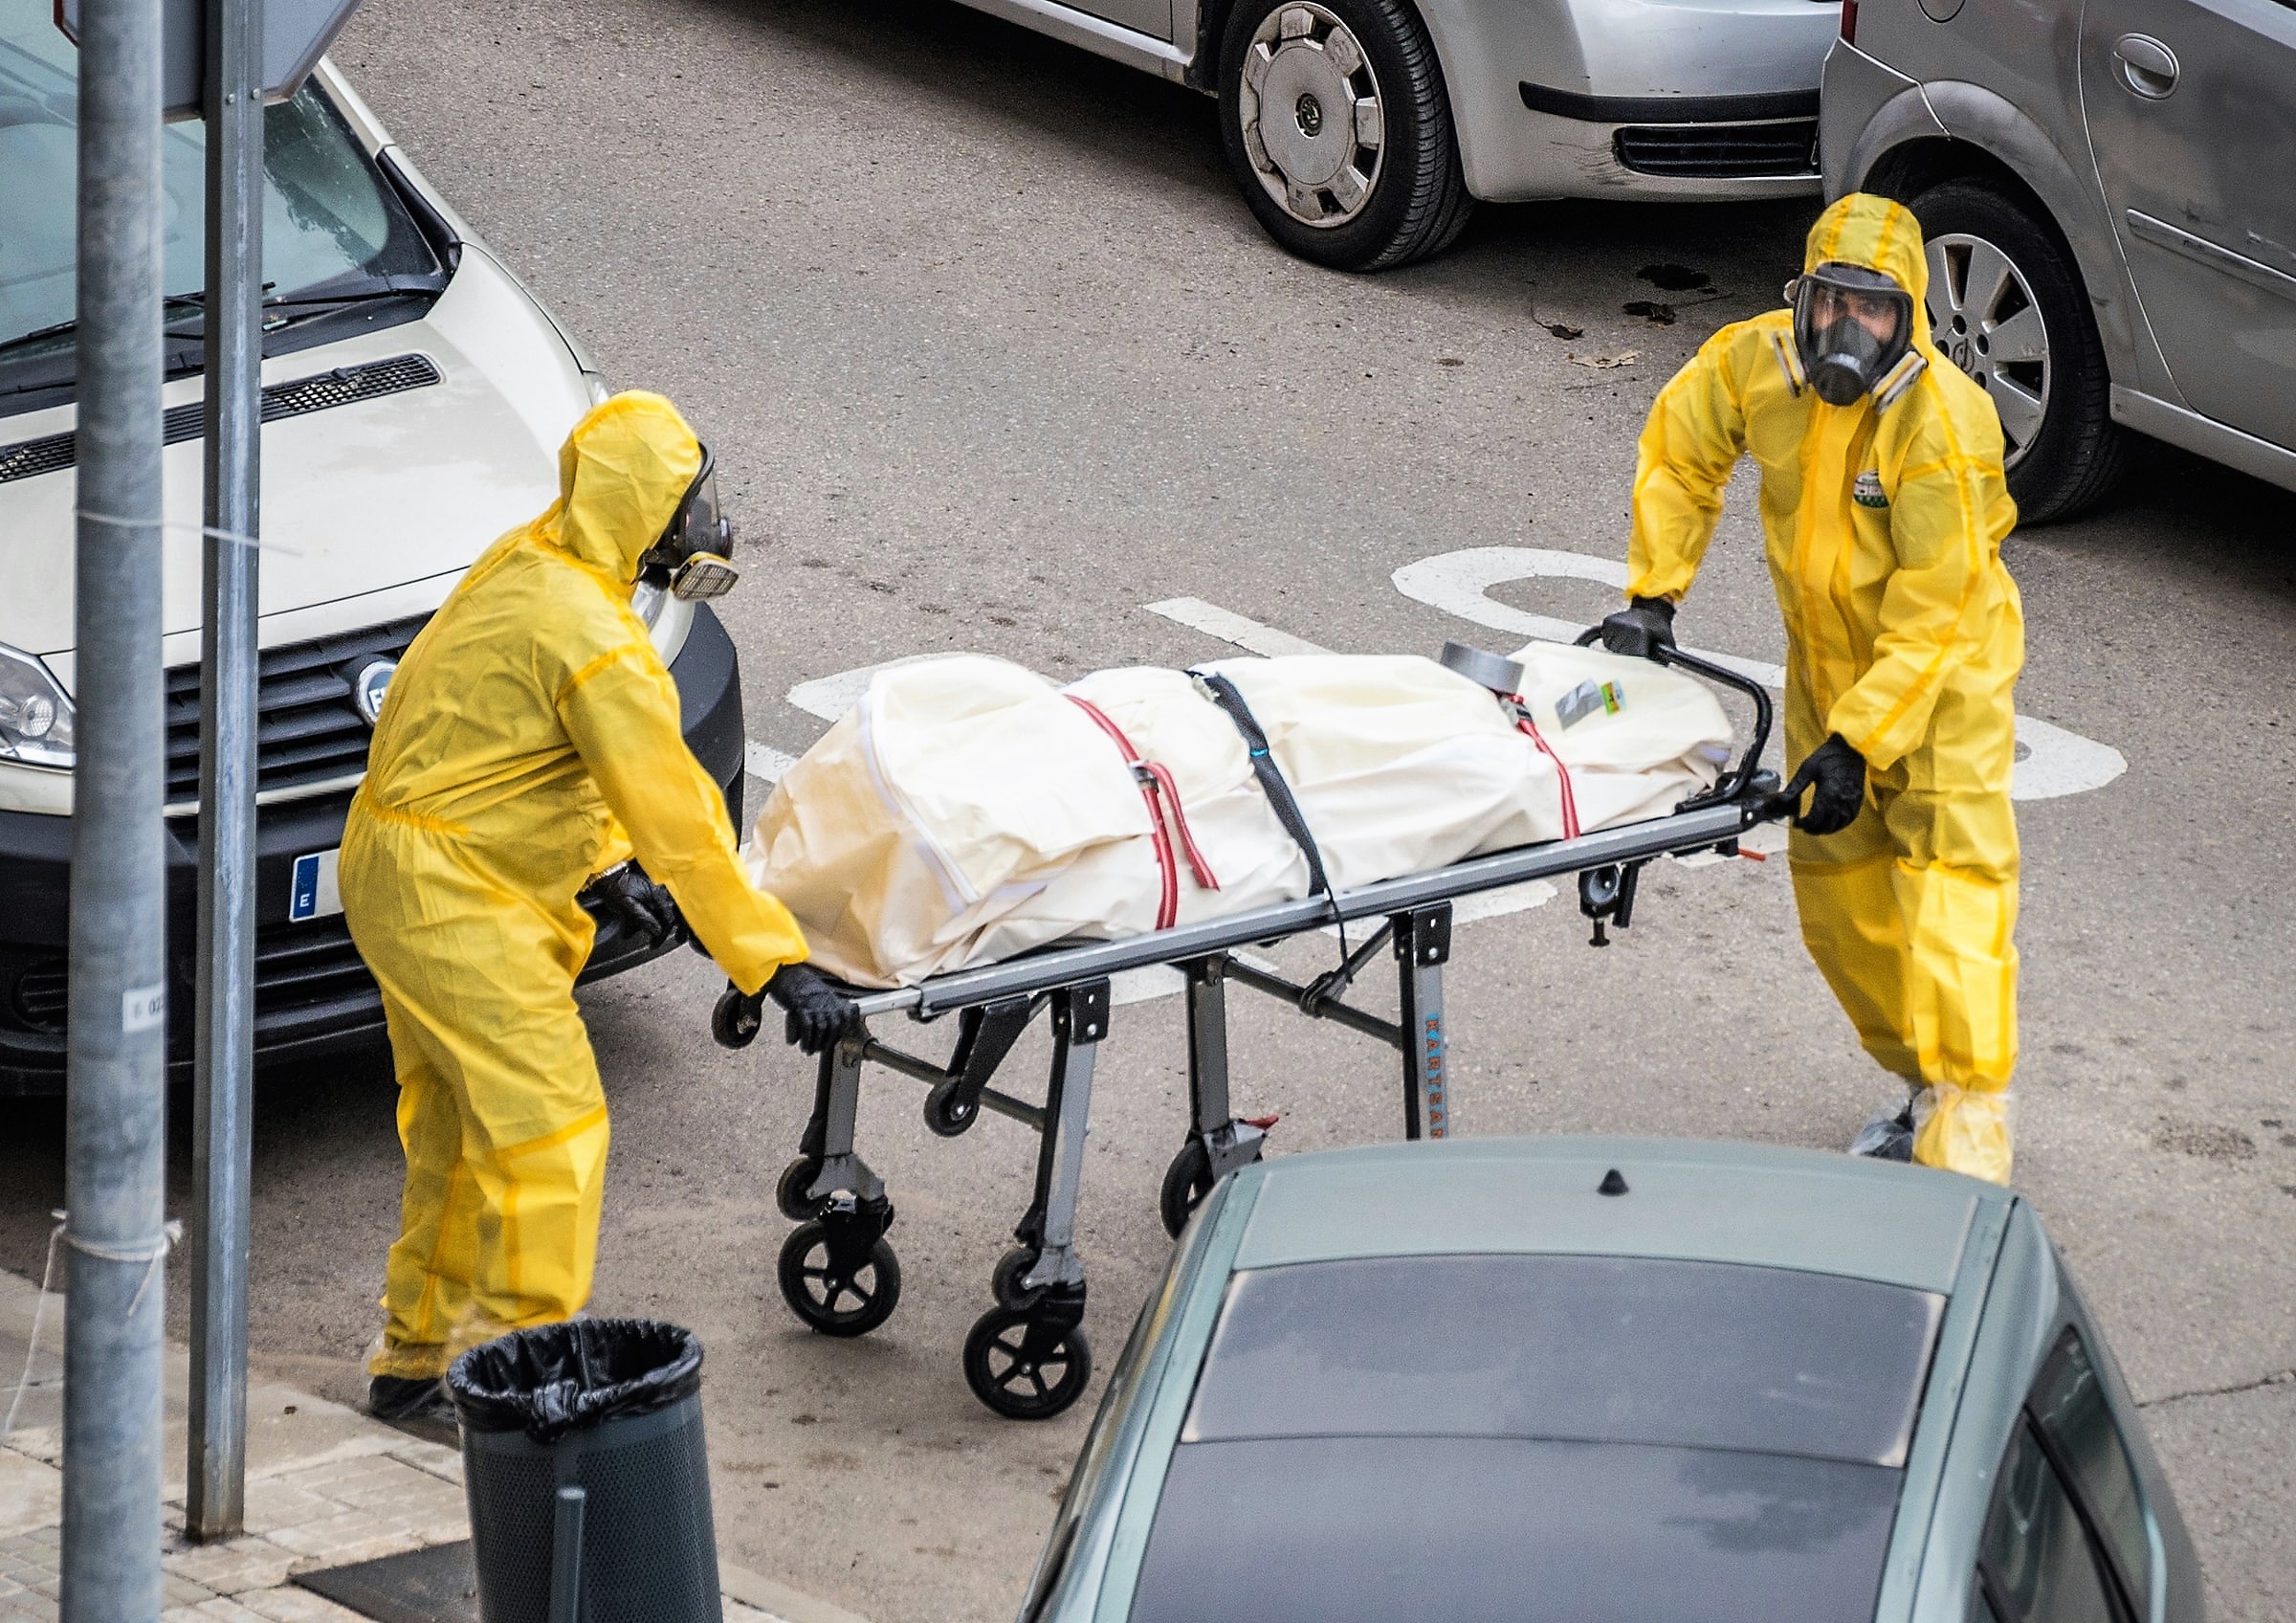
The COVID-19 pandemic which began in 2020 was a crisis. The virus was new to us; we did not know exactly how it spread, how easily it spread, or how sick it could make us. This crisis caused deaths directly and indirectly. There were deaths from COVID infections, and there were deaths from other conditions in people weakened by COVID-19. There were deaths because of delays in medical treatment or fear of going to hospital. There were deaths from substance abuse and suicide related to the isolation of lockdowns, economic hardship, and uncertainty caused by the pandemic. There have been and will be deaths due to the long-term effects of having been infected.

Crisis deaths are deaths which are caused by exceptional situations -epidemics or pandemics, natural disasters, war, and severe economic downturns. By contrast, chronic deaths are deaths we expect due to the prevailing standard of living – the prevailing level of income, nutrition, medical care, sanitation, and safety – and due to the endemic diseases that exist in the population.
Usually, the presence of a crisis and the resulting crisis deaths means that the population will have more deaths than it would have otherwise. There will be excess deaths, that is to say, more deaths than what would have been expected under normal conditions. However, crises could conceivably result in fewer people dying than usual. COVID-19, which typically did result in excess deaths, nonetheless reduced the number of chronic deaths from ordinary forms of influenza as people washed their hands more frequently, wore masks, and socially distanced themselves. As people quarantined, air quality improved, and the number of workplace and traffic accidents fell.
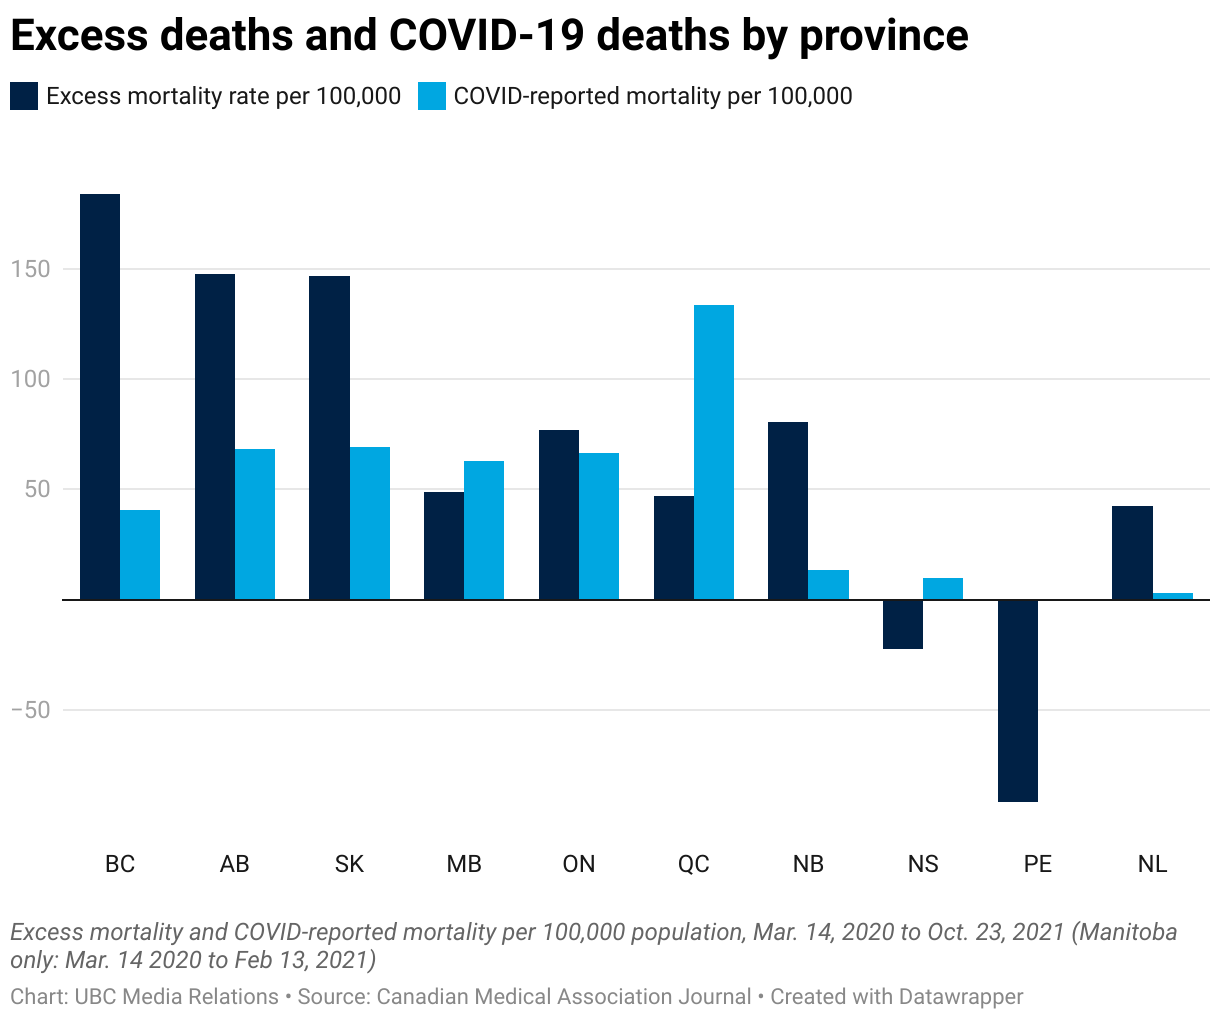
Figure 8-0 shows us that, in the first 17 months of the pandemic, Nova Scotia and Prince Edward Island experienced fewer deaths than usual: excess deaths were negative. In contrast, British Columbia had more than 150 excess deaths per 100,000 people at midyear, or 1.5 per 1000.

To calculate whether a nation experienced excess deaths due to a disaster or pandemic, we need to know the number of deaths that would have occurred without the disaster. How do we do that?
Nowadays we use statistical regression analysis to predict the number of deaths that will occur in any year. Regression analysis sifts through mounds and mounds of data to tease out the relationship between the the number of deaths in a particular age/sex group and a number of factors, factors like the size of the age/sex group, the number of deaths in that age/sex group in the previous year, GDP, average daily temperature, average daily sugar consumption, etc. Then, to find what deaths for each age/sex group would have been in 2020 without the COVID-19 pandemic, the researcher makes an inference based on what the 2020 values of all the relevant factors would have been without the pandemic.

Hurricane Maria was a Category 5 storm that battered the northeastern Caribbean in September, 2017. In 2018, the Milken Institute School of Public Health at George Washington University published a study of excess deaths in Puerto Rico due to Hurricane Maria. To come up with their calculations, they first collected age and gender-specific mortality rates and socioeconomic data for many years prior to the disaster, then used this data to predict what mortality rates would have been in the period September 2017 – March 2018 without the hurricane. They then compared these predicted deaths to the actual deaths during September 2017 – March 2018.
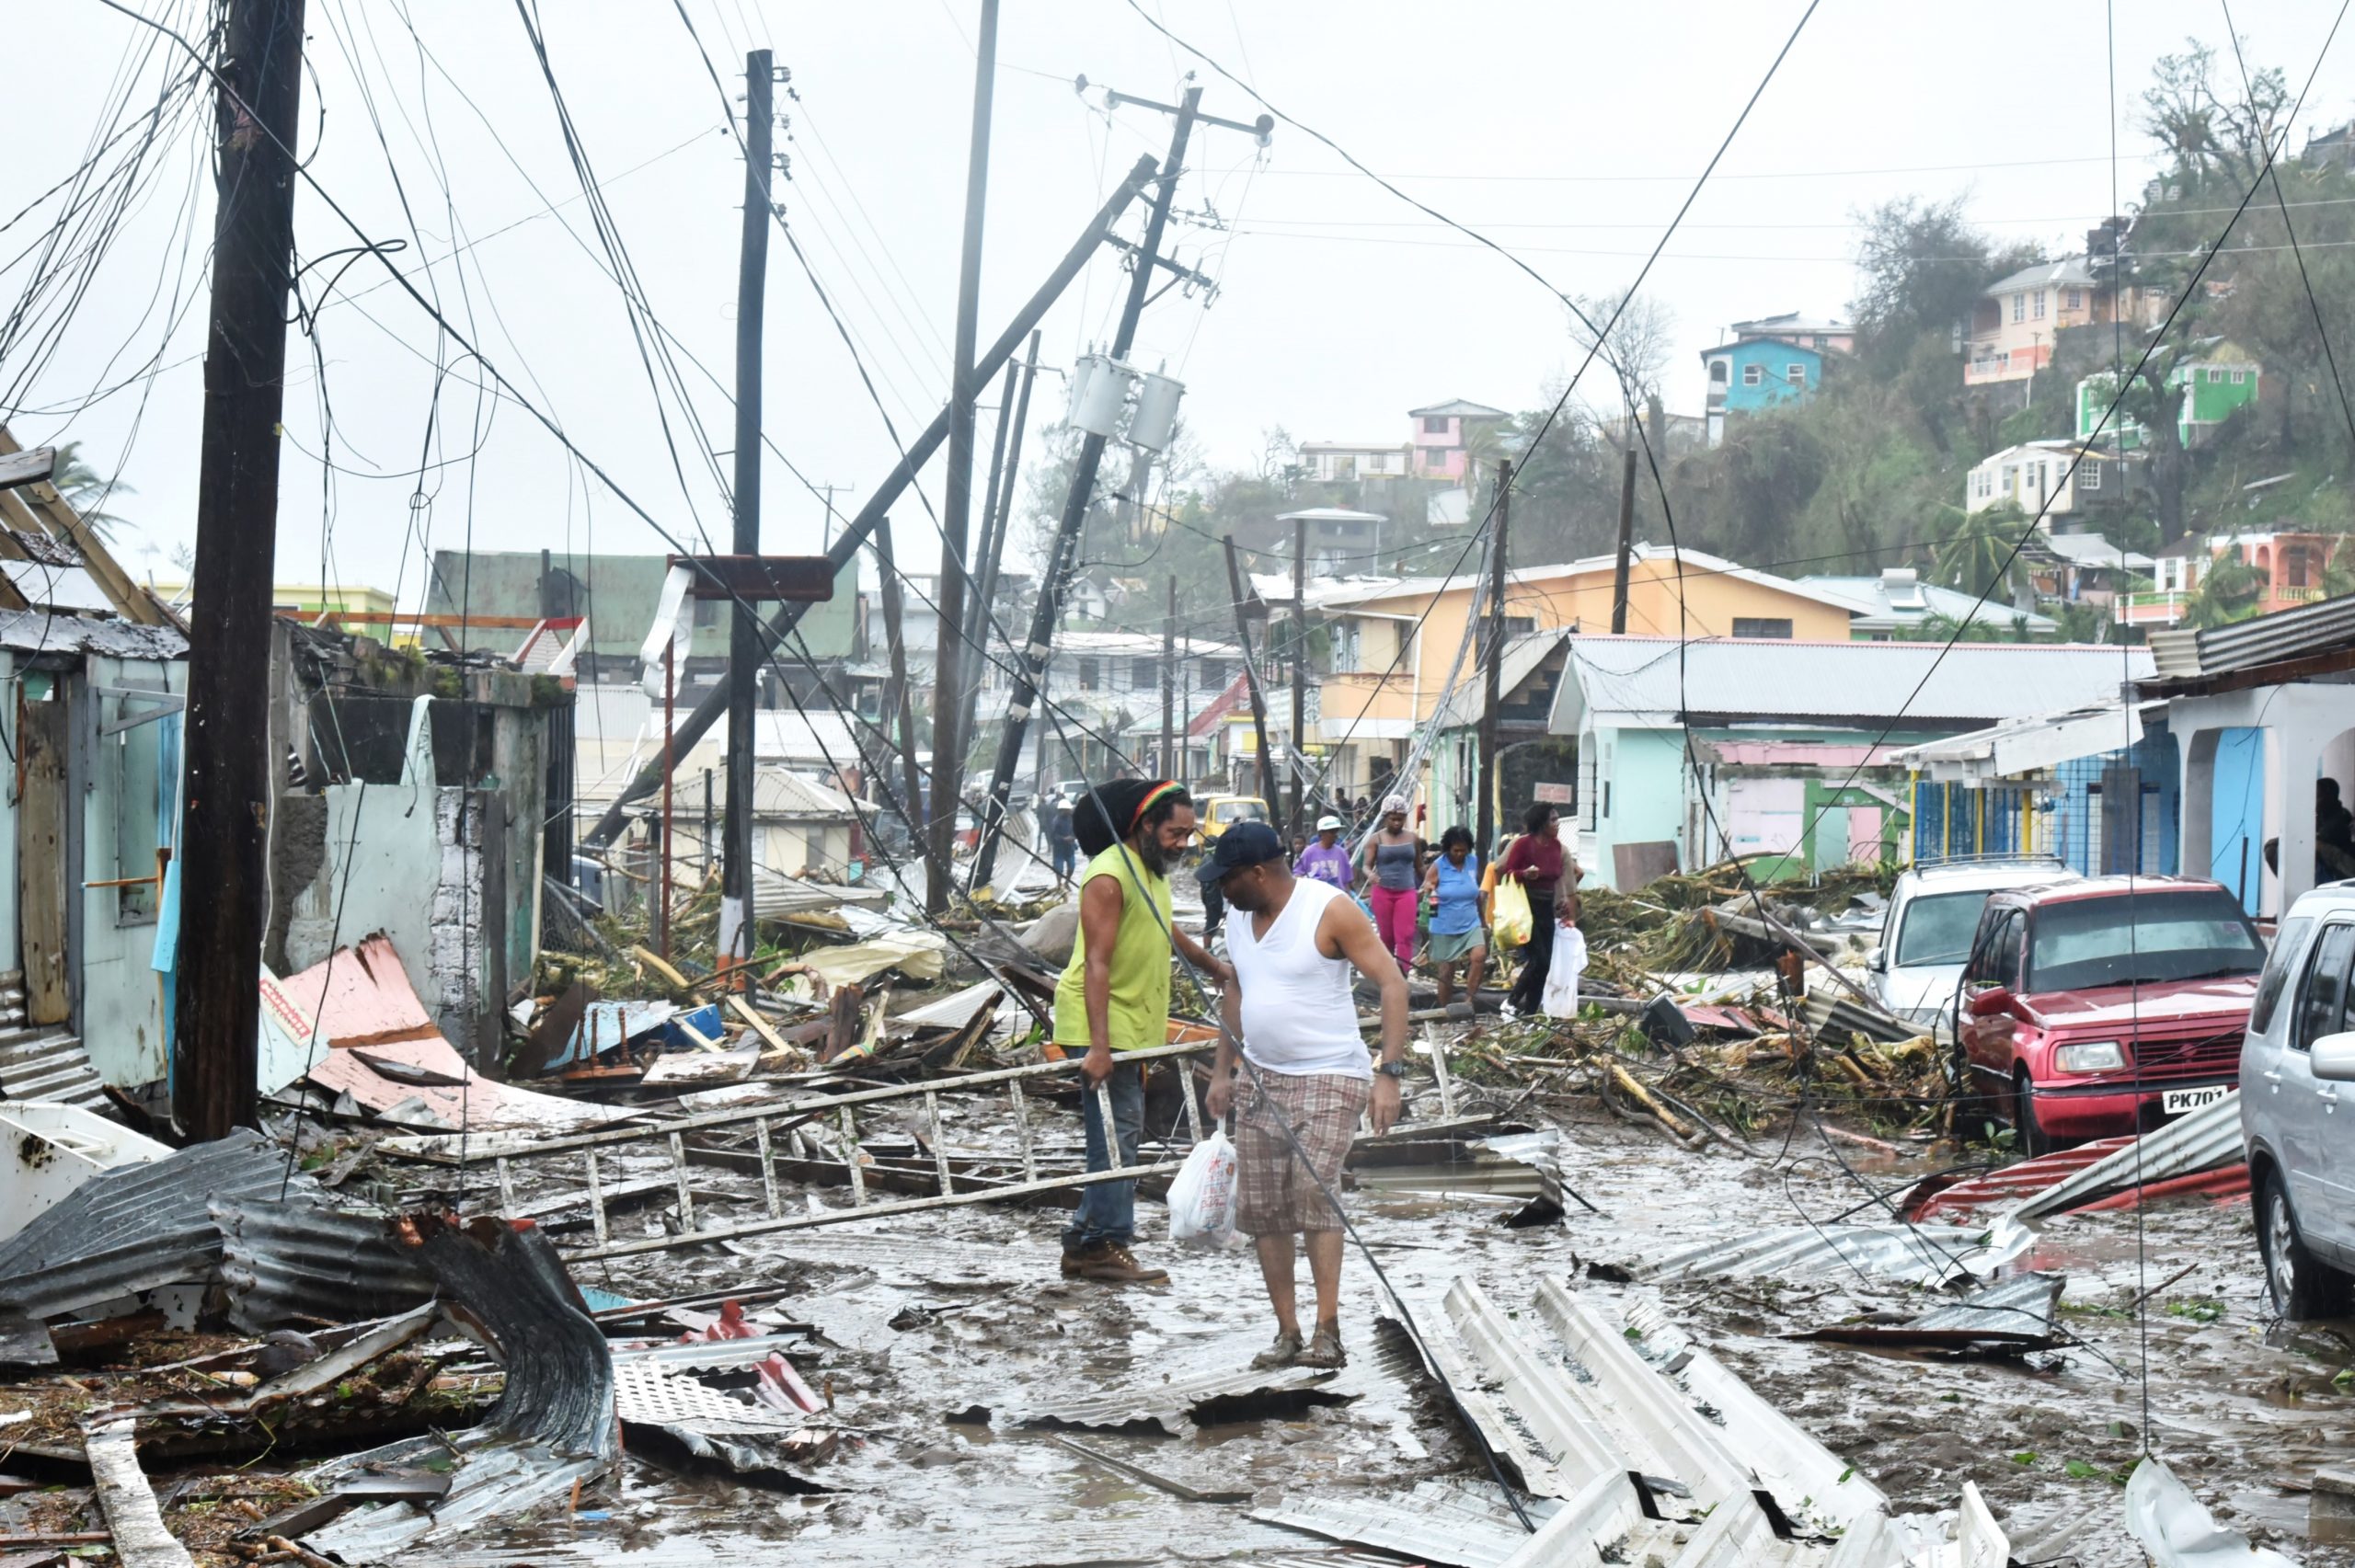
The scholars found that, during the six months after Hurricane Maria, Puerto Rico experienced 2,975 more deaths than would have been experienced without the hurricane. These excess deaths made up about 20% of the total deaths during the six-month period. As a comparison, excess deaths due to COVID-19 in 2020 were about 5% of total deaths in Canada and 11% of total deaths in the USA.[1].
Figure 8-1 below shows the spike in the monthly death rate in Puerto Rico in 2017. The dotted red line shows that the death rate would be even higher if you removed from the denominator all the people who left Puerto Rico during that 6-month period. The denominator in these monthly death rates is the mid-month population.

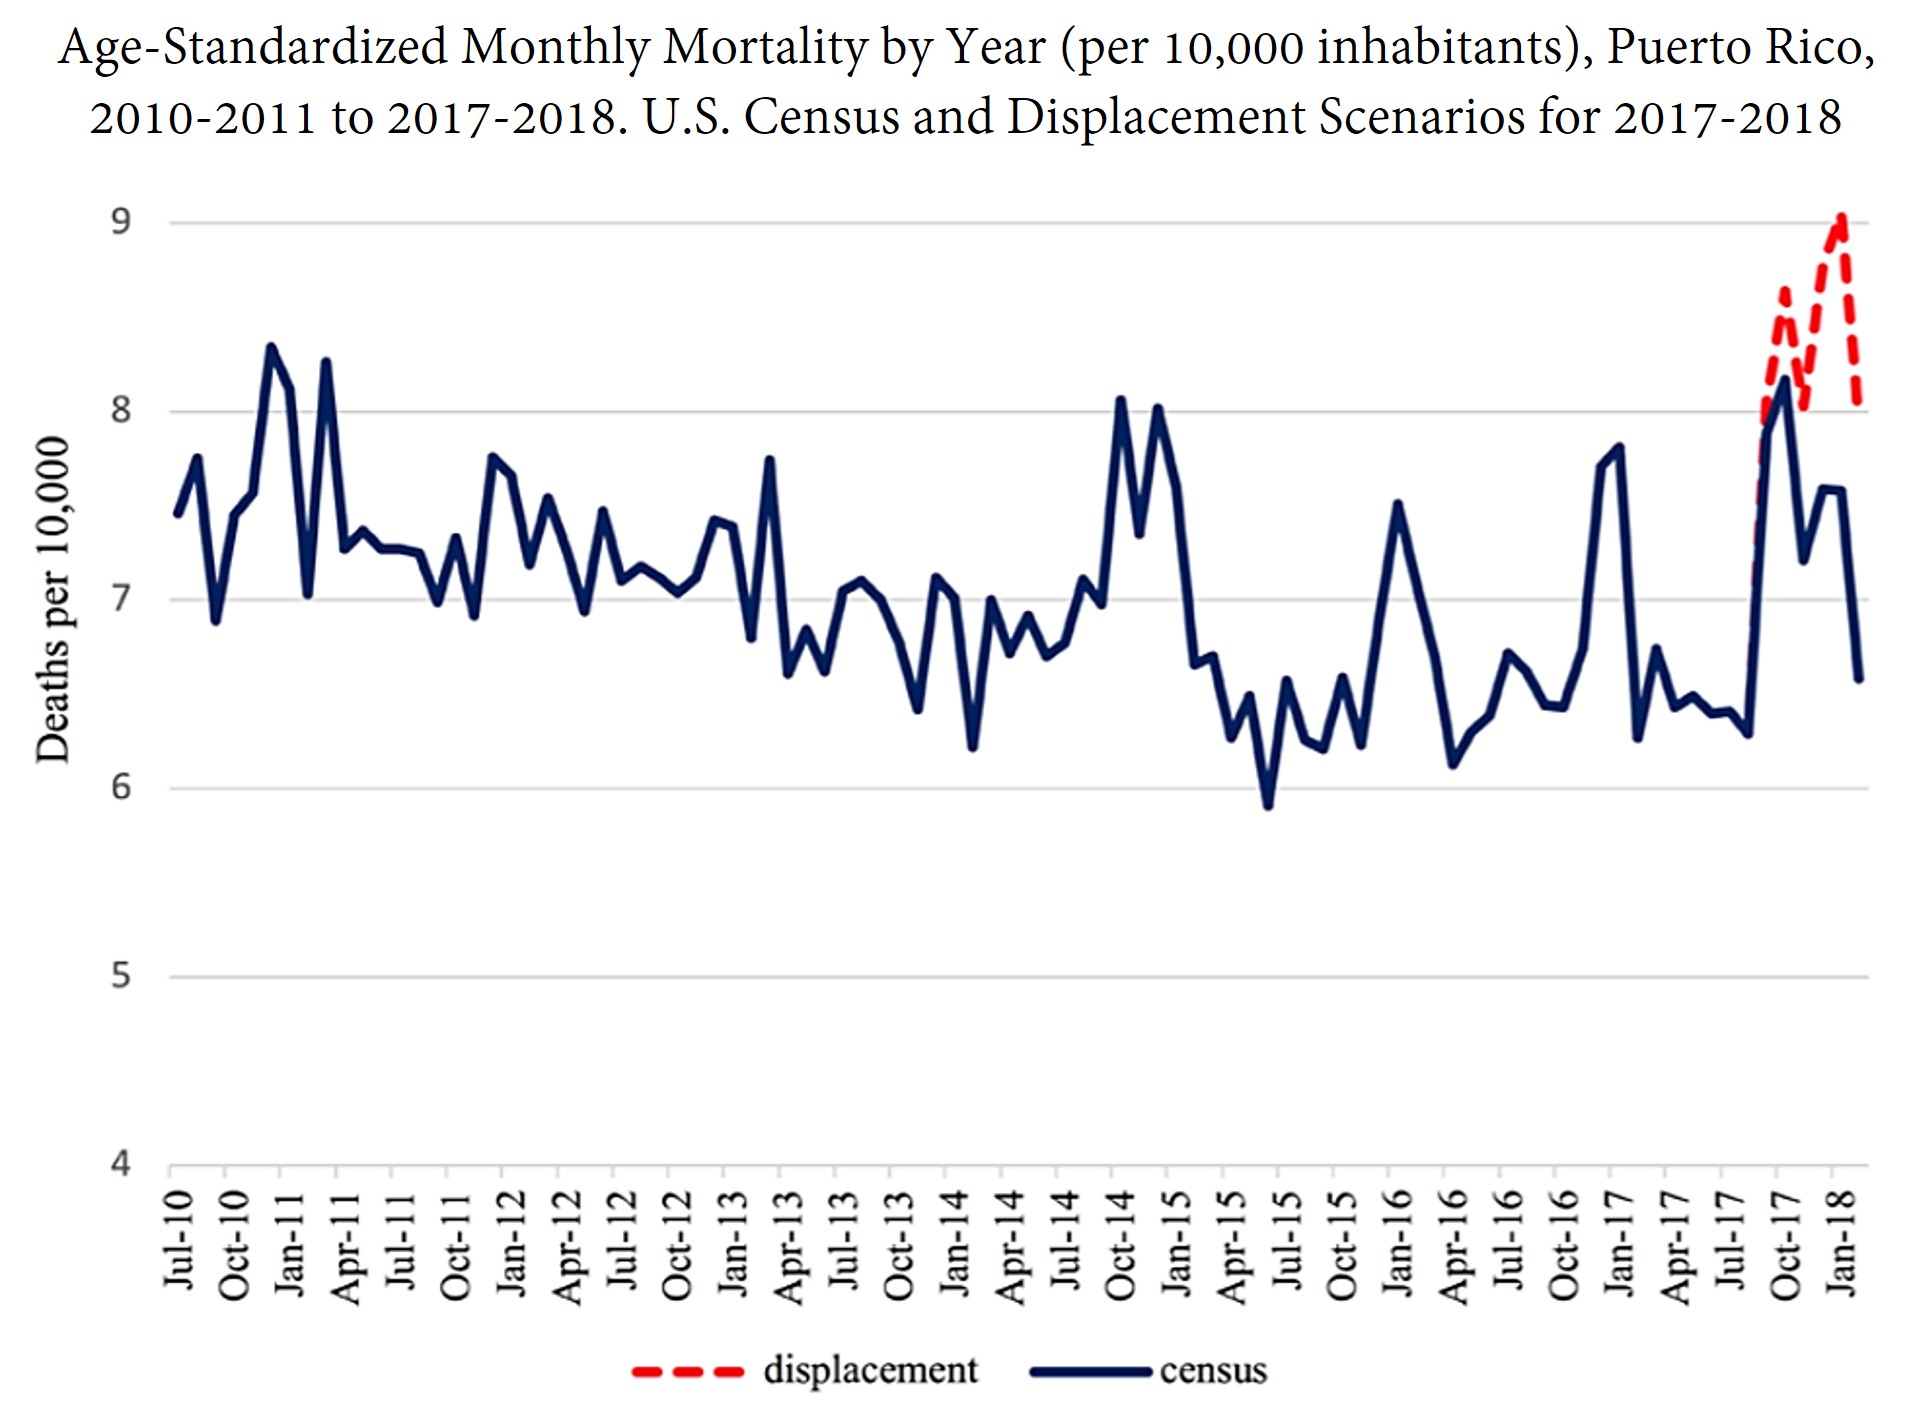
Figure 8-2 shows that less-privileged people suffered more excess deaths, and that their experience continued to deteriorate for four months, both in an absolute sense and relative to more privileged people.
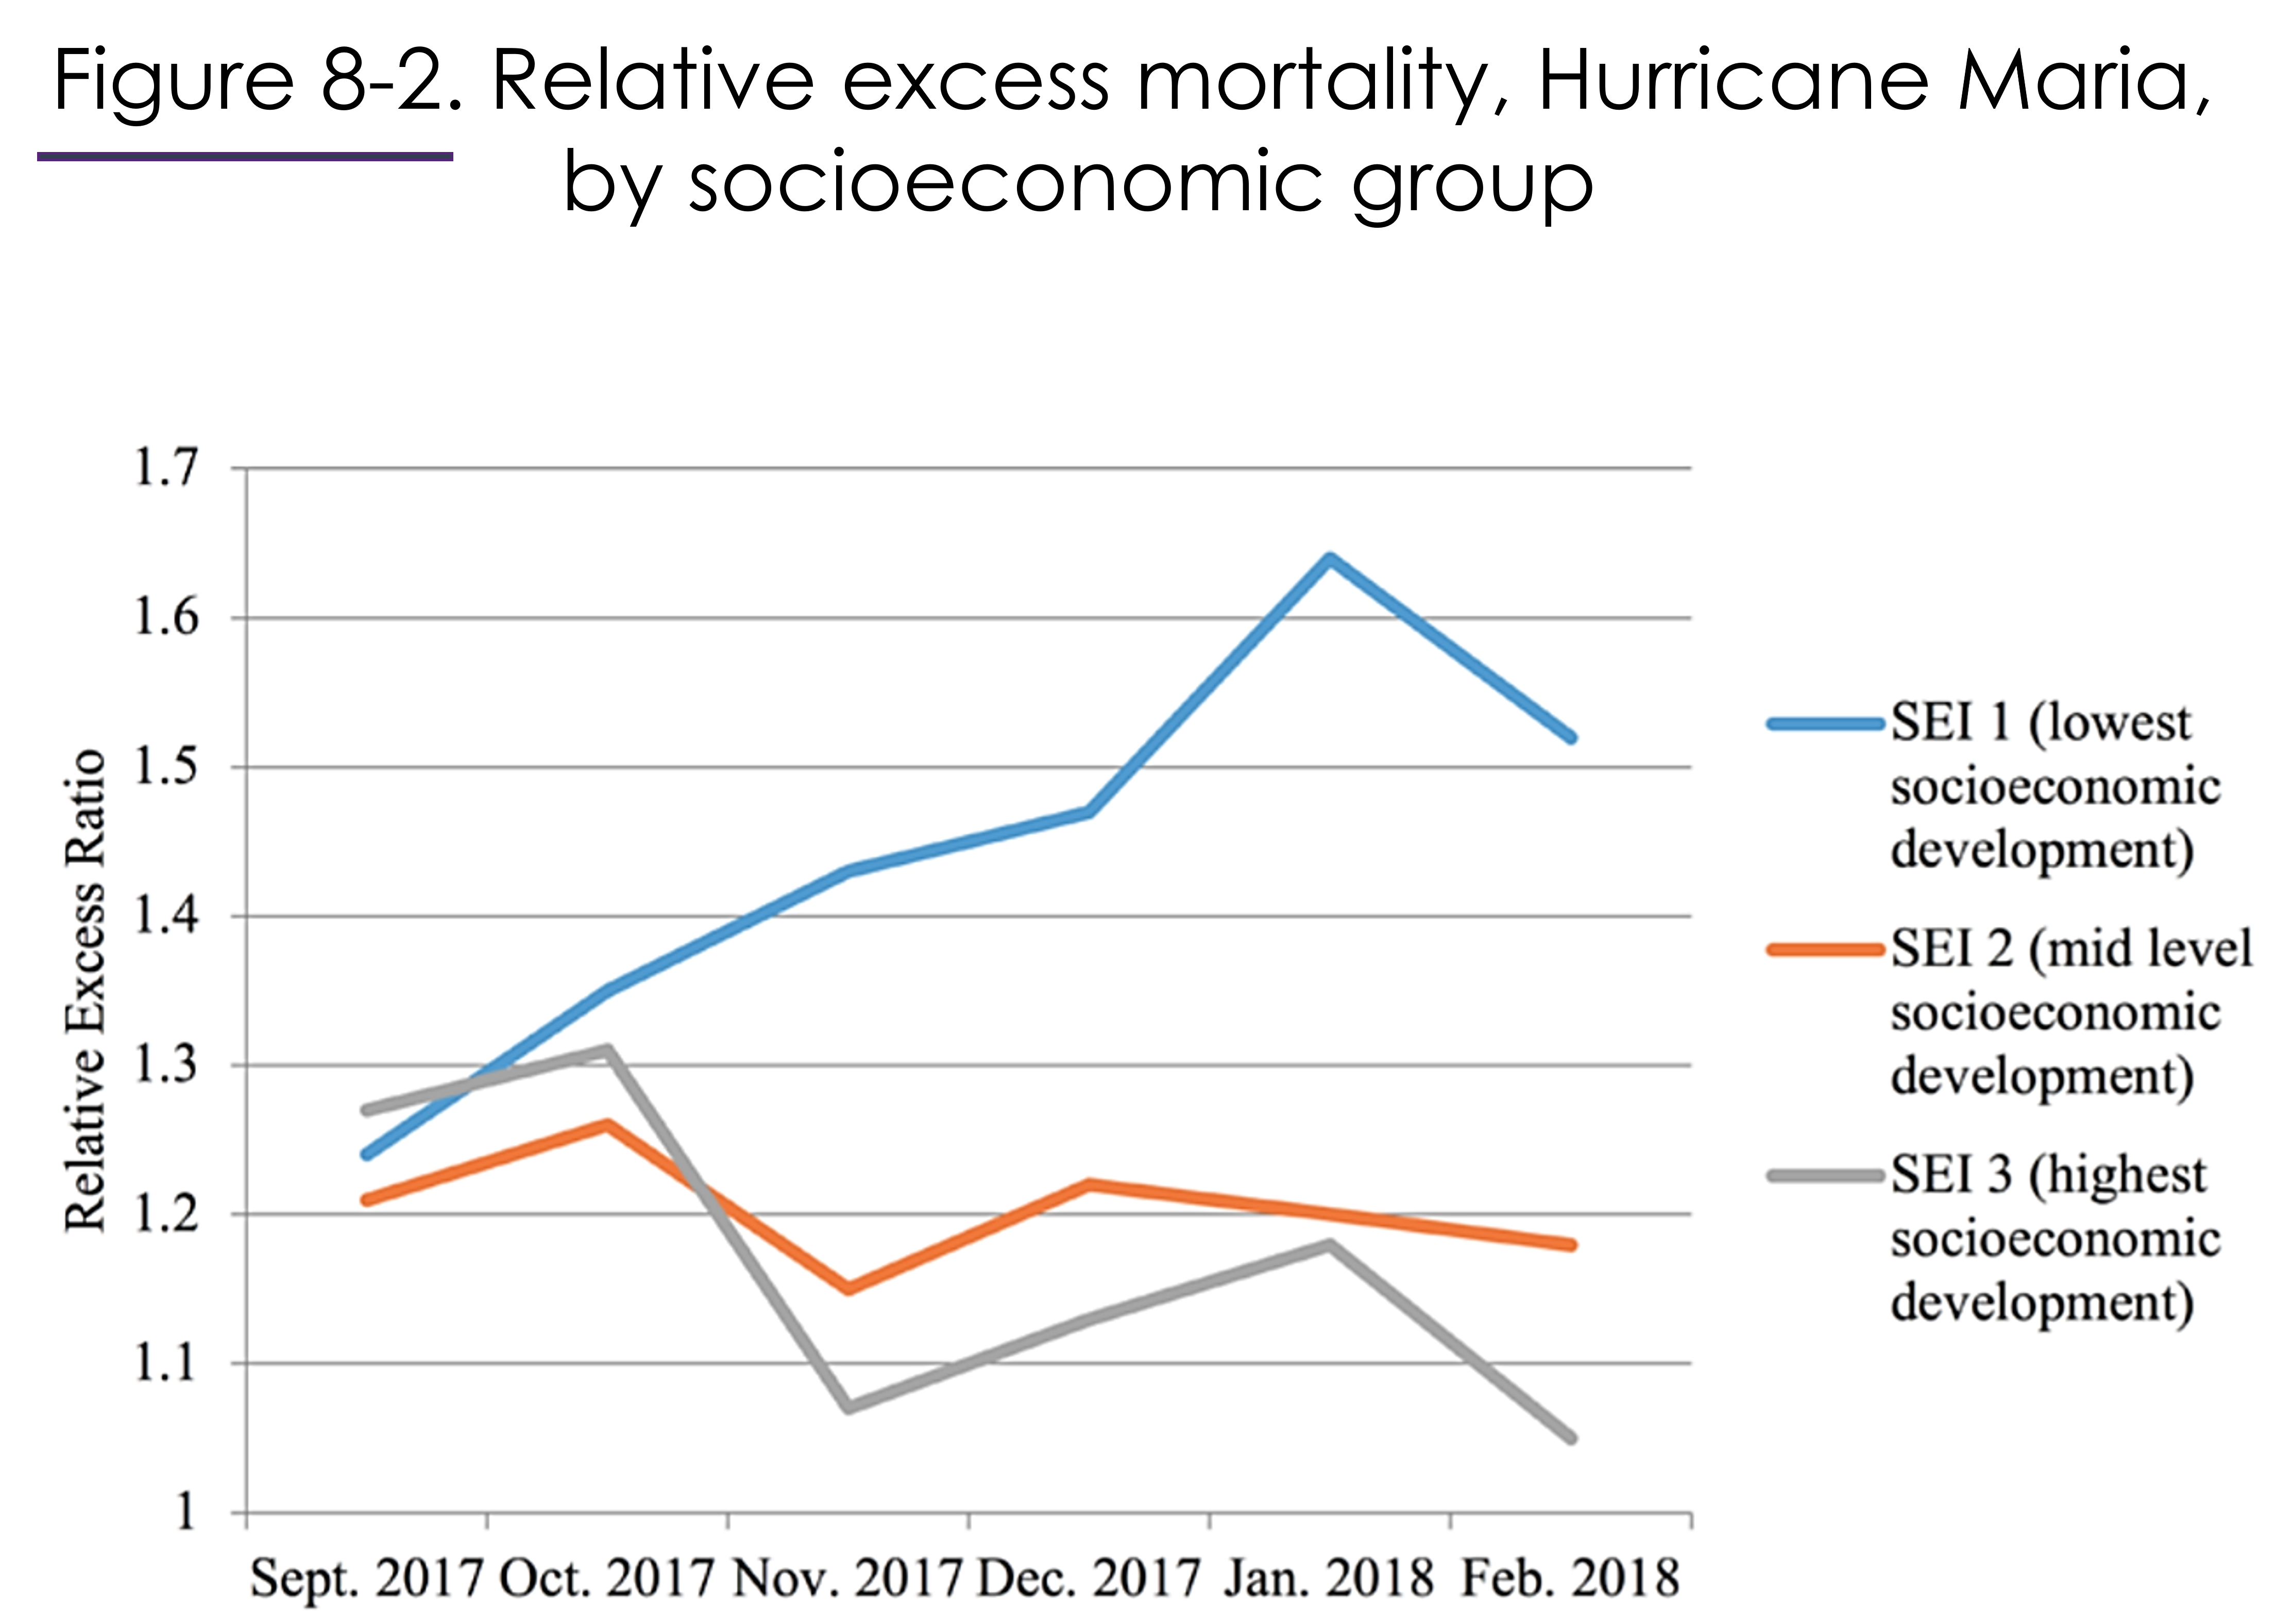
To understand Figure 8-2, note that the vertical axis shows the ratio of actual deaths to usual deaths. A level of “1” means no excess deaths. A level of “1.2” means that there are twenty per cent more deaths because of the hurricane.
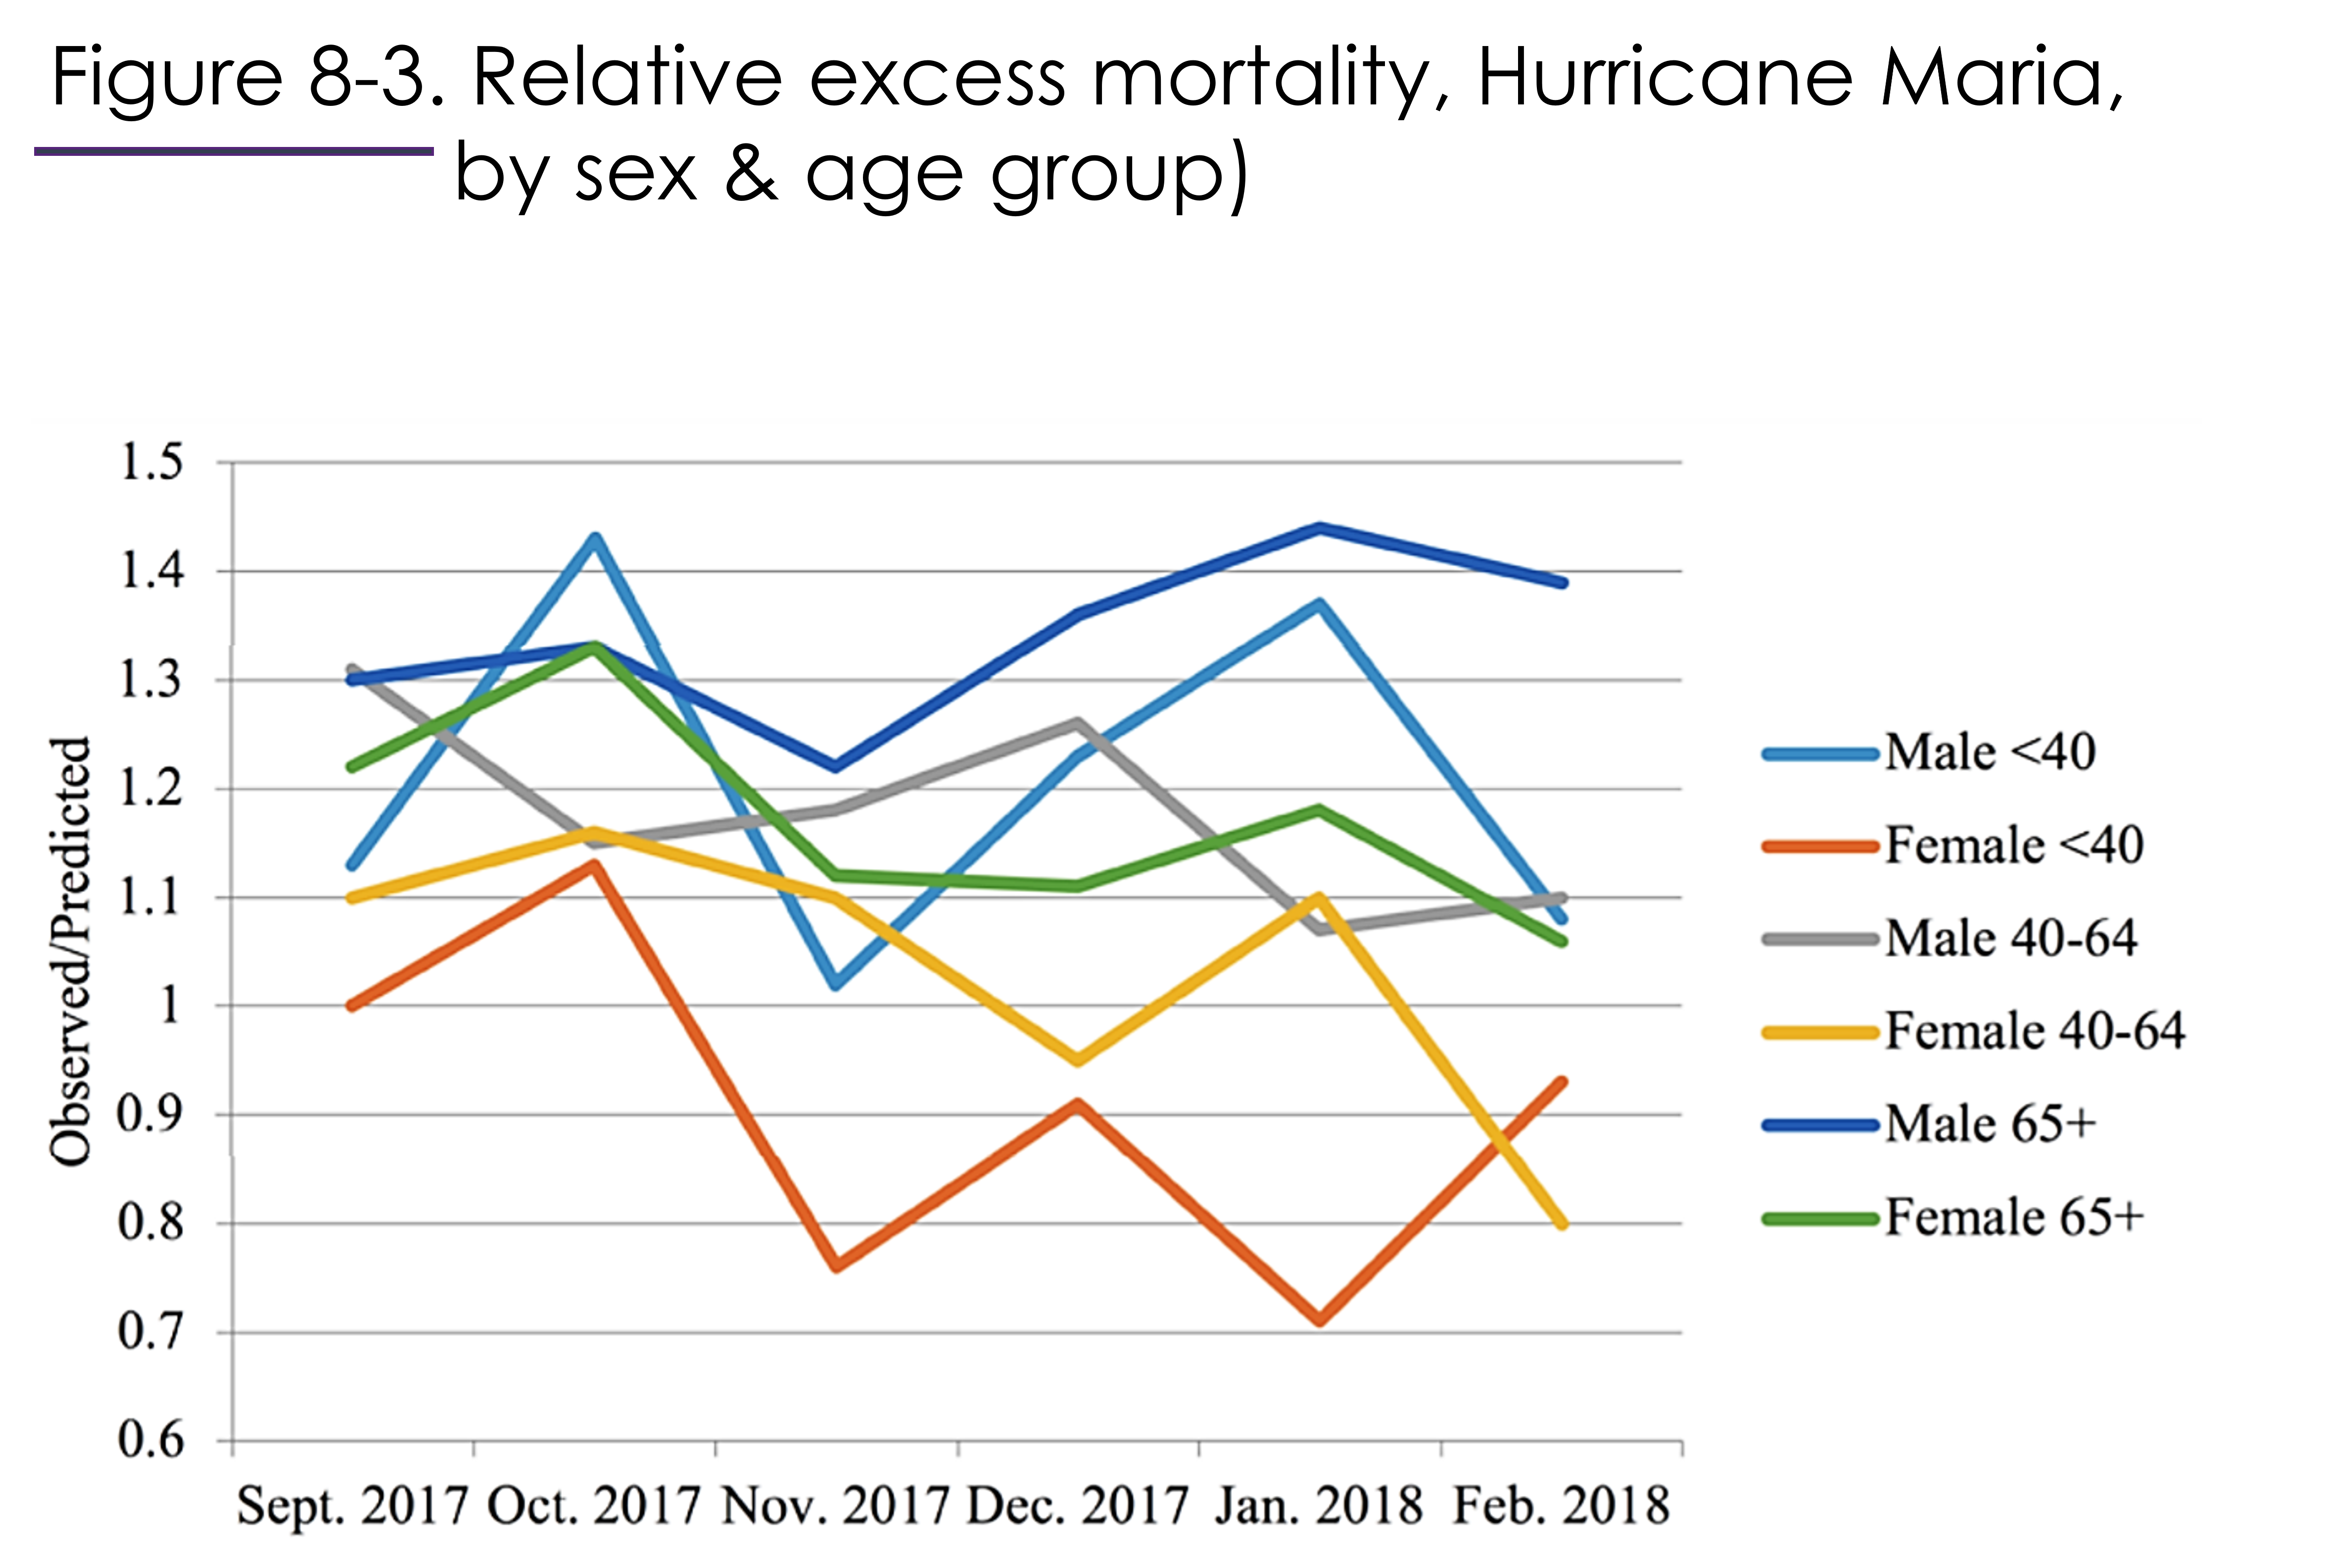
Figure 8-3 shows that it is not necessarily true that women suffer more during crises. The oldest people of both sexes, and middle-aged male Puerto Ricans, were hardest hit in the month following Hurricane Maria, possibly because of actions they were taking to protect others. All groups recovered to some degree in October. Later, young and middle-aged women began to experience less mortality than usual, while men, especially the older men, continued to suffer excess deaths.
In another study of excess deaths in Puerto Rica due to Hurricane Maria, Cruz-Cano and Mead (2019) determined that out of 1205 excess deaths in September and October 2017:
“Most excess deaths occurred from heart disease (253 deaths), “other” causes (204 deaths), diabetes (195 deaths), Alzheimer’s disease (122 deaths), and septicemia (81 deaths).”[2]
The crisis led to a deterioration of living conditions and lack of medical care. In this way crisis deaths included deaths from endemic diseases such as diabetes.
Historically, have more people been killed by pandemics, war, famine and other disasters, or by the daily grind of malnutrition, heavy labour, exposure to the elements, domestic violence, crime, endemic diseases and so forth?
Robert Fogel (1992) tackled this question and concluded that chronic living conditions were the main determinant of death rates in the past. He presented two pieces of evidence to support this claim.

First, Fogel examined Wrigley and Schofield’s excess death calculations for England for the period 1541-1871[3]. Fogel found that the excess deaths during the three hundred and thirty year period were a small fraction, less than 5%, of total deaths.
The second thing Fogel did was collect data on height – which is a measure of the net intake of nutrition from conception through adolescence – and weight – which is a measure of current net nutrition. Based on how height and weight affect mortality rates today, Fogel found that the height and weight of English, French, and Swedish soldiers prior to 1875 implied mortality rates very similar to the mortality rates they actually experienced. Fogel concluded that most of the mortality 1775-1875, and half the mortality 1875-1975, could be explained by nutrition, at least for the adult age groups he considered.

Kannisto and his team (1999) found that during famine (1866-1869) and wars (1789, 1808-9), most deaths in Finland were caused by infectious disease spread by armies, veterans, and refugees. People’s base level of health, nutrition, housing, and sanitation – their chronic living conditions – were key to survival.
Ordinary living conditions matter. We saw during the COVID-19 pandemic that the people whose health suffered most from COVID-19 were people with pre-existing health conditions, people eating poor diets, and people whose jobs required them to take public transit and to serve in public places. By the same token, some of the most powerful remedies against infection were simple: distancing, masking, and washing of hands. How many of these new habits will become part of our everyday lives? How many of our pre-COVID social norms and traditions developed in response to crises long ago?

Consider two nations. In one, most of the population lives in poverty and without access to hospitals. In the other, most of the population enjoys a good diet, clean water, and access to sophisticated medical care. A newly-evolved flu virus attacks both nations.
- Which nation is likely to experience a greater number of crisis deaths per 1000? Why?
- Which nation is more likely to have a higher ratio of crisis to chronic deaths? Why?
Crisis deaths are deaths caused by unusual situations such as natural disasters and wars.
Chronic deaths are the result of usual conditions and include the usual incidence of endemic diseases like chicken pox, pneumonia, and stroke.
Deaths over and above the usual number of deaths are called "excess deaths". To find the number of excess deaths, we have to estimate the number of chronic deaths, i.e. how many deaths we would normally expect.
