
While everyone knows that good governments should promote health and safety, it’s not obvious when and if governments should ever promote either increased or decreased fertility. In the case of mortality policy, it’s pretty obvious whether a policy will promote health and longevity. But whether a policy will increase or decrease fertility can be difficult to figure out when it generates both a substitution and an income effect.
Fertility has been both discouraged (with “anti-natalist” policies) and encouraged (with “pro-natalist” policies) by governments at different times and places. When governments make fertility the subject of policy, it’s usually in order to affect the rate of growth of the population or of the labour force. For example, Quebec promoted fertility between 1988 and 1997 with the aim of sustaining the francophone population and keeping francophone culture alive in North America.
As with all policies, we should consider whether the chosen tactic is really the best way of achieving our ultimate goal. If our ultimate goal is protecting francophone culture, or improving GDP per person, there are likely better ways of achieving this goal than trying to manipulate the fertility rate.
Many people believe that fertility is a deeply personal individual freedom that government has no business tampering with, but we are generally content to allow a government its incentives and advertising regarding fertility, so long as government does not coerce us, discriminate among us, or manipulate us.
The issue of coercion versus freedom to choose comes up in debates about whether or not abortion should be legal. The proposed right to life of a fetus/unborn child clashes with the proposed right of a pregnant person to abort a fetus/unborn child. The issue of which of these rights is valid and, if both are valid, how to balance them is an important one which cannot be addressed by Economics for the reasons discussed in Chapter 1. However, economists can point out that often governments are choosing one side of the debate or another not because of their values, but to achieve a target level of fertility in the population. For example, Romania (1965-1989) outlawed abortion to achieve a higher birth rate. Meanwhile, Singapore legalized abortion in 1969 for the express purpose of reducing births. In the most extreme cases, governments have forced people to have abortions or to undergo sterilization to achieve population growth reduction targets or to selectively eliminate unwanted people.
Indeed, fertility policy impacts particular income classes and cultural groups differently, either intentionally or unintentionally. Thus discrimination is another issue complicating fertility policy.


In 2021, human rights activists were warning that Uyghur people in Xinjiang, China were being sterilized against their will. In February of 2021, the Canadian Parliament unanimously upheld the United Nations General Assembly Resolution 260 , which officially recognizes coerced sterilizations, re-training camps and other interventions as “genocide” (Turnbull & Aiello, 2021).
Canada, however, is not innocent of such things. Canada has downplayed the forced sterilization of Indigenous women (Lombard 2021). In a 2021 report by the Canadian Senate, Forced and Coerced Sterilization of Persons in Canada, the number of women who have been subject to coerced sterilizations in Canada is described as “unclear” (Standing Senate Committee on Human Rights, 2021) despite several in depth-investigations. Dr. Karen Stote of Wilfried Laurier University has testified that between 1962 and 1972 over 1,200 Indigenous persons were coerced into being sterilized or were forcibly sterilized (Ibid.). Though forced sterilization was illegal everywhere in Canada after 1972, between 1972 and 1974 over 582 women were sterilized in NWT, Yukon, British Columbia, Alberta, Manitoba, Saskatchewan and Ontario healthcare institutions. (Avery Zingel 2019). 95% of these women were Indigenous.
More recently, over 60 Indigenous women have come forward to testify that that they were coerced into agreeing to sterilization procedures during their labour, without proper consent, or under false pretenses (International Justice Resource Centre, 2019). Indigenous women have also been threatened with having their children taken away from them unless they consent to be sterilized. A class action lawsuit against the province of Saskatchewan, organized in 2018, is pursuing these charges.


It is tempting for health care practitioners, the general public, and governments to think they understand who should be having babies and what kind of babies should be born. In the early twentieth century, leading citizens around the world embraced Eugenics, the study of directing human fertility in such a way as to breed human beings for desirable characteristics. Many leading figures of that time believed in Eugenics, including President Theodore Roosevelt, Planned Parenthood founder Margaret Sanger, and celebrated economist Irving Fisher.

The forcible sterilization of mentally ill and cognitively impaired people was widely seen as acceptable in North America and northwestern Europe in the early twentieth century. In Canada, the Eugenics movement was prominent in Alberta, where a Eugenics Board, with the authority to sterilize people deemed defective, operated between 1928 and 1972. Forced sterilizations were also approved in British Columbia.
In large part because of the horrors perpetuated by Nazis, western opinion and government policy moved away from Eugenics after World War II. Today in Canada, the 1986 Supreme Court decision E. (Mrs.) v. Eve requires that no matter how intellectually disabled a person is, they cannot be sterilized without their understanding and consent unless the sterilization is needed for medical reasons. Medical reasons include things like cancer of the uterus or a person’s phobia of blood which would be triggered by menstruation.
The United Nations’ Convention on the Rights of Persons with Disabilities and International Covenant on Civil and Political Rights supports the fertility rights of disabled persons.
Although sterilization for non-therapeutic reasons is against the law in Canada, the United States has no similar law. It relies on the American College of Obstetricians and Gynecologists to set guidelines to protect dependents from coercive procedures. Laws or guidelines may not be sufficient. Even thirty-year-old celebrity Britney Spears claimed in 2021 that her father had prevented her from removing a contraceptive device. (He had obtained legal guardianship over her due to her mental health issues. He no longer has legal guardianship.)
While governments have shifted away from Eugenics, pre-natal screening and liberal abortion laws allow many parents to apply Eugenics principles themselves. Ironically, just when we are embracing diversity and supporting the empowerment of people with disabilities, we have the means and often the will to make sure that many children with disabilities are never born.
Putting Eugenics in the hands of parents is a lot safer than having the government decide which kids can be born; there is a diversity of parents who will welcome children like themselves, preserving diversity. However, it is clear that children with disabilities, and in some societies, girl children (see chapter 24 on son preference), are less welcome. In the future it may become easier to select for all kinds of apparent abilities and advantages.
Economics cannot be relied upon to dissuade parents from this course of action, especially if children with unwanted characteristics cost more to raise and governments are not willing to share the financial challenge. However, Economics can remind us that diversity has been a source of strength, providing new perspectives, therapies, and innovations. Our society’s strength, our government’s strength, our economy’s strength, arise from diversity, cooperation, and competition, rather than in conformity, coercion, and cronyism.
Let’s now have a look at specific fertility policies that have been implemented at various times and places. Recall our principles of policy design from Chapter 10: Do not coerce or discriminate, target the ultimate goal, target the binding constraint, target the correct margin, and be aware of who will pay most of any tax or subsidy.
Lump-Sum Monetary Incentives
Money, gifts and lotteries have been offered to people to get them either to have more children or to be sterilized. Several questions are relevant here.
- Coercion: Is this financial offer actually coercive? Will some people feel they have no financial choice but to participate? Are they being trapped into doing something they will later regret? Will government be there to financially support them later on?
- Discrimination: Is this financial offer actually discriminatory? Will it, and is it intended to, affect mostly the fertility of people who have less income, people of a particular ethnicity or social class?
- Targeting: Why is the government wanting to alter the fertility rate? Is there a better way to achieve the ultimate goal of the government?
- Constraints: Is money actually the binding constraint? Is lack of money what is holding people back from what the government desires them to do? If not, this policy will be useless in achieving the government’s goal.
- Margins: What margin is most relevant? For example, if the government wants people to have more children, and most people have one child anyway, it would make economic sense to offer monetary incentives only for the second child and subsequent children.
- Tax/Subsidy incidence: Will the extra money in the hands of recipients be captured by landlords, relatives, or fraudsters?
Subsidies
Sometimes the government offers money for particular expenditures. As usual, we must ask what the government’s ultimate goal is. Is the government discriminating or being coercive? Is money really the binding constraint? What margins of choice are being affected?
Recall from our discussion of tax and subsidy incidence in Chapter 10 that a subsidy does not always very much benefit the group we had in mind. For example, if the government subsidizes the price of daycare, and if the price elasticity of demand for daycare is higher than the price elasticity of supply for daycare, most of the subsidy will go to daycare suppliers, not to parents. This is because the surge in demand caused by the subsidy outpaces the ability of the industry to increase the number of available daycare spaces, and so the price of daycare goes up.
Even if daycare will certainly become cheaper, it is not certain that births will increase. The case of daycare is complex. Daycare fees are a cost to a parent of being employed outside the home. For the parent absolutely committed to working outside the home, a daycare subsidy reduces the parent’s child-related expenses and encourages the working parent to have children.
But for a parent at the margin of deciding whether to work outside the home or not, subsidizing daycare makes the effective take-home pay higher, increasing the opportunity cost of staying at home and making it more likely that the parent will go to work outside the home. So we expect that labour force participation will increase when daycare is subsidized, and this has a depressing effect on fertility inasmuch as labour force participation interferes with child rearing. The effect of daycare subsidies on fertility depends on how committed parents are to the workforce.
Parental Leave and Career Disruption
Parental Leave is a right given to employees to take time off work upon the birth or adoption of a child. Some or all the parent’s usual wage may be paid by the government. In Canada in 2021, 15 weeks of maternity leave for a mother after giving birth and 35 weeks of parental leave for either parent to take care of a newborn or adopted child were available at 55% of regular wages, to a maximum of $595 per week.
Employers could elect to contribute to the compensation, for example by topping up employment insurance contributions to so that the parent received as much as 95% or 100% of the previous wage.
Parental Leave will be most effective at increasing fertility when time is the binding constraint, that is, when parents don’t feel right about having kids unless they are able to devote a lot of time to newborns.
There is concern that women are the people most likely to take parental leave and to end up with gaps in their employment history. This results in lower earnings and fewer career promotions for women than men. At the same time, many women including the author have been willing to trade career progress for time spent with their children because they find caring for their children meaningful and rewarding.
In the interests of reducing the workload of women, and to promote father-child bonding, parental leave includes fathers as well as mothers. In Canada, both parents can take leave at the same time. Anecdotal evidence from Queen’s University in Kingston suggests that when professors take parental leave at the same time, mothers are doing most of the caregiving, while fathers are using the time off from teaching to further their research. If this pattern holds more generally, then the double parental leave actually aggravates the career disadvantage for women.

Singapore’s fertility policy over the last fifty years has changed a great deal. Wong and Yeoh (2003) show how the government of Singapore was unable to control fertility in the face of strong economic and cultural pressures, and how it changed its mind about what it even wanted to accomplish.
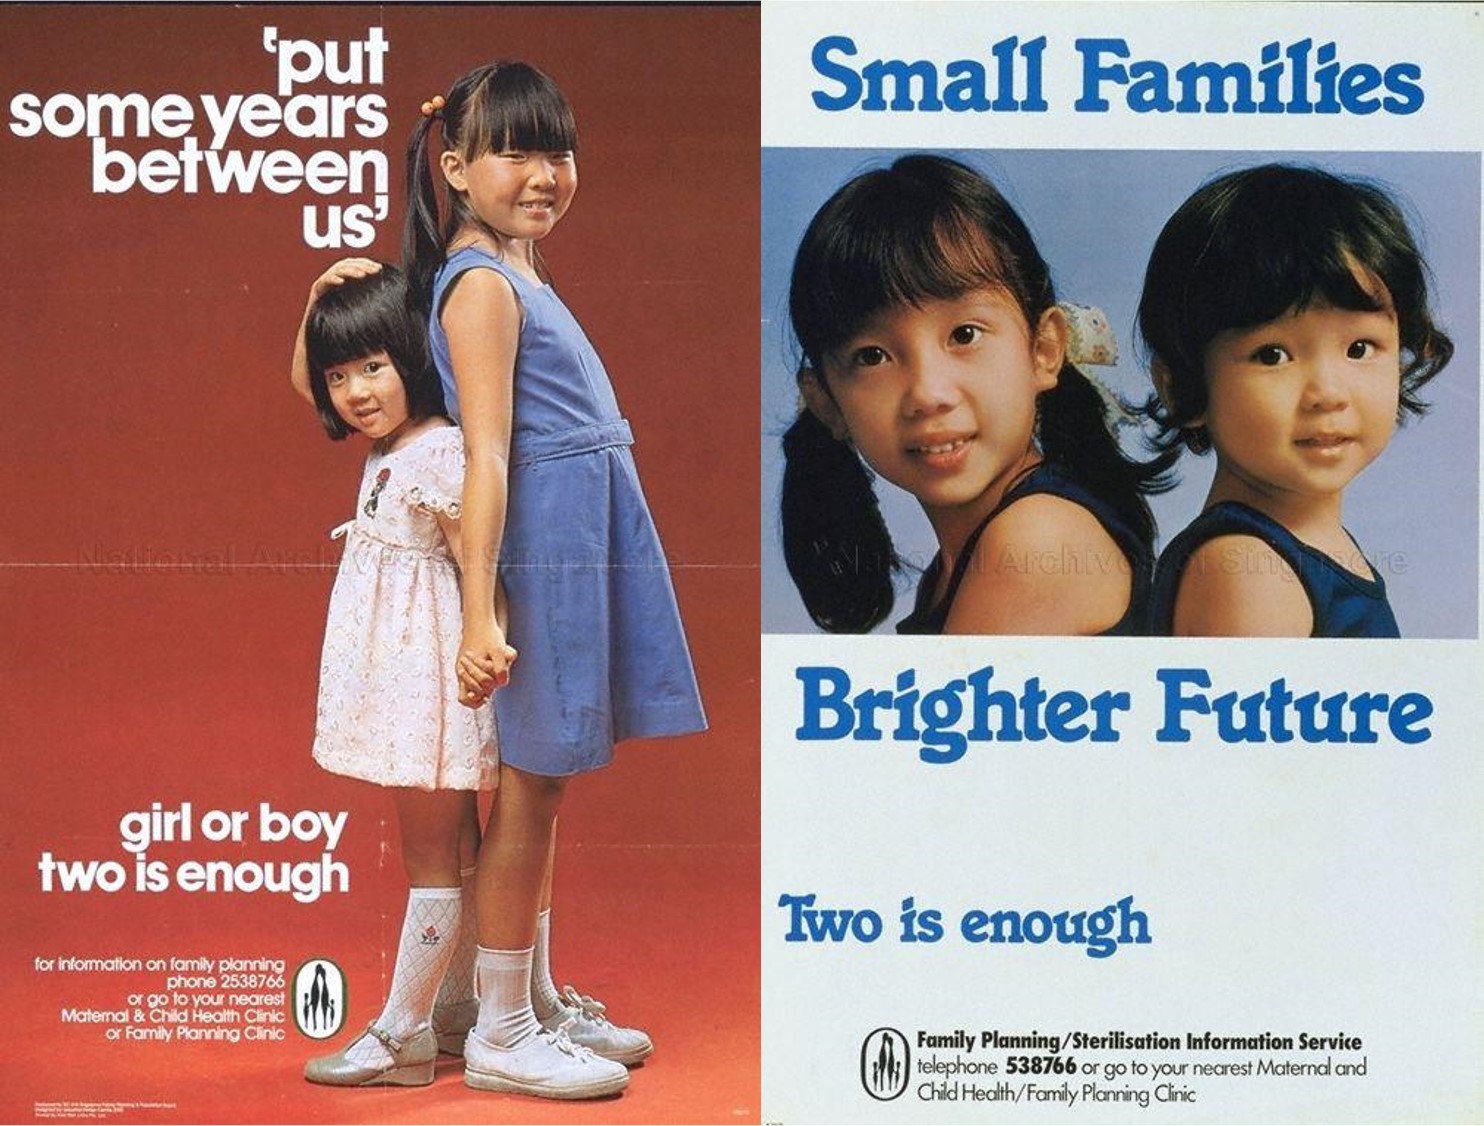
In the late 1960s and during the 1970s, Singapore wanted to slow its population growth rate, and it strongly encouraged people to have fewer children. This is shown in the posters below, which imply that families should not keep trying for a boy, but be satisfied with any two children. Children should also be spaced further apart in time, according to this advertising. Spacing children further apart increases the chance that a couple’s ability to have children will expire before they change their mind about having a small family; also, spacing children also helps families allocate more time and money to each child.
During this campaign the government of Singapore legalized abortion. It subsidized abortion as well as contraception. It imposed mandatory “family planning” counselling sessions to inform couples about birth control.
Fertility rates did come down, mostly among Chinese Singaporeans, who had the highest education levels and the best jobs, and whose fertility might have dropped anyway as educational opportunities, work opportunities, and urbanization increased. This was not what the government had been hoping for. In 1984 Singapore began to target its fertility reduction campaign on less educated women – who were primarily Malay and Indian in ethnicity. The government offered mothers who had not completed secondary school, who had low household income, and who had only one or two children a substantial cash gift and preferential school placement for the children if they agreed to be sterilized. Meanwhile, the government offered preferential school placement to college-educated mothers who had two or more children. Both programs were unpopular and attracted few participants.[1].

![This graph has time on the horizontal axis, from 1970 to 2001. The vertical axis measures the Total Fertility Rate (TFR). We see that between 1970 and 1981, when the government encouraged families to "Stop at Two [Children]", TFR fell from a high of 3 children per woman or more for all ethnic groups to at or below 2.1 for all ethnic groups. Malays continued to have the highest TFR, followed by Indians, then Chinese. During the Eugenics period (1982-1986), TFR remained steady for Malays, fell slightly for Indians, and fell signficantly for Chinese. After 1986 the government switched to a policy of encouraging three or more children. This was effective at raising Malays' TFR, but Indian and Chinese TFR continued to fall. In 2001, the TFR of all ethnic groups was declining; Malaysian TFR was about 2.4, Indian TFR was about 1.5, and Chinese TFR was about 1.2 children per woman.](https://ecampusontario.pressbooks.pub/app/uploads/sites/1262/2021/07/10-Figure1-1.png)
This “Eugenics phase” lasted only about four years. Concerned about a shortage of unskilled workers, the government stopped discouraging less-educated women from giving birth in 1987. It switched gears completely, deciding that lack of population growth was the problem. Its mantra became “Have Three, or More if You Can Afford It.” The policies that developed then and persist to this day discourage abortion, encourage marriage, and make living with children more affordable. These policies have not been sufficient to prevent the Total Fertility Rate from declining further to 1.14 (2019) from 1.62 in 1987.
Figure 13-2 above shows the Total Fertility Rate for Malay, Indian and Chinese ethnic groups in Singapore from the anti-natalist days through the Eugenics phase to the pro-natalist era.


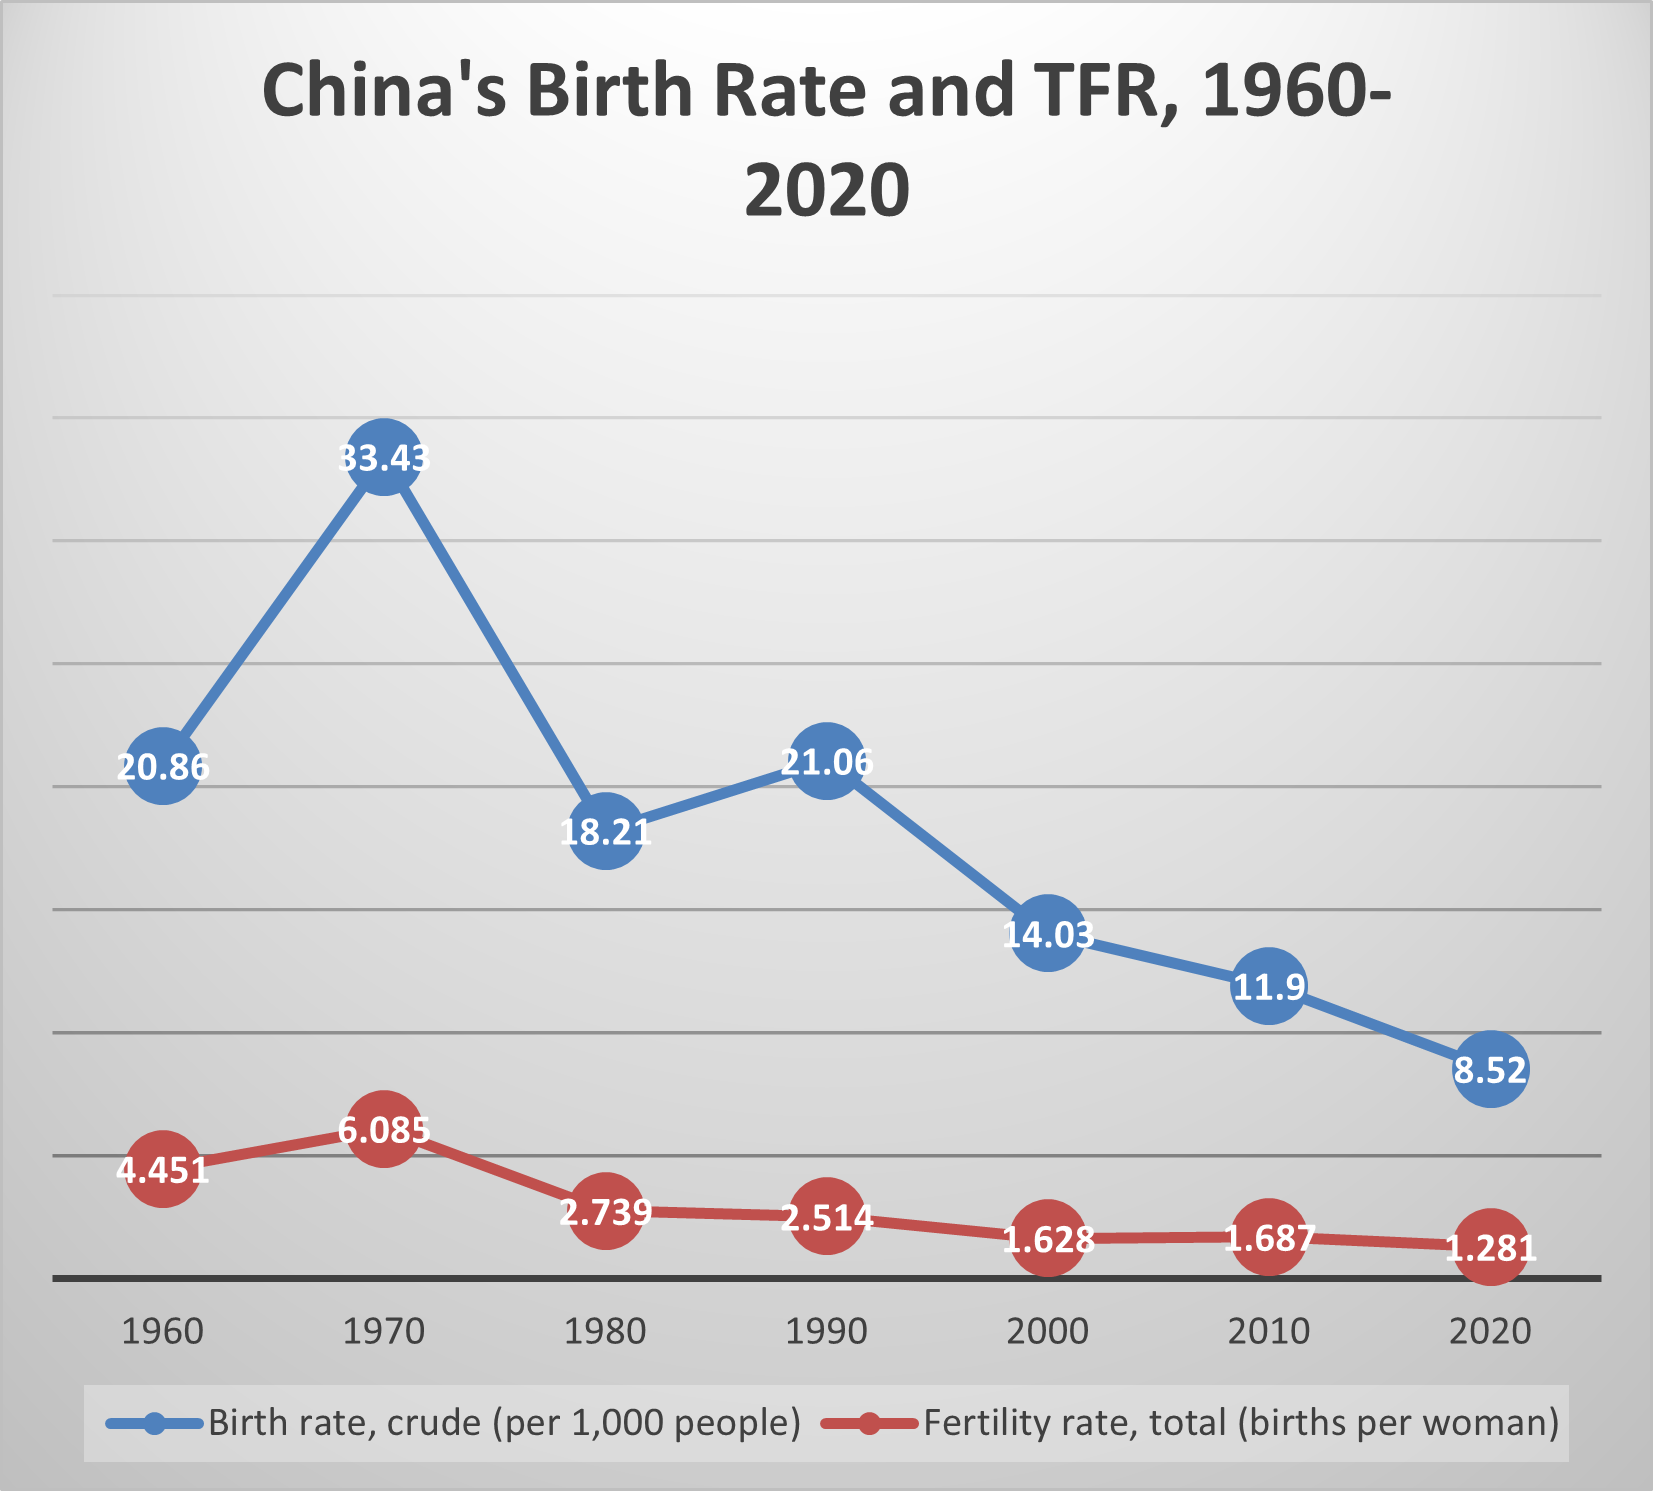
As shown in Figure 3-3, China’s Total Fertility Rate grew from 4.5 children per woman to 6.1 children per woman between 1960 and 1970. Its Birth Rate grew from 20.9 per 1000 to 33.4 per 1000. But during the 1970s, ostensibly due to improving economic conditions and opportunities, both rates fell, by more than they would ever fall again in the next four decades.
Even though fertility rates and birth rates were already falling, in 1979 China began a rigorous program to achieve zero population growth or “ZPG” by the year 2000. Urban couples were limited to having one child. Rural, farming families could have two children if they were spaced apart by four years, or if the first one was a girl or disabled, acknowledging the strong preference for sons. Ethnic minorities were allowed two or three children, and rural Tibetans, any number of children.

The legal age at first marriage was adjusted upward, from age 18 to age 25 for urban women, and from age 20 to age 28 for urban men. (The legal age for first marriage was set a few years lower for rural women and men.) Because births outside of marriage were unusual and greatly stigmatized, raising the age at first marriage reduced the life years available to have children.
Married women were regularly visited by government employees and asked about their contraceptive use. A permit was necessary for each birth. Without a permit, parents could be fined for having a child, and would lose out on subsidized housing, education, and pensions in the city, or extra work points and rations in the countryside. Worse yet, in some locations, women without birth permits were forced to have abortions and to be sterilized. Coercion was not officially prohibited until 2001. The degree of coercion can be gauged by how quickly the one-child family became the norm. It is estimated that since the 1990s, ninety percent of births have been only-child births.[2]

As Figure 13-3 shows, during the first decade of the One Child Policy, TFR fell some more. The birth rate actually rose due to population momentum. After 1990, both rates fell. This decline continued during the 2000s and 2010s, despite the growing size of the cohort of people of child-bearing age (due to the high fertility rates of the past).
Though Zero Population Growth was not achieved by 2000, nor even 2020, the population growth rate did decline from 1.7% to roughly 1.1%. The birth rate was 8.52 in 2020, and the TFR was 1.28 children per woman.
The decline in birth rate during the 1990s, 2000s, and 2010s is remarkable, because during the same period the number of people of childbearing age was growing. Meanwhile the fertility rate was declining because of the One Child Policy and because of economic development, urbanization, and expanding educational opportunities.
The One Child Policy is worthy of lengthy analysis, but in brief, there were significant costs and benefits. On the cost side, it caused grief on the part of would-be parents having fewer children than desired, especially in the event of premature death of a teenager or young adult who was a couple’s only child; and many aborted, hidden, or abandoned female children. Today there is a high sex ratio, and an Aged Dependency Ratio that is higher for China than for other countries at similar stages of economic development. On the plus side, pressures on the environment, and the challenge of providing housing, education, and health care to China’s initially large and generally impoverished population, were mitigated.

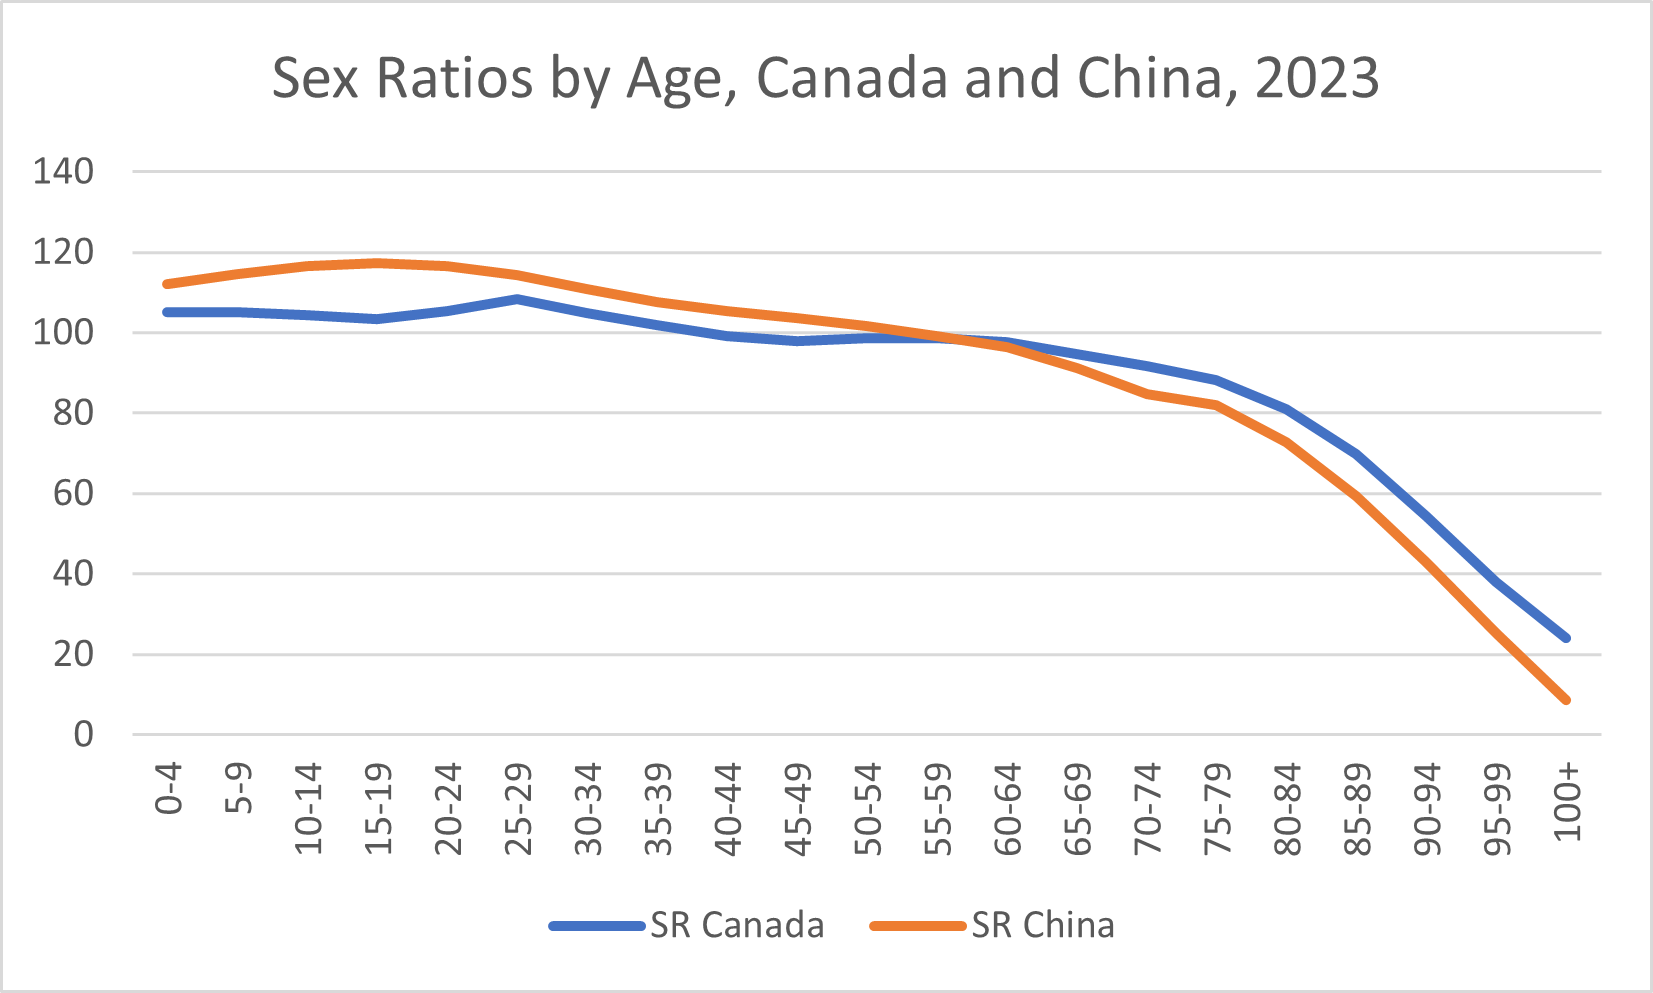
Figure 13-4 compares China’s sex ratio at various ages to Canada’s sex ratio in 2023. At that time, China’s sex ratio at birth was higher than Canada’s and even increased during childhood and adolescence, showing what appears to be current or past son preference. We discuss son preference in Chapter 24. However, likely due to a lower standard of living, the sex ratio fell more steeply with age in China than in Canada. At age 55-59 the sex ratio in both countries was 99 men per 100 women. After age 59, the sex ratio was lower in China than it is in Canada, and the gap between the two countries’ sex ratios widened as the age of the group increased.

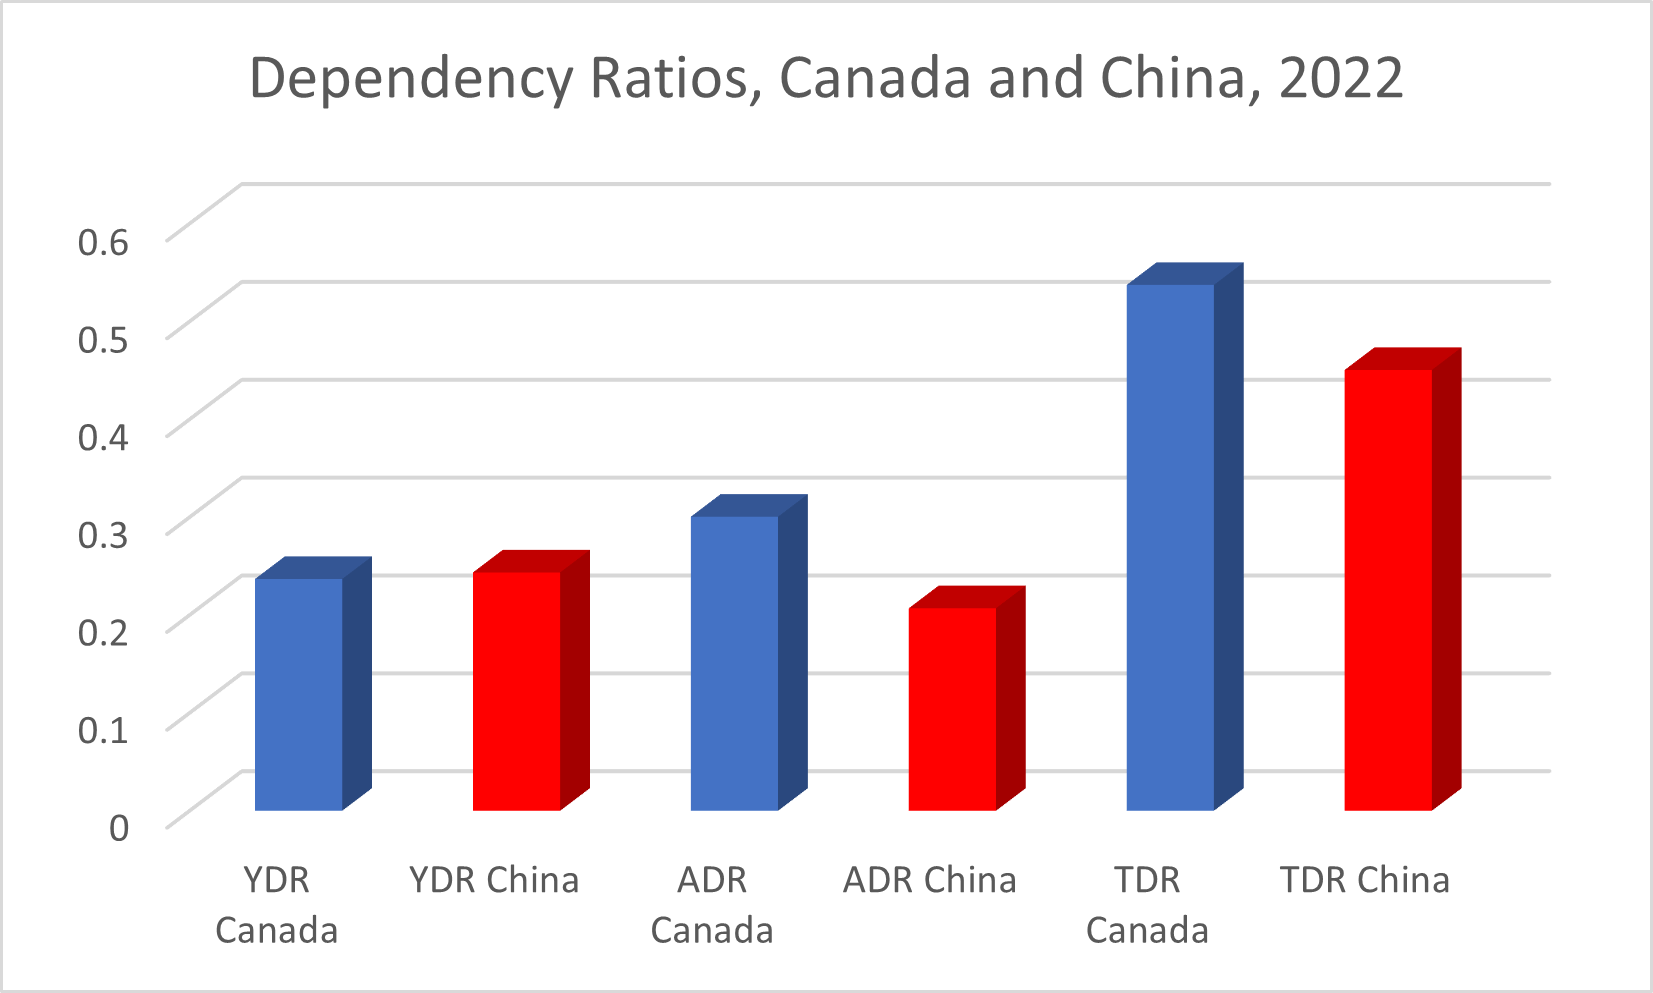
Figure 13-5 shows us Canada’s and China’s Young Dependency Ratio (the number of children compared to the number of people of working age), Aged Dependency Ratio (the number of seniors compared to the number of people of working age), and Total Dependency Ratio (the sum of the Young Dependency Ratio and the Aged Dependency Ratio). Children are defined as being 0-14 years of age; seniors are age 65+.
 We see that, while China may have higher aged dependency compared to other nations with similar GDP per capita, in 2022 China still had lower aged dependency than Canada did. China had a Child Dependency Ratio which was just slightly higher than Canada’s, but with a significantly lower Aged Dependency Ratio, China had a lower Total Dependency Ratio than Canada did.
We discuss aging populations in Chapter 16. Concerned about its aging population, the Chinese government began to loosen the One Child Policy in 2016. By 2021, all married Chinese couples were allowed three children. During 2021, the Chinese population fell for the first time in sixty years, by 850,000 people.
In our next chapter we’ll look at how to forecast population growth or shrinkage.

- The new Student Health Administrator wishes to reduce unplanned fertility among first-year university students. Is this a violation of human rights? Whom should you target? What is the margin? Why is accidental fertility happening? What might be the binding constraint? Suggest a policy to address this constraint.
- Describe the fertility impact of the following on a wealthy, stay-at-home parent with two preschool children: a) increased day care subsidy; b) increased parental leave privileges; c) a monthly allowance from the government for each child; d) new one-time cash payment for a 3rd child; e) improved convenience of online education programs; f) an increase in the average real wage.
- Imagine you are in the Chinese government in the early 1980s, and you want to end discrimination against girl children. Someone suggests giving larger working plots to rural couples who have two daughters. Evaluate this idea using our principles of policy design.
Eugenics is a program of altering the human gene pool by encouraging some kinds of people to have children and some kinds of children to be born, predicated on the belief that genes are the most important thing about a person and that we can understand what the human gene pool needs to become
The Aged Dependency Ratio is the number of people of retirement age divided by the number of people of working-age. The number of people of retirement age is typically taken to be people sixty-five years of age and older.
The Young Dependency Ratio is the number of people too young to work divided by the number of people of working-age. Typically, people too young to work are defined as being less than fifteen years old.
The Total Dependency Ratio is the number of people not of working age divided by the number of people of working age. It is typically calculated as the number of people under fifteen years of age or over sixty-five years of age, divided by the number of people ages 15-64.
