


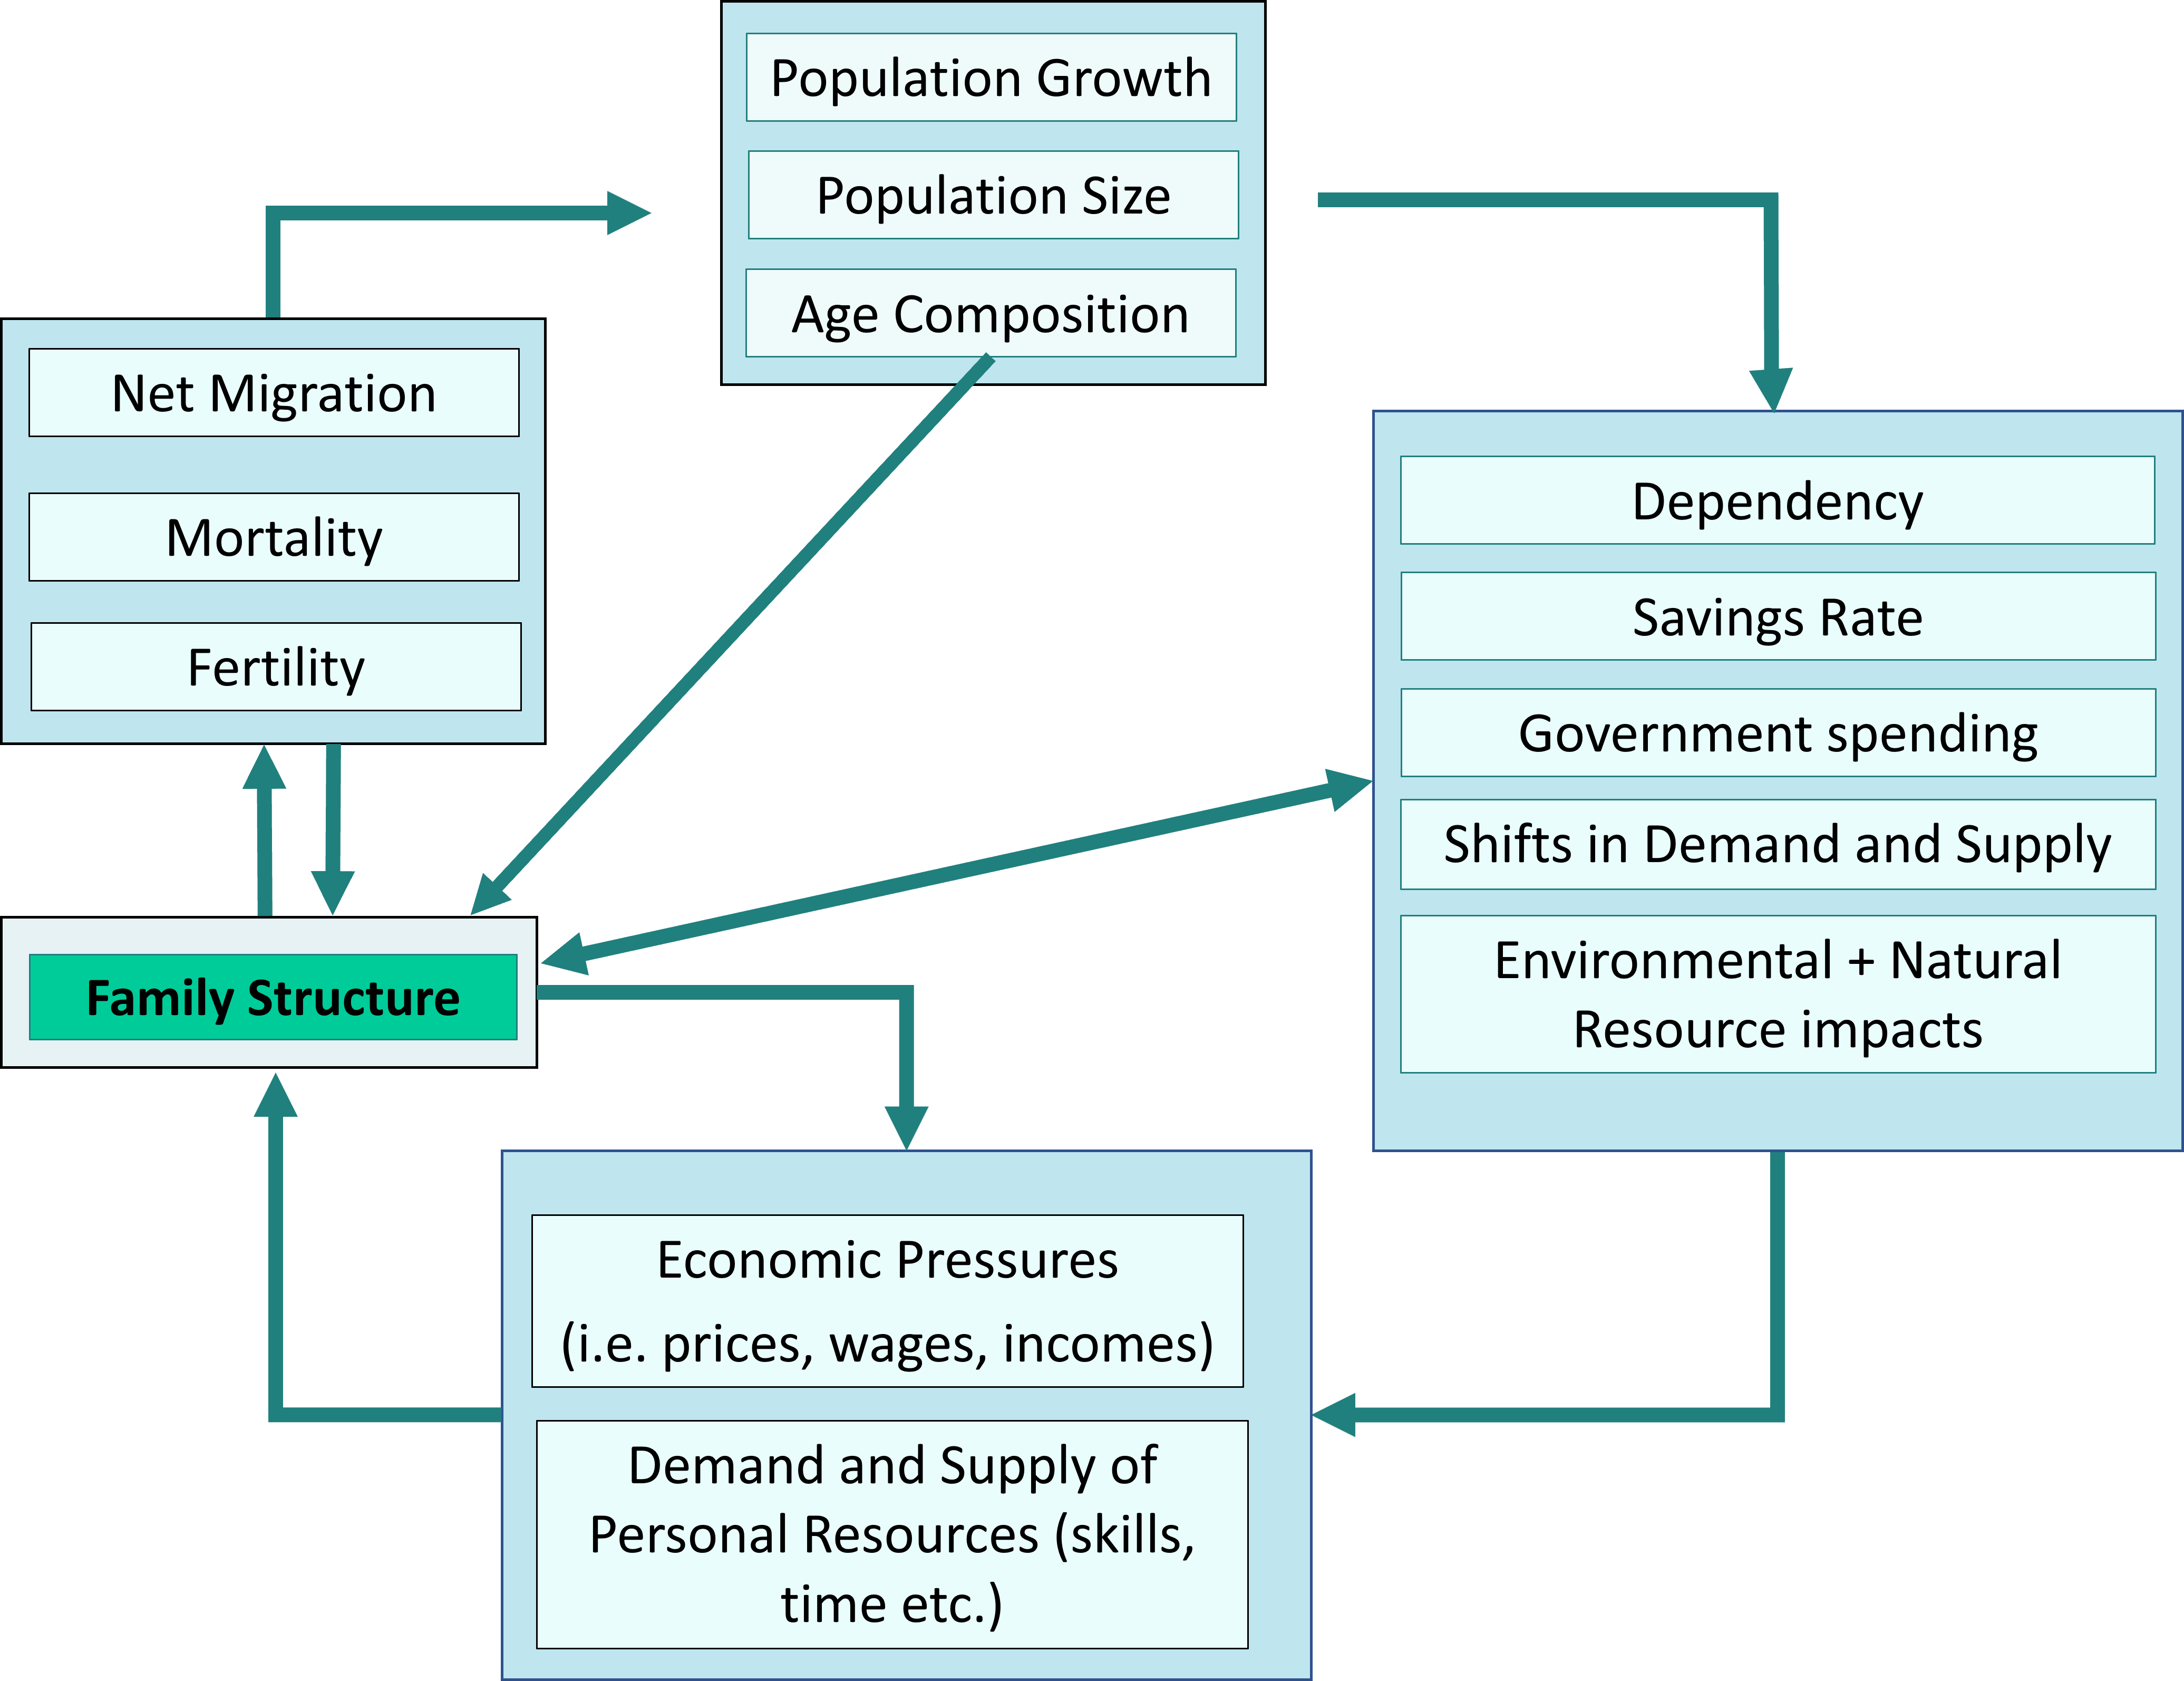
The family is the tiniest multi-person population of interest, the tiniest economy. As illustrated in Figure 23-1, family structure influences and responds to fertility, mortality, and migration. It influences and responds to economic pressures. An integral part of our culture, family structure is a matrix in which economic and demographic pressures play out.
Family structure is affected by many things, including the three population processes (fertility, mortality, and migration), the sex ratio, and economic pressures. In turn, family structure affects the economy. For example, the rate of divorce affects the demand for housing. The rate of divorce also affects savings and labour force participation. It can also affect the completed fertility rate, the migration rate, health, and mortality, thereby affecting the economy indirectly.


Since roughly the 1970s, western societies have increasingly accepted and adopted new family structures. The number of single parent families, step-parent families, blended families, cohabiting adults, and LGBTQ2S+ unions has greatly increased.
This change can be attributed to secularization as well as to activism, publicity, and discussion. There has also been an economic connection: a rising standard of living makes people less dependent on family members’ support and opinion, and a strong social safety net gives them courage to try unconventional things.
The economy can affect family structure more directly. A poor economy may force people to migrate in search of work, which may separate family members or prevent people from getting together. A high cost of living may give couples the incentive to stay together during low moments in their relationship, but it can also be a strain that drives people apart.
As families form or break apart, there may be economic consequences as well as emotional ones. Some innovative family structures provide a strong framework for health and prosperity. Others are weaker and may place family members at greater economic risk. When family structure works well, love, skills and ideas are shared, as well as expenses, care of dependents, and economic risk.
Women in the workforce
In the West, many more women work outside the home than was the case in the first half of the twentieth century, when gender was always perceived as binary, when gender roles were more rigid than they are today, and when more couples worked together on a family farm. Feminist activism, as well as affirmative action, legislation, literature, media, and urbanization have expanded women’s opportunities. The greater participation of women in postsecondary education prepares them to work outside the home, and most expect to do so.
As we learned in Chapter 20, the influx of a large number of new workers into a labour market can depress the wage unless and until improvements in efficiency or capital accumulation expand labour demand.
We have already discussed how an increase in education and in the variety of opportunities available to women tends to decrease fertility. Generally, higher education, and work outside the home, are correlated with fewer children in the family. Women’s work affects not only fertility but also, of course, the economy directly. If time worked in the marketplace is more materially productive than time worked at home or in volunteer positions, there is a net material benefit to society (excluding consideration of fertility and other impacts). Can we assume that time worked outside the home is more productive? Perhaps yes, because women now have the ability to specialize in what they are best at.
Regardless of the material benefit, people identified as female of course appreciate having more choices in life; however, if they are still expected to assume traditional responsibilities in addition to their work outside the home, their lives may become more stressful. More and more, people identified as men are sharing in childcare and housekeeping, but in 2015 for example, Canadian men ages 25-54 spent 1.9 hours per day on unpaid work, while women the same age spent 3.9 hours.[1]
Gary Becker (A Treatise on the Family, 1981) theorized that the material benefits of specialization (wife to childcare, husband to marketplace) helped keep couples together. The blurring of the expected duties of each partner may stress the relationship. Expectations may have to change and traditions be adapted for marriages to thrive.
Increased similarity of couples
With the expanded opportunities, women are likely to have experiences, education, and workplace achievements which are similar to those of their partners. Romantic love and compatibility have become the top criterion for marriage in the West. Couples are taking longer to get to know one another.
Goldin and Katz (2002) believe that the contraceptive pill, which makes it less likely that pre-marital sex will lead to pregnancy, has made longer courtships (with sex) less costly and made it more likely that people who marry are compatible. They demonstrated a statistical relationship between access to the pill and lower marriage rates, higher age at first marriage, and lower divorce. They also demonstrate similar, but weaker, effects from the legalization of abortion.
On the other hand, because of the pill and the availability of abortion, women unwilling to use the pill or have an abortion are facing increased pressure for sex while no longer being able to count on “shot-gun marriages”[2]in the case of a pregnancy. This may explain an increase in out of-wedlock births following the pill and following the legalization of abortion
Couple similarity has consequences for the distribution of income. When only a husband works, and his income is twice as much as his brother’s, the first brother’s household is twice as rich as the second’s. If each brother has a spouse earning an amount similar to his own, then the first household is still twice as rich as the second, but the difference between their incomes is doubled.
Declining prevalence of marriage
A smaller percentage of marriage-aged westerners is married these days, because of people waiting longer to marry, people choosing not to marry, and people divorcing.
1) Age at first marriage has risen. In 1973 the average Canadian bride and groom getting married for the first time were 22.8 and 25.2 years old respectively,[3] but in 2011 they were 29.6 and 31.0 years old.[4] This statistic appears to no longer be tracked. Instead, age of the average person getting married (either for the first time or for a second, third, of greater number of times) is tracked. That rate has risen from a low of 25.6 in 1968 to 35.3 in 2019.[5]. It decreased slightly in 2020, mostly because during the pandemic older people’s marriage rate fell more than did younger people’s.
Economic explanations for a higher age at first marriage include the increased availability of education for women and men, and increased economic opportunities for women. Demographic consequences include delayed fertility and a lower total fertility rate. The rising age of parents may have positive consequence for the viability of marriage and the parents’ ability to take care of the children.
2) Marriage rates have declined. In 1950, eighty percent of Americans ages 21-54 were married. That began to decline in the mid 1960s, and even more steeply during the 70s and 80s. In 1990, sixty-seven percent adults ages 25-54 (now excluding 21-24 year olds) were married, and in 2019, fifty-three percent of that age group were married[6].
We have some Canadian statistics for younger people. In 1996, 50.5 percent of Canadians ages 20-34 were not married or living common-law. 14.3 percent were living common-law and 35.2 percent were married. By 2021, the number of non-married, non-common-law Canadians ages 20-34 was had fallen to 60.3 percent, with the remaining forty percent split almost equally between married and common-law.[7].
Economic factors which have contributed to declining marriage rates include an increase in the standard of living which makes single living more affordable, and increased earnings opportunities for women outside the home, which also makes single living more affordable.
3) Divorce has become common. We discuss divorce in detail below.
More singles
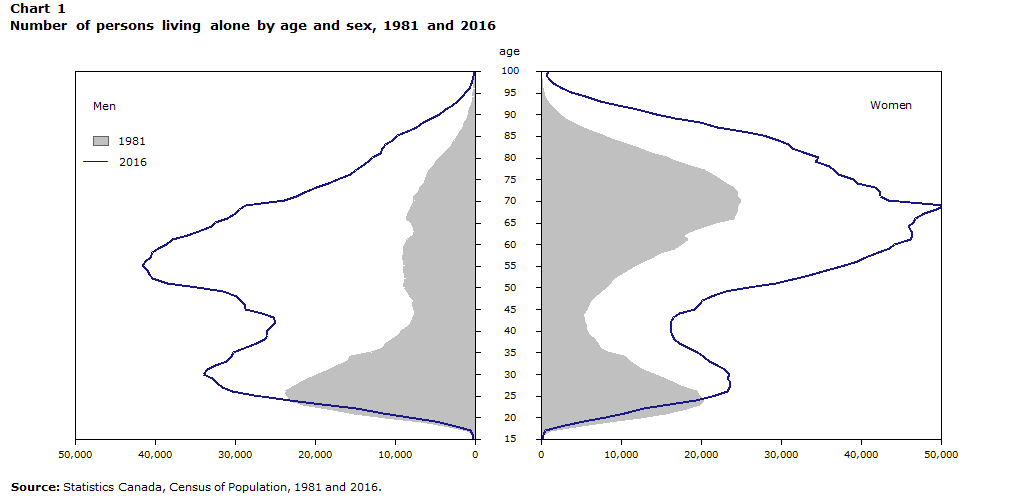
A greater fraction of people ages 20-34 and older are not marrying or cohabiting but remaining single. They may choose to live with roommates, friends, or family members, or they may choose to live alone. The chart below illustrates an increase in the number of people living alone at the time of the 2016 census compared to the time of the 1981 census, and the change in the age and sex composition of those people. The increase is large, but the chart exaggerates it by not accounting for the fact that the overall population grew about forty percent between 1981 and 2016.
Whereas in 1981 a large fraction of people living alone were widowed women in their 60s and 70s, in 2016 there were many people, both men and women, living alone in their 50s and 60s due to separation or divorce.

The single life can be satisfying and productive. It is not as likely to produce children, however, so expect a drop in fertility when the rate of singlehood increases.
There are health consequences for single people, who typically must be economically self-sufficient and responsible for their own health. Married men live longer than unmarried men (for example see Lillard and Panis, 1996). This is likely because of protection conferred by not living alone, and because men who get married have characteristics that make them more likely to live healthy lives. Is it also because men who get married are healthier than men who do not? Lillard and Panis (1996) found that that is not the case: unhealthy American men marry earlier than their peers, are less likely to divorce, and are more likely to remarry after being widowed or divorced.
Married women are also healthier than single, divorced, or widowed women – but only if they report a happy marriage. (Gallo et al. 2003).
In terms of GDP per capita, single people look good for the economy. They work and can save without the diversion of childcare. They are available as community volunteers and activists, as well as supportive relatives. On the other hand, having children may motivate greater work effort. The support of a spouse often contributes to a person’s career.
Cohabitation
The phenomenon of men and women living together without being married was relatively rare in the West before 1970, but cohabitation has grown in popularity steadily since then, as you can see in Figure 23-4 below. This Figure does not include single people.

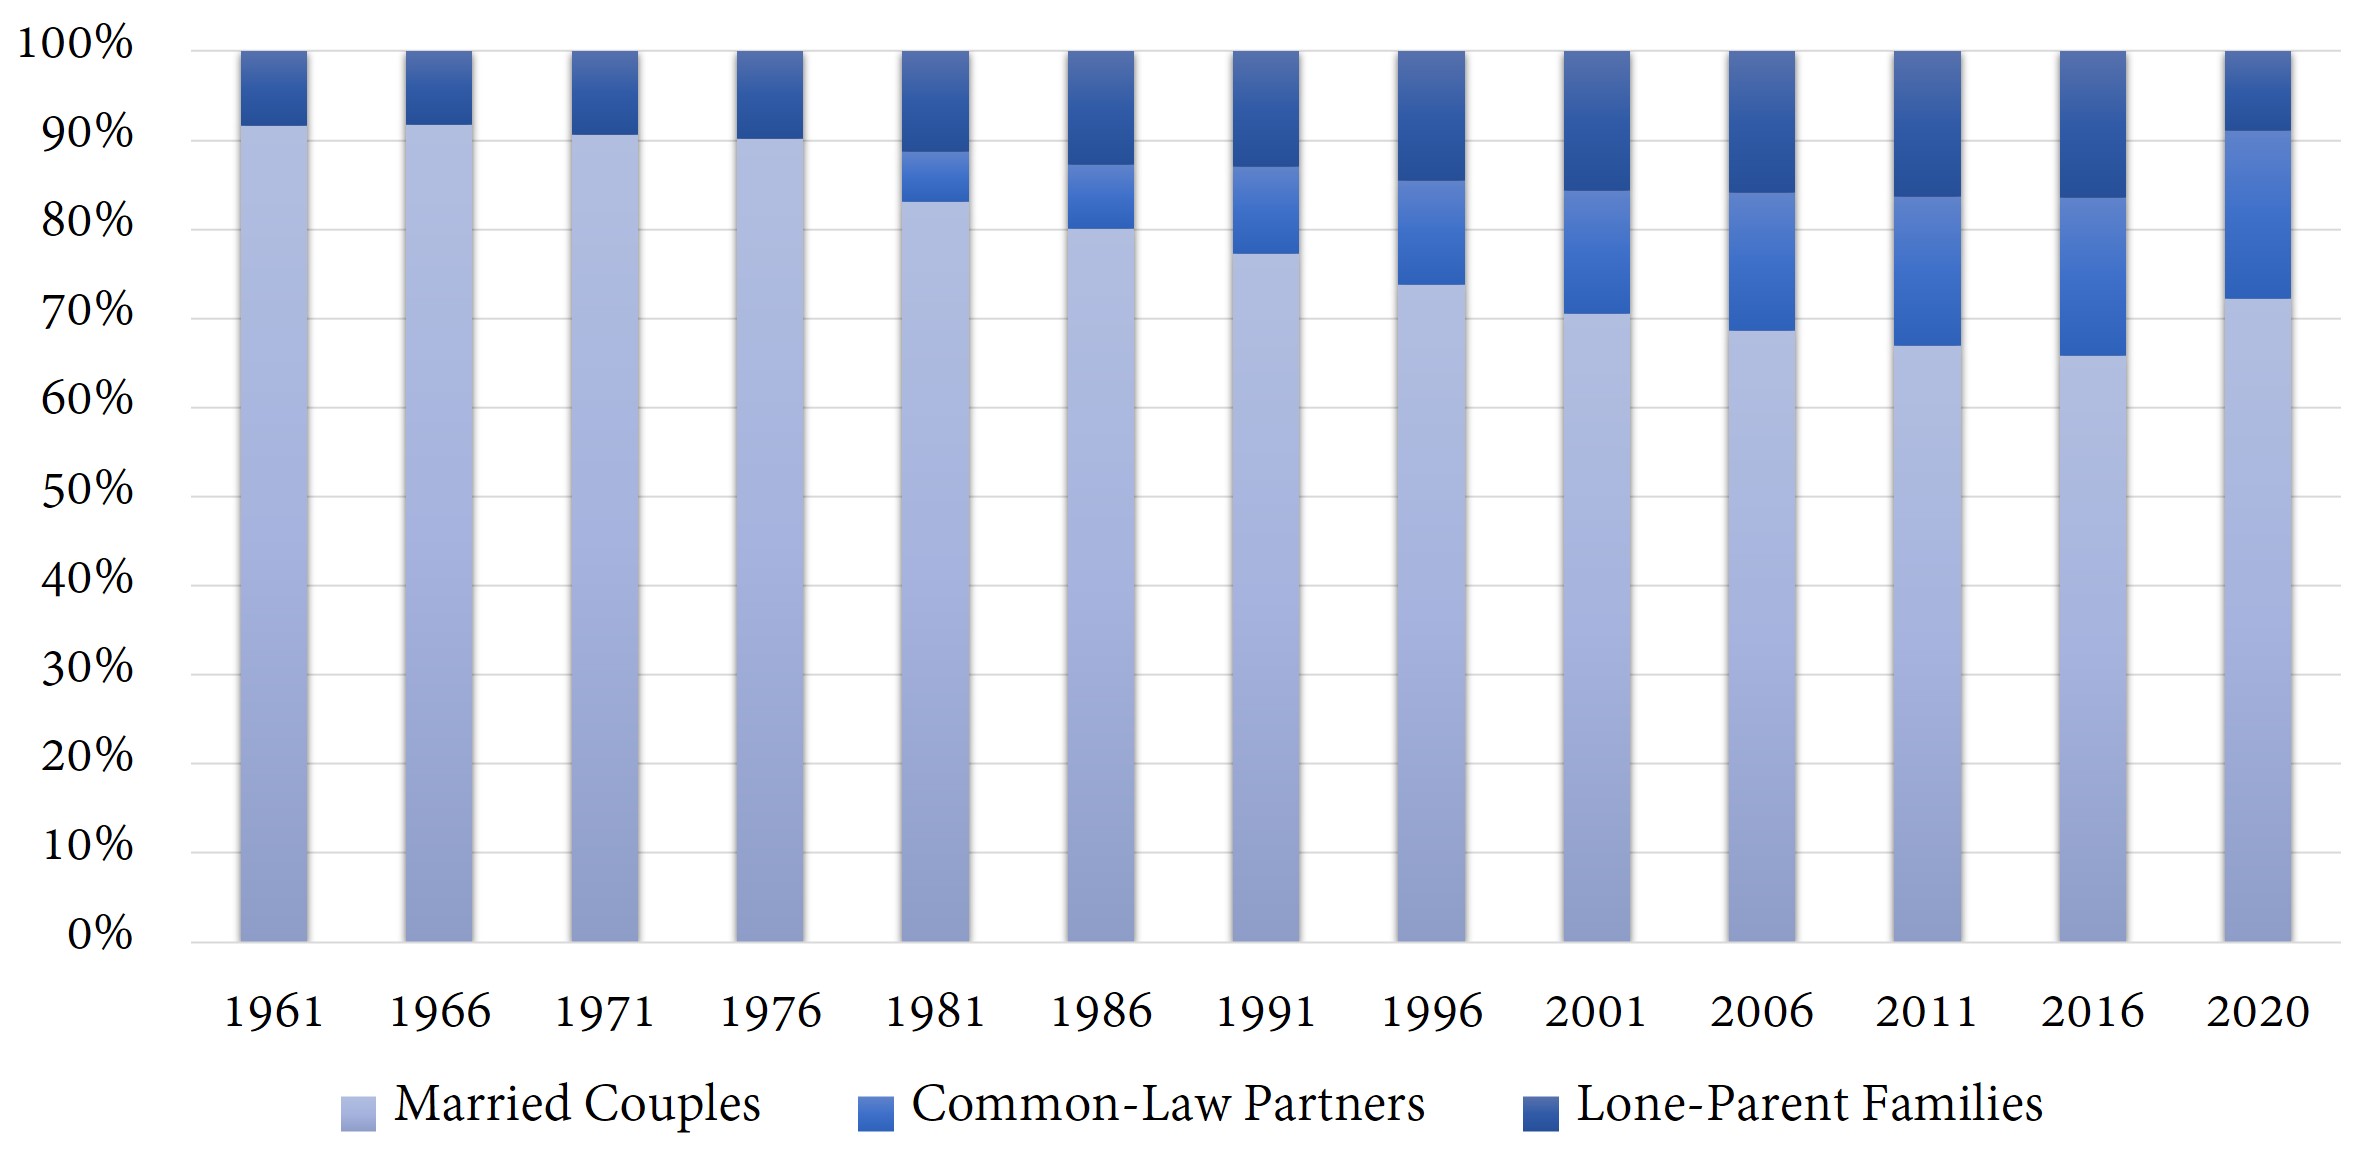
In some times and places, cohabitation offers financial advantages over marriage, for example being able to file income taxes independently, or being able to receive more in welfare payments. In contrast, cohabitation may mean less entitlement to pension benefits (if a partner dies) or financial settlement (if the relationship breaks up.)
Cohabitating or “common-law” couples are more likely to break up than married couples. It has also been noted that couples who cohabit prior to marriage have a higher rate of divorce. See for example Rosenfeld and Roesler (2018). This conflicts with the findings of Goldin and Katz (2002) noted above. We will discuss the economic consequences of divorce below.
Economic factors which contribute to cohabitation include the emotional and financial cost of divorce, which have become well-known and which discourage people from marrying.
Divorce has become common
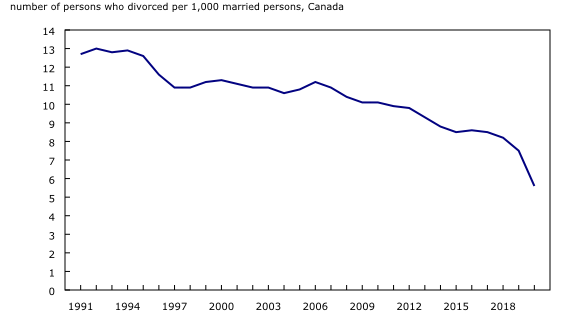
In the United States, the divorce rate’s overall trend since the late nineteenth century has been upward. The divorce rate increased rapidly 1960-1981, but has fallen somewhat since then. Canada’s divorce laws were liberalized in the late 1960s (no-fault divorce) and then again in the mid 1980s (only one year, not three years of separation required), and Figure 23-5 shows the surges in divorce that followed. Figure 23-5 shows only numbers, not rates, however. The refined divorce rate (to be explained later) has been falling since 1991. This is attributed not only to the rising age of married persons but also to a decreasing likelihood of younger people to divorce.[8].

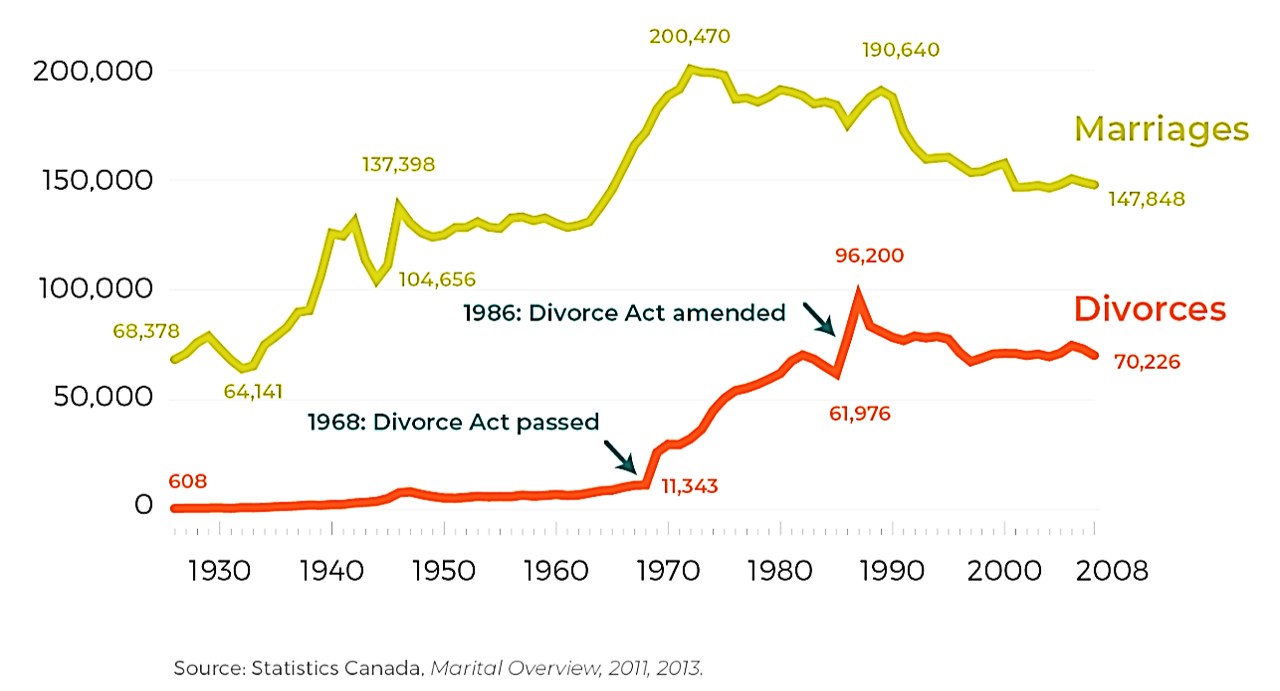
Up-to-date marriage and divorce data have proven difficult to obtain since Statistics Canada stopped processing provincial marriage and divorce data in 2008, citing costs and the tangled web of cohabitation and remarriage.
The median length of marriage for Canadian marriages eventually ending in divorce was roughly 11 years between 1986 and 1996[9], about 12 years in 2010, and over 15 years in 2020[10]. It would be interesting to learn if immigrants divorce at lower rates, and if so, how much that has affected divorce statistics.
Non-economic factors contributing to divorce include secularization, more liberal divorce laws, higher expectations for couple-compatibility, unclear expectations about gender roles, and higher expectations for self-fulfillment. Economic factors contributing to divorce include an increase in the average woman’s post-divorce standard of living and the declining cost of arranging a divorce. Economic consequences of divorce include increased demand for housing, a reduced standard of living for spouses and children, stresses on children, and stresses on parents. Separation of children from one of the parents when that parent does not have custody can be painful for parent and child.
In 2021, the Canadian Health Survey on Children and Youth estimated that just under twenty percent of Canadians who were born after 2001 had experienced experienced parental separation or divorce before reaching the age of eighteen[11].
Many studies have demonstrated adverse effects of divorce on children’ education, health, and behaviour, but more work is being done to distinguish between low-distress and high-distress marriage and differing divorce experiences. Adverse effects may be due to unobserved differences, such as mental health of parents, which affect both the likelihood of divorce and outcomes for children. Unfortunately, any adverse effects of divorce on children may compound existing disadvantages when divorce is more likely for parents with lower levels of parental educational achievement, as it seems to be in the United States (e.g. Cohen (2019)).

Like the crude birth rate and crude death rate, the crude marriage rate is the number of marriages per year, divided by the midyear population, and expressed as a number per 1000. The crude divorce rate could be computed the same way.
These rates, however, do not tell us much. The mid-year population includes people who are already married, people who are divorced or widowed, and children too young to marry. Depending on the age structure of the population, the marriage or divorce rate may be very high when it appears to be low.
A better marriage measure would be a refined marriage rate, which is the number of marriages that year per 1,000 single, widowed, or divorced women (or men) at mid-year. The refined divorce rate is the number of divorces that year per 1,000 married women (or men) at mid-year, as documented in Figure 23-6 below.

Another useful rate is the first marriage rate of 21-25 year olds, that is, the number of marriages of 21-25 year olds who are getting married for the first time, divided by the number of 21-25 year olds at mid-year. We can compute other age-specific first marriage rates as well.
We can do age-specific divorce rates as well, but it makes more sense to use the age (i.e. length) of the marriage rather than the age of the people involved.
The age-of-marriage specific divorce rates are called duration-specific divorce rates, DSDR.

The mid-year population of people married n years ago depends on the number of people who married n years ago, and also on how many of them are still alive.
Summing up DSRD for marriages of all different durations, we get the Total Divorce Rate (TDR), not to be confused with the Total Dependency Ratio. Like Life Expectancy and the Total Fertility Rate, the Total Divorce Rate is hypothetical. 
where the summation is usually over marriages lasting between 1 and 30 years.
The total divorce rate is the percentage of marriages that would end in divorce if today’s duration-specific divorce rates remained the same throughout a couple’s life. It is technically possible for the TDR to be greater than 1, so interpret the TDR with caution.
In 2019, before the pandemic, the TDR over marriages lasting between 1 and 50 years was 369.4 per 1000 marriages, down from 421.5 in 2000.[12]
So far we have focused on adults and the rates at which they get together and stay together. There is definitely more to be said about the economic and demographic consequences of family structure, but we cannot cover it all in this textbook. In our next chapter, we’ll look at the preference for sons that sometimes exists in families.

- In Country A, the marriage rate is 10 per 1000, while the divorce rate is 5 per 1000. Can we conclude that 50% of marriages end in divorce? Why or why not?
- In Canada today, fewer households include grandparents. What are some possible economic reasons for this, and what are the possible economic repercussions?
- https://www150.statcan.gc.ca/n1/pub/89-503-x/2015001/article/54931-eng.htm ↵
- "shot-gun marriages" are marriages arranged in haste when a woman becomes pregnant. The metaphor refers to a woman's father holding a shotgun to the woman's boyfriend to compel him to marry her. ↵
- https://www150.statcan.gc.ca/n1/pub/91-209-x/2013001/article/11788-eng.htm ↵
- https://www.cardus.ca/research/family/reports/the-canadian-marriage-map/ ↵
- Statistics Canada (November 2022) ↵
- Pew Research Center (2021) ↵
- Cardus Associated Authors (2022) ↵
- Statistics Canada (March 2022) ↵
- Statistics Canada, Number of Divorces and Divorce Indicators, Table 39-10-0051-01 released November 14, 2022. ↵
- Statistics Canada (March 2022) ↵
- Statistics Canada (Sept. 2021) ↵
- Table 39-10-0051-01 in "Number of divorces and divorce indicators in Canada," Statistics Canada, November 14, 2022. ↵
Cohabitation refers to adults living together in a sexual relationship without being legally married.
