Answer Key

1. The fact that the wage is three times as high as the price of bread means only that, for this community at this point in time, an hour of work trades for 3 loaves of bread.
2. Value-in-trade is the market price. It is determined by the intersection of the supply curve and the demand curve. The supply curve shows the marginal cost of production in that market at that time. The demand curve shows the marginal willingness to pay in that market at that time.
3. The legal system benefits society by protecting the rights of citizens. The marketplace benefits society by giving citizens the opportunity to trade material goods and services. The legal system declares and enforces; the marketplace suggests and negotiates. The legal system enshrines freedom but cannot meet your material needs except by forcing someone to provide for you. The marketplace gives you a way to meet your material needs but cannot prevent inequality or exploitation.
4. An equilibrium is a condition to which the economy or population will always revert.
5. Many answers are possible. For example, a rich nation is better able to wage and win war. Having won the war, the nation gains access to new resources and becomes wealthier. And so on, with the nation becoming ev ery wealthier. Of course in reality things do not always go so smoothly.
6. Many answers are possible. Sleep deprivation reduces attention in class. Because of poor retention of lectures, a student must study further into the night, and so the sleep deprivation continues or worsens.

1. a) when FPP > FPP*, BR>DR. Population grows and FPP drops back to FPP*.
b) when FPP<FPP*, BR<DR. Population shrinks and FPP grows back to FPP*.
c) when births drop across the board, the rate of population growth at the original FPP* is now negative. Population shrinks until a new equilibrium is achieved at a higher level of FPP. This new, higher FPP* is the level that is compatible with zero population growth now that birth rates have fallen.
d) when deaths drop across the board, the rate of population growth at the original FPP* is now positive. Population grows until a new equilibrium is achieved at a lower level of FPP. This new, lower FPP* is compatible with zero population growth now that death rates have fallen.
2. The answer is (d).
3. a) technological innovation was infrequent. The overall pace of technological change was slow.
b) as in (a), productivity was low. Productivity gains were sporadic.
c) population growth was low, at about 1/20th of one percent if taken as growing exponentially at a constant rate.
d) mortality was high compared to today.
e) fertility was high compared to today, but not as high as total fecundity.
f) the standard of living was low, and for most societies it was so low as to leave them vulnerable to extreme weather and other shocks.

- The rate of population growth is 100 x (105,000-100,000)/100,000 = 5.00 %
- The rate of population growth is 100 x (100,000-105,000)/105,000 = -4.76%
- The rate of population growth is 100 x (80,352-75,798)/75,798 = 6.01%
- The rate of population growth is 100 x (75,798-80,352)/80352 = -5.67%
5a) If the population on July 1, 2012 was 34,880,491 people, and the population on June 30, 2013 was 35,284,483 people, then the population grew by 403,992 people between those two dates.
b) The population growth rate was 100 x 403,992/34,880,491 = 1.16 per cent
c) The mid-year population was 34,880,491 + 403,992/2 = 35,082,487, assuming arithmetic population growth during the year.
d) If there were 383,822 births between July 1, 2012 and June 30, 2013, then the birth rate was 1000 x 383,822/35,082,487 = 10.94 births per 1000.
e) If there were 253,241 deaths over the same period, then the death rate was 1000 x 253,241/35,082,487 = 7.22 deaths per 1000 people.
f) Natural increase = births minus deaths = 130,581
g) The rate of natural increase = the birth rate – the death rate = 10.94-7.22 = 3.72 per 1000
h) If immigration was 312,288, then, using the fundamental equation of population growth, emigration must have been 38,877. Steps:
Population growth = natural increase plus net migration
Population growth = natural increase plus immigration – emigration
Natural increase plus immigration – population growth = emigration
Emigration = 130,581 + 312,288 – 403,992 = 38,877
i) Net migration = immigration – emigration = 312,288 – 38,877 = 273,411
j) The net migration rate = 1000 x net migration/mid-year population = 7.79 per 1000
Note that net migration was 2.09 x higher than natural increase: 273,411/130,581 = 2.09 We call 2.09 the “migration ratio”
Thus net migration contributed twice as much to population change as did natural increase during the period July 1, 2012 to June 30, 2013.

1a) The mortality rate for people under age 30 is 20 per 1000 in Waitku. The mortality rate for people over 30 is 4 in K.U. and 5 in Waitku.
b) The crude death rate for K.U. = 225/60,000 x 1000 = 3.75 deaths per 1000. The crude death rate for Waitku = 60/6,000 x 1000 = 10 deaths per 1000.
The standardized death rates using K.U. as the standard country:
For K.U. , standardized death rate = 3.75, same as its crude rate. The standardized rate for Waitku = (20/1000 *5000 + 5/1000 * 55,000) = 100 + 275 = 375 deaths out of 60,000 people = 6.25 per 1000.
c) After standardization, Waitku looks better than it did before. Its overall death rate is still higher than KU’s, but it is not relatively as high once its mortality rates are applied to a population with a lower proportion of young people such as KU’s. This is because Waitku has a very high death rate for young people.
2. If the flu season kills more 20-24 year old men than women, and the sex ratio is currently 1, the sex ratio for 20-24 year olds will fall below 1.
3. Ignoring medical and other advances, a nation’s crude death rate will rise as the population gets older, inasmuch as older people are subject to higher mortality rates. We could adjust for this effect by standardizing the entire time series using the population structure of particular year, or by using the average population structure over the timespan.
4. The population 10 years ago must have been 53,460e-0.02(10) = 43,769.
5. Using the Rule of 70, it will take roughly 35 years for the population to double. 70/2=35
6. 7 * e r*13 = 8
e r*13 = 8/7
13r = ln(8/7)
13r = 0.133531
r=0.010272
7. For geometric rate solve:
500 = 100 *(1+r)80 thus r = 51/80 – 1 = 0.02
For exponential rate solve:
500 = 100 e80 r thus r = ln(5)/80 = 0.02
For arithmetic rate solve 400/180 = 5 people per year.
8.
Here is one way to create the expression and obtain the answer:
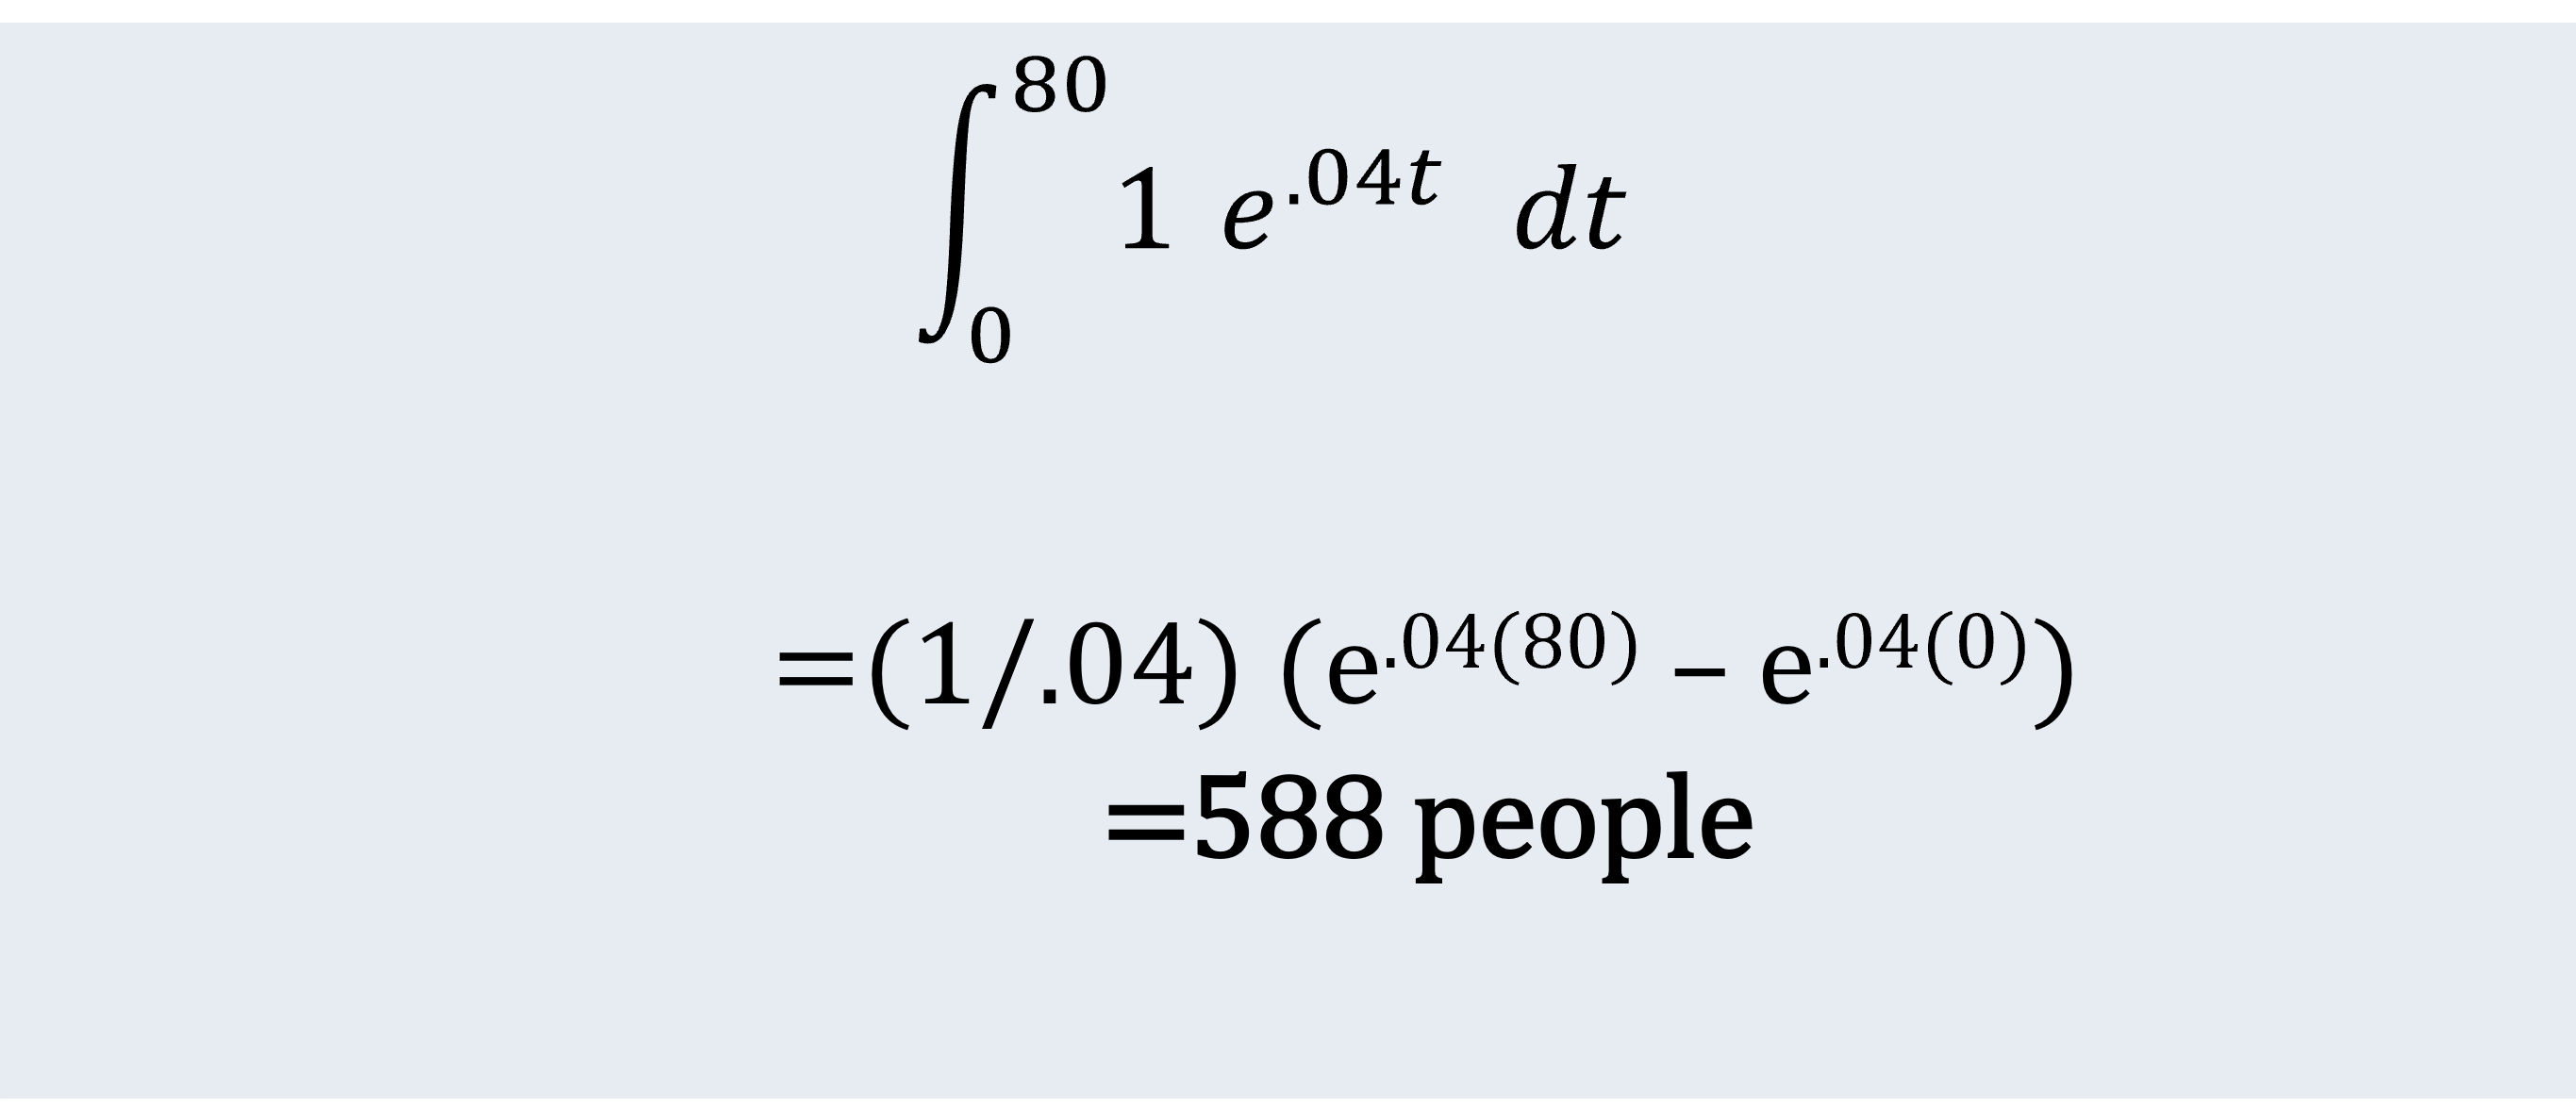
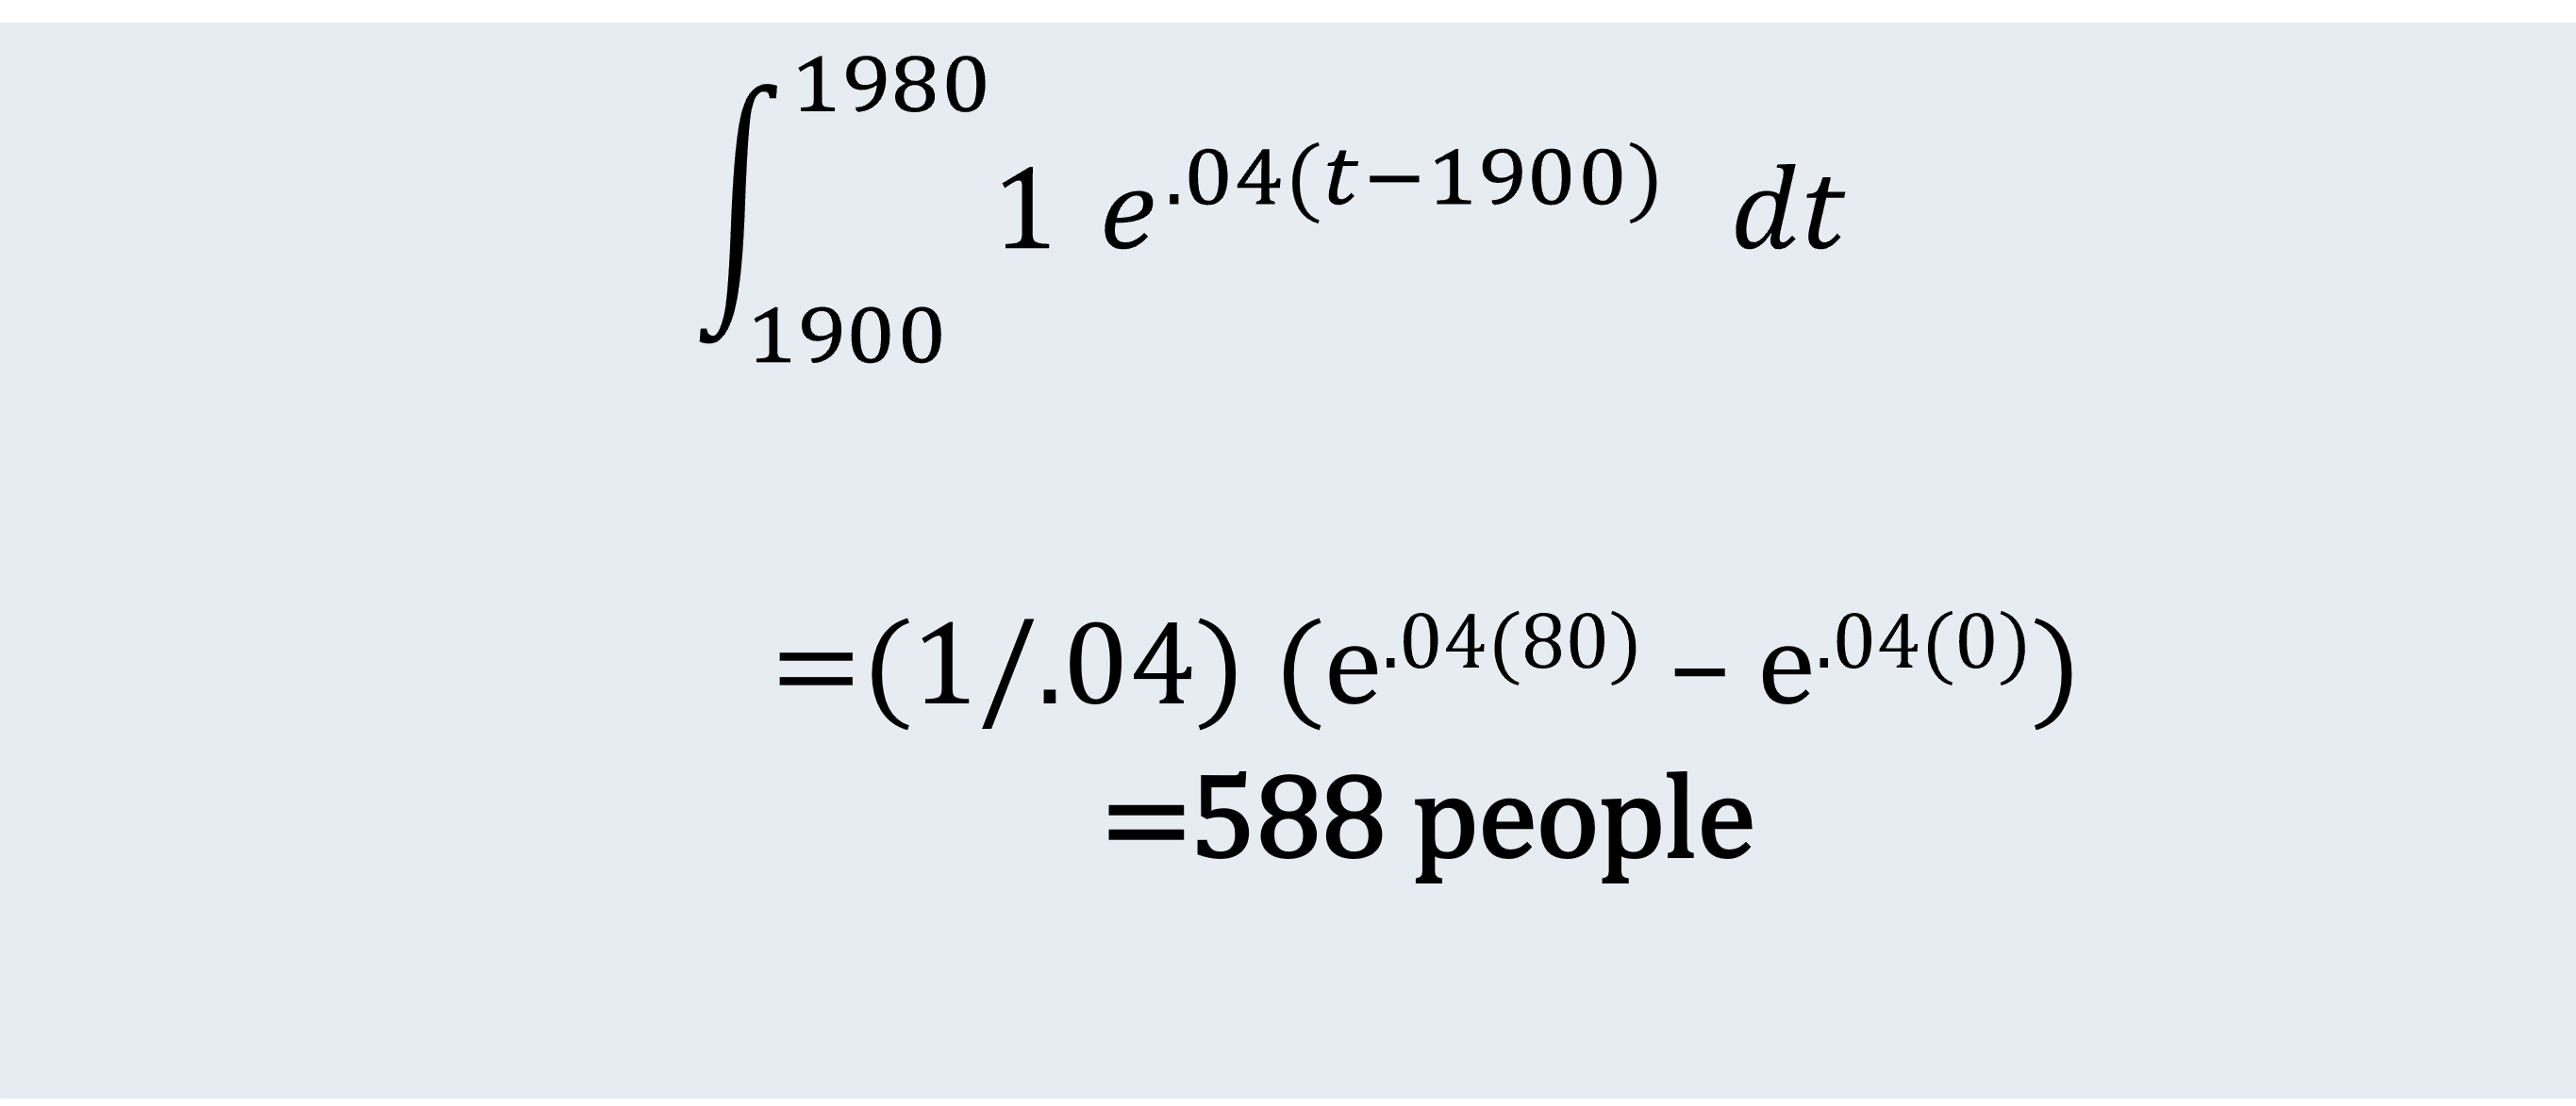
And here is another way:

1a) According to Table 6-1, the life years remaining for the average Canadian woman born in 2019 will be 35.5 years once she reaches age 50.
1b) In 2069, when and if a Canadian woman born in 2019 reaches age 50, she may or may not have 35.5 life years remaining. If she is average, and if mortality rates have not changed since 2019, then yes, she will have 35.5 life years remaining. If, however, there have been advances or declines in the standard of living, in medical technology, or in anything else affecting mortality, then the average Canadian woman will not have that originally-predicted 35.5 life years remaining.
2a)

b) If gerbils die at a greater rate at the beginning of the year, use 0.9 as the fraction in your L calculation, indicating that the average gerbil which dies misses 90% of a year of life. This means there will be fewer life years lived by the members of that age group. The life years remaining for the average newborn will decrease. The expected life years remaining for older age groups will not change.

- The probability that a newborn girl in Afghanistan in 2019 lives until at least age 20 is, according to Table 7-1, 93.4%. We get this by dividing the 93,443 women expected to be alive at age 20 by the 100,000 newborns
- The probability that an Afghan girl who has just reached one year of age lives until at least age 20 is, according to Table 7-1, 97.6 %. We get this by dividing the 93,443 women expected to be alive at age 20 by the 95,722 girls turning one year old.
- Comparing our answers above, we see that a one year old has a better chance of turning 20 than a newborn does. This is not a paradox. The closer you are to an age, the more likely it is that you will reach it. There is a paradox in Table 7-1, however: the average one-year-old has more years of life left than the average newborn, even though the average one-year-old has used up a year of life already. This is because so many newborns die: the child that makes it to age 1 is very much stronger than the average newborn and is part of a cohort that has shrunk significantly in number.
- First Step: the expected sex ratio at age 25 is (105*0.97000)/*(100*0.98500) = 1.034 Let 105 be the number of newborn males and 100 the number of females. Actual numbers don’t matter since we are only interested in the ratio. .97000 and .98500 are the survival probabilities for men and women, respectively, from birth to age 25.Second Step: the expected number of men at age 25 is the sex ratio (males/females) multiplied by the actual number of females. That’s 1.034 X 1.5 million = 1.551 million menThird Step: there are actually 1.2 million men so that means 1.551 million men expected in Alametra – 1.2 million men actually residing in Alametra = 0.351 million men missing from Alametra.These men might have died in conflict: is Alametra involved in a war not affecting its women and girls much, a war mostly fought in another country? Is there discrimination against boys or young men? Another possibility is that many men have migrated to work abroad.
- The sex ratio at 15 ought to be 0.94 (1.05)/ 0.95 = 1.03895. Given that there are 30,000 males aged 15, there ought to be 30,000/1.03895 = 28,875 females. Since there are only 28,275 females, 600 females are missing.

1) Other things being equal, the poorer nation will have a higher rate of chronic death than the rich nation. Its population is weaker and less able to resist epidemics. Timely vaccinations and treatment will not be available. It is likely that more people per 1000 will die of the new flu in the poorer nation. The poorer nation has more crisis deaths per 1000 people.
There is the possibility that the poorer nation might be less susceptible to the pandemic, perhaps because it exists in a warmer climate or its people spend more time outdoors.
b) Fogel’s research showed that, in England and western Europe, crisis deaths were only ever a small fraction of overall deaths, even before modern medicine. A wealthy nation has far fewer crisis deaths per 1000 than a poorer nation; however, its chronic deaths per 1000 are also far fewer. The answer is uncertain. Crises are less devastating and make up a smaller proportion of total deaths as a nation develops. So it’s likely that the poorer nation will have more crisis deaths, even as a proportion of its chronic deaths, than the wealthier nation.

1a) One answer is that, during recession, parents may be unemployed or working less overtime. Parents also have less money for diversions. They therefore have more time to spend with their newborns, monitoring their welfare first-hand.
1b) People who have children during recessions may be more employable than those who give birth during boom times. During boom times they are busy with their careers, but during recessions they finally have time to build a family. People who are more employable are usually better educated, better organized, and wealthier, thus better able to care for newborns. Admittedly this is a massive generalization.
2. The Age of Pestilence and Famine is characterized by high mortality rates. In particular, infant mortality rates are high, and the paradox of the life table is observed. Female mortality rates are higher than male rates for women in their reproductive years. Life expectancy is very low, between 20 and 40 years of age. The society is likely to be resource-based. Technology is primitive, and technical progress is sporadic.
3. The end of the Age of Pestilence and Famine is marked by breakthroughs in disease control due to sanitation, vaccination, other medical discoveries, and a rising standard of living.
4. Medical breakthroughs are not enough to usher in the Age of Manmade and Degenerative Disease a.k.a the Age of Delayed Aging. The overall standard of living must be high enough to banish all malnutrition and significantly manage chronic disease. (Aside: This is likely when a society is organized well enough to produce its own medical innovations, rather than having to import all of them form other societies.)
5. Case and Deaton (2015) noted increasing rates of mortality from substance abuse and suicide among middle-aged American Whites. Elizabeth Arias et al. (2021) found increasing rates of mortality from substance abuse during the pandemic for both Whites and nonWhites (all ages), but decreasing rates of suicide. Both studies showed an uptick in diabetes-related death rates and a decrease in cancer-related death rates.
Arias et al. found that the greatest change to overall mortality came from covid-19 death rates. Covid-19 deaths were more prevalent among Black and Hispanic Americans. Thus the relative life expectancy reduction for Whites noted by Case and Deaton was reversed.

1. In order to reduce mortality rates, the Canadian government decides to send Canadians a rebate of $50 per bicycle purchased.
This subsidy does not discriminate between different brands and models of bicycles. There are many kinds of bikes and many manufacturers around the world. Assuming therefore that the supply of bicycles is quite elastic, consumers should be able to capture most of this subsidy. That is to say, they should be able to get at least thirty dollars or forty dollar off the usual price of a bike at least. But if there are supply chain issues, the increased demand will cause bike prices to be bid up substantially.
In any event, bicycle sellers may be able to take advantage of the moment to capture part of the subsidy by raising bicycle prices, especially if they decide not to not compete with one another on price.
The policy is pretty well targeted because exercise will reduce mortality rates unless mortality from bicycle accidents is going to go up by even more; however, there are many reasons that people are not riding bicycles, and the price of a bike may not be the binding constraint. In fact, many poor and homeless people seem to be able to acquire bicycles. To get more of the population to use bikes, it may be more effect to increase the number of bike lanes, improve the condition of roads in winter, and discourage automobile use.
Further, once people have a bike, they may not actually use it. The policy does not encourage use on a daily basis.
2. Under what conditions will heightened COVID-19 safety protocols increase the price of food at burger chain restaurants?
Most restaurants aspire to be unique and to have a following of loyal customers. If they succeed in this kind of “monopolistic competition”, we can’t use the supply and demand diagram to model what happens. But burger chains do appear to compete vigorously with one another, so we might use supply and demand for hamburgers without going too far astray from reality.
The question is whether demand for fast food hamburgers and associated items (fries, shakes) is more or less inelastic than supply.
During the pandemic, supply could be quite inelastic because of the difficulty of getting staff to show up for work. Even before COVID-19, there were some labour supply problems, with Canada’s Temporary Foreign Worker program being used by some managers.
Demand may be quite inelastic as well. Some people make fast food hamburgers and related items a staple of their diet. They may not feel as though there are many attractive substitute foods available.
If demand is more rigid than supply, firms will be able to pass most of the safety costs on to consumers by raising the price of their meals. But if not, firms will absorb most of the safety costs in order to retain customers.

- a) The crude birth rate is 10.58 or 10.6 per 1000. =1000* 10,580/1,000,000.
- b) The general fertility rate is 89.66 or 89.7 per 1000. = 1000 * 10,580/118,000.
- c) To get the total fertility rate, we need the age-specific fertility rates, computed below. Divide by 1000 and multiply by the number of years in the age group, then add all age groups to get the total fertility rate: 3.36 children per woman.
| Age Group | Age-Specific Fertility Rate (per 1000) | Calculations for TFR |
| 15-24 | 42.667 | 0.426 |
| 25-34 | 107.143 | 1.071 |
| 35-44 | 171.875 | 1.719 |
| 45-49 | 28.571 | 0.143 |
| Total = 3.36 children per woman |
d) To calculate the completed fertility rate for women aged 50, we would perform the same calculation as we did for TFR, but we would use the age-specific fertility rate applicable at the time. So, for the years when our 50 year old was 25-34, we would use the age-specific fertility rate for 25-34 year olds that existed at that time, not the ASFR for today’s 25-34 year olds.
e) Assuming that the sex ratio at birth is 1.05 for all ages of mother, the proportion newborns that are female is 100/205 or 0.487805. Multiply this number by the TFR to get a Gross Reproduction Rate of 1.64 female children per woman.
- TFR was similar in 2001 and 2004, but in 2001, the average age of a mother was increasing more rapidly than in 2004. This means that 2001’s tempo-adjusted TFR is going to be higher than 2004’s adjusted TFR. Indeed, 2001’s tempo-adjusted TFR is 2.46 compared to 1.79 in 2004.

1. Poverty could limit opportunity to procreate by forcing men to migrate in search of employment. Poverty could limit the ability to procreate if women are too malnourished and overworked to carry an infant to term. Poverty could encourage couples to have children if there is no other way for them to survive in old age than to rely on children.
2. A fertility trap occurs when a person who has delayed having children finds themselves unable to have their intended number of children. This may be because of aging, break-up of a partnership, career, or other factors. At the level of society, an era in which small families are the norm may lead to changes in social norms, institutional arrangements, and the mix of goods and services that are available that will discourage fertility despite the government wanting to encourage fertility.
3. Secularization usually means that men and women are allowed to mingle more freely, increasing opportunities for procreation. Secularization usually means that the idea of limiting family size becomes more acceptable. Secularization also encourages a focus on self-realization which may be at odds with caring for children. Finally, secularization makes it more likely that various forms of birth control are more accessible, and that people have received sex education.
4. Higher income people could have fewer children without children being “inferior goods” if children are part of a “childrearing” package as Willis described. In this configuration, childrearing is a normal good, but parents prefer to spend more per child than have more children. Another explanation is that, in poor areas, children may confer some material benefits which wealthier people do not need to consider. Also, in poorer areas, children are less likely to survive to adulthood, so desired fertility is higher.
5. In the context of demand theory, with children providing non-material benefits to parents, if there is a parent that is not interested in spending time caring for children, and whose role is to provide financial support, that parent’s wage has only an income effect on the household. The higher that wage, the richer the household feels, and the more they will spend on children, assuming that children are normal “goods”. It is also more likely that the household will have additional children. When that wage declines, less will be spent on children, and it is less likely that the household will have additional children.

1. Implementing a policy to reduce unplanned fertility is not a violation of human rights if you do not use coercion, deception, or callous manipulation. In this case, the people involved would agree with the goal; they probably don’t want unplanned fertility either. If you wish to reduce fertility among first-year university students, you should focus on them, and possibly those who have responsibility for them, such as dormitory supervisors and health care providers at the university.
The margin is a sexual encounter. Is it the first sexual encounter for most people who end up conceiving accidentally? If so, we should target people who are virgins, encouraging them to postpone and to plan the first sex act. If most accidental conceptions occur in people who are already sexually active, then we should find a way to prevent most sexually active people from engaging in unprotected sex.
Why is contraception not being used? What is the binding constraint, the immediate reason that protection is not being used? Is it hassle, embarrassment, expense, drunkenness, something else? Perhaps it is failure-to-plan-ahead, so that at the time of sex, finding contraception becomes a hassle. It then makes sense to make contraception such as condoms more readily available, in public bathrooms, for example. There is however the possibility that distributing with condoms will have the unintended effect of increasing unplanned fertility by promoting sexual activity.
2a) an increased day-care subsidy may please the mother, who may like to use some day-care or be using some day-care already, but child-care expense is unlikely to be the binding constraint for a wealthy stay-at-home mom. Not likely to affect fertility.
b) If the lack of parental leave is a reason this woman stayed home, the improved parental leave makes working and childbearing less incompatible. If she is harbouring a desire to go back to work eventually, she may no longer consider that desire an impediment to having more children. This might increase fertility.
c) Cash-for-care will make her feel better about staying home; however, money is not her binding constraint.
d) Same as c).
e) Same as b)
f) This may tempt the woman back to the workforce; the rising average wage makes it less likely she will have an additional child.
3. This plan discriminates against boys; presumably the government would only offer it if it believed boy babies would continue to be wanted. The policy is targeted directly at what the government wants to achieve: more daughters relative to sons. It is only relevant to those rural couples now limited to two children, i.e. non-minority couples. This idea is applied at the correct margin: rural couples who already have one daughter are the couples most likely to reject an additional daughter. Rural poverty was significant in China in the early 1980s, so if having more land means more money or more to eat, this policy targets a binding constraint; however, the family may figure that more land is useless without boys to farm it. If the family can sell or rent the land, they will benefit from owning it; however, if they have usage privileges only, they may need to hire men to do the farm work. If men are hired to do the farm work, there will be some upward pressure on the material value of boys which reverses the effects of the program to some degree.

1a).. The population projection matrix A that could be used to describe the mechanics of this population of gerbils is

1b) If, initally, there are 100 gerbils age 0, and no other gerbils, then next year the age vector will be:
n(t+1) = 
for a total of 30 gerbils (all age 1).
- n(t+1) = A n(t) resulting in n(t+1) =

Showing all the steps, the first row is 2(100) + 4(80) + 2 (50) = 620
second row is 0.4(100) + 0(80) +0(50) = 40
And the third row is 0(100) + 0.6(80) + 0(50) = 48
- We know the intrinsic rate of population growth (-5% in case 1, and 5% in case 2). We also know the survival probabilities: a 40% chance of living until age 1, and a 40% x 60% = 24% chance of making it until age 2.
Case 1: population decline at 5%.
Let the number of newborns in a year when the age mix has stabilized be NN. The number of newborns the year before was 5% higher, NN e0.05 Of this number, only 40% survived, making the number of one-year-olds equal to 0.4 NN e0.05 this year. The number of two-year-olds this year should be 0.6 * 0.4 * NN e0.1 since two years have gone by since they were born (0.1 = 0.05 x 2).
There are NN newborns, .42 as many one-year-olds, and .265 as many two-year-olds. Let NN + 0.42NN + 0.265NN = 1, then NN = .59 i.e 59% of the population. One-year-olds make up 25% of the population, and two-year-olds make up 16% of the population.
Case 2: population growth at 5%
The math is the same, except that the exponents are negative. Total population of 1 would be made up of NN, 0.38 NN one-year-olds, and 0.217 NN two-year-olds. So 63% of the population is newborn, 24% are one-year-olds, and 13% are two-year-olds.
We do not see a large difference in the population mix. The growing population has more newborns and fewer two-year-olds. It has slightly fewer one-year-olds as well.
4. In a stable population, all age groups increase or decrease at the same rate. Hence the population of newborns will be growing at 2%.
5a). The most fertile gerbils are less than two years old. Currently, the age mix has a greater proportion of these most fertile gerbils. We can conclude that population momentum is positive.
5b). Population will grow before it achieves its stationary size.
5c). Immigration or emigration will alter the stationary population size, not hasten its achievement. Achievement of the stationary population age mix could be hastened by the emigration of part of the child-bearing cohort and/or part of the child cohort, since these otherwise will only decrease (as a proportion of the population) in size gradually.
6. The population momentum of these polar bears is 800/1000 = 0.8, indicating that the population will shrink. The cohorts about to achieve reproductive age are smaller than the current reproducing cohort. In real life there could be other explanations such as pollution or habitat loss.
7. When population momentum is increasing, the current age structure is becoming more and more different from the stationary age structure. The age structure is becoming less and less conducive to zero population growth: the child-bearing cohort is growing in size.

1.
- Defining age 0-15 as childhood, we find that the Child Dependency Ratio = 205/309 = 0.66, where 309 = 169+140. Eyeballing it we see that children are about 17% of the overall population and people between 16 and 67 are about 24%, which gives us a rough ratio of 17/24 = .71, not too far from the more accurate 0.66. Meanwhile, ADR = 115/309 = 0.37. The total dependency ratio TDR = (205+115)/309 = 1.04. There are 104 people under the age of 16 or over the age of 67 for every 100 people aged 16-67.
- Check to see Canada’s current CDR and ADR, but note that CDR in this case does NOT mean Crude Death Rate. Also note that Canada’s CDR and ADR may be defined using slightly different age groups.
- The total dependency ratio here is very high. The fact that most dependents are kids suggest an early stage of Demographic Transition, but a substantial portion of the population is senior, suggesting a developed economy. Could there have been something that wreaked havoc among the working age population, such as the AIDS pandemic of the 1990s?
- The sex ratios of each age group, from youngest to oldest, are 1.05, 1.13, 0.87, and 0.91. The 1.05 is approximately the sex ratio at birth and we usually expect it to fall as the children grow, so that the sex ratio for kids 1-15 years of age should be lower than 1.05. There may be some discrimination against girls and there is definitely something that favours young men if the sex ratio rises to 1.13 for young adults! It may be that the childbearing years are very dangerous for women. Thereafter, however, the sex ratio plunges indicating past or present dangers to this cohort of men. The sex ratio then recovers a bit for the elders, suggesting that men who have survived their middle years fare better than senior women.
- If 20% of people between 16 and 36 years of age are addicted to heavy drugs, we should remove them from the denominator of the dependency ratios. The effective dependency ratio will be (205 elders +115 kids)/{0.8(169 young adults) + 140 middle-aged} = 1.16.

- The United States’ greater GDP per person may be due to a number of things highlighted in Equation 16.1
- First, workers may be more productive in terms of output per hour. This is true. The OECD reports that in 2021, GDP per hour worked was indexed at 108 in the US and 105 in Canada. This could be because of higher efficiency A and/or because of more capital per worker. Indeed, American companies have easier access to loans, invest more in R&D, and have better equipment, typically, than Canadian companies. Canadian companies are usually smaller and thus enjoy fewer economies of scale.
- Second, Americans may work more hours. Again, this is true, as many Canadians work seasonally. In 2021, the average American worker worked 1791 hours compared to 1685 in Canada, according to the OECD.
- Finally, Americans may have a greater fraction of their population working, either because they have a greater fraction of their population at working age (no) , because they have higher labour force participation rates (no), or because they have lower unemployment rates (yes). It is difficult to determine whether Americans have a greater fraction of their population working does does not exist because the two nations have different definitions of what constitutes being “employed.”
- Immigration may affect Canada’s GDP in the following ways.
- First, there may be a change in output per hour. Immigrants may bring new energy, organization, and knowledge which improve efficiency. Immigrants might also bring enough capital with them to preserve the current capital:labour ratio, but this is unlikely. The capital:labour ratio will likely fall in the short term. The overall effect on productivity could be an increase or a decrease.
- Second, there may be a change in hours worked per worker. The immigrants may work more hours than other residents, though a significant fraction of the work may not be recorded and counted as GDP. Hours worked will likely rise.
- Third, if immigrants are more likely than other residents to be working age, if they intend to work, and if they can find jobs, there will be an increase in the fraction of the population that works. This, together with the increase in hours worked, could raise GDP per person if the overall effect on productivity is not too detrimental.
- A prolonged period of high interest rates makes it expensive for a growing population to accumulate the capital its growing workforce requires. It also makes housing, which young families need, difficult to finance. Young people are more likely to borrow than save, so the high interest rates are a burden to them. Though populations with a high rate of child dependency find it difficult to save, at least what they do save will earn a high rate of return. With both high interest rates and a growing population, both kinds of pensions will do well, and the current workforce will not have to pay as much towards pensions.

1. A baby boom cannot immediately yield a demographic dividend. It will take some time for these babies to reach working age. In the meantime, they may push the country back into something like Stage Three of the Demographic Transition, where the population is growing and the child dependency ratio is increasing.
For Canada’s current baby boom to yield a demographic dividend eventually, the babies must receive good healthcare and education, so that they will be productive in the workforce. As they approach working age, the business environment must be conducive to expansion of business to employ these new workers, and investment in new capital to equip these workers. In particular, loans must be available at reasonable rates of interest.
The parents of the babies must receive good healthcare so as to reduce their future dependency as seniors, and they should be encouraged to save for their retirements. When the babies are of working age, they must have money to save left over after caring for their children; ditto for the government. The saved money should be invested in things that will improve the productive capacity of the economy.
2. An aging population means that the standard of living is so high, and health care is so advanced, that people are surviving to old age. It is an indicator of economic development. Elders are a source of knowledge. They are often beloved family members and friends. While they may not have the vigour to be in the labour force, they often perform volunteer work in the family or community. Their savings, and the savings of younger people anticipating retirement, are a source of loanable funds for the economy.
3. Aging affects GDP per capita by affecting productivity, hours worked, and dependency. Productivity may be reduced by elders’ lessened ability to learn new things and their possibly diminished interest in trends and new inventions; on the other hand, they have experience and institutional knowledge. Hours worked may be reduced as strength and stamina diminish. In terms of dependency, elders eventually become unable to stay in the workforce. On the whole, tends to reduce GDP per capita; however, there are many other non-demographic factors which help determined GDP per capita.
4. “Net debt” in this chapter is the difference between a government’s debt and the present value of the money it can expect to raise in net taxes from the people currently alive. The greater the fraction of elderly in the population, the less the amount of net taxes the government can expect to collect from people currently alive. The greater the fraction of elderly in the population, the more the spending needs of the government and so the more debt they are likely to have taken on. Thus aging increases net debt in two ways; however, aging is only one factor in a government’s spending policy or tax policy. An aging population saves more and helps create a low-interest rate environment, making it more likely that some of this debt is owed to the aging population itself.
5. How can a nation prepare for rising aged dependency? We can reduce the likelihood that an older person is dependent on the state and we can improve the productive capacity of the economy. In terms of making older people less dependent, we should keep our population as healthy as possible, encourage elders to remain in the workforce if possible, encourage employers to accept older workers, encourage workers to save for old age, and build up pension and other elder assistance funds for the future. We can also reduce the amount of social assistance given to high-income seniors. In terms of boosting the productive capacity of our economy, we can promote capital accumulation and skills development, encourage and equip people all adults to join and stay in the workforce, invest in research and development, and foster trade relationships.

1. The Solow model assumes
- technological change is possible but is not presently occurring
- only one output is produced
- both labour and physical capital are necessary to production
- output which is saved can produce physical capital
- everyone works
- constant returns to scale
- diminishing marginal returns
2. In the Solow model, the rate of growth of population, n, directly affects steady state capital per worker. As n increases, there is capital shallowing, and the steady state capital:labour ratio falls. “n” can also affect the steady state indirectly if it affects efficiency (A) or savings (s). If n causes efficiency to increase, then the steady state level of output per worker will be higher than otherwise. If n causes savings to decrease, then the steady state level of output per worker will be lower than otherwise.
3. Hartwick’s Rule is that nations should save some of the money earned from the extraction of non renewable resources. They should save the profit on the last ton mined, multiplied by the total amount mined that year. In this way they will have money to invest in different forms of capital as they deplete their natural capital.
Hartwick’s Rule has been criticized by those who note that at some point, physical capital or other forms of capital will not be able to make up for a declining amount of natural resource capital. Therefore investing resource rents is no guarantee of a sustainable economy.
4.Total Hotelling Rent is $800,000,000.
5a) Genuine savings is 9.0 percent of GNI.
b) This country seems to have its act together. It is investing almost 16% of GNI in physical capital plus spending 5% on education. Its capital stock is depreciating rapidly – perhaps in the past it could only afford shoddy construction and less-than-cutting edge tools that become obsolete quickly. It is a user of forest resources, but they are not badly exploited. Pollution doesn’t seem very bad. This country is obviously not an oil exporter, since Total Hotelling Rent was negligible.
In fact this country is Costa Rica (in 2008).

1. There are many possible answers. I am going to describe a village in the remote Arctic.
Since the village is so far away from other communities, trade with other communities is expensive. For example, fresh vegetables may be prohibitively expensive to import. A larger population would mean that more things could be supplied locally. With a sufficient population size, someone in the community will find it worthwhile to invest in greenhouses and soil enhancement to grow fresh vegetables. With a sufficient number of customers, they may be able to achieve internal economies of scale and a cost of production that makes these vegetables affordable.
2a) There are many vendors on the internet which means that people with specialized interests and talents can find buyers for their niche goods and services. Etsy.com is one website offering an endless variety of handmade goods, even a 1/12 scale model of a 1/12 scale folding paper dollhouse published in Germany more than fifty years ago.
2b) The market for flea ointments like AdvantageTM and RevolutionTM is more competitive now that you don’t have to buy them from your local veterinarian but can go online to order them from as far away as Switzerland.
2c) Not only are innovators encouraged by the prospect of innumerable customers on the internet, but there exist websites which channel start-up and research funds to innovators. Wherever they live, innovators can be connected to venture capitalists and angel investors around the world.
3. In a large, dense population, there will be enough fans to support professional athletes, and enough people wanting soccer lessons for their kids to support professional soccer instructors. People can make a living specializing in the game of soccer, as athletes, coaches, referees, and suppliers.
In a large, dense population it will be easy to find a soccer club or soccer field or soccer game near you in time or space. This is an example of thick markets.
Only large cities will be able to afford to have their own professional soccer team and build a stadium, because they can spread the cost over so many fans. This is an example of internal economies of scale.
In large cities , or particular soccer capitals of the world, soccer specialists will come together to plan events, lobby governments, and scout for talent. This is an example of external economies of scale.
Innovations in soccer shoe design, ball design, and game strategy are more likely to happen where a lot of soccer is being played and watched and where new ways of doing things can be tried, tested, noticed, advertised, and marketed.
1.
| July 1, 2009 | July 1, 2010 | July 1, ’09-July 1, ’10 | |
| Canadian population | 33,739,900 | 34,108,800 | |
| Change in population | 368,900 | ||
| Mid-year population | 33,924,350 | ||
| Births | 381,382 | ||
| Deaths | 247,556 | ||
| Natural Increase | 133,826 | ||
| Net Migration | 235,074 | ||
| Net Migration Rate | 6.9 per 1000 | ||
| Migration Ratio | 1.76 |
2. The migration ratio for this nation will be: 0.4 ΔN / 0.6 ΔN = 0.4/0.6 = 0.67.
3. Applying survival rates to the number of newborns, there should be 19,834 males and 19,000 females in the population today. Based on how many males and females there actually are, we can estimate that there has been net immigration of 100 females and net emigration of 834 males over the course of this cohort’s first 15 years of life.
4. An early retirement package for people who cannot be terminated from their union-protected or tenure-protected jobs may be most attractive to those who are doing well in their careers and who can easily find work elsewhere.
5. Unigeniture means that second sons inherit less wealth. They therefore have to take bolder measures, such as emigration, to build wealth. If second and subsequent sons inherit no land, they are less tied to place and more likely to emigrate. Villages who have experienced high emigration in the past have connections to relatives and friends who have emigrated and who can provide information and support for any others who wish to follow their footsteps. Villages with fewer factories presumably have lower levels of economic development, so emigration in search of economic opportunities is more likely. Villages where there are many religious minorities might be expected to be more tolerant and thus to have less emigration per religious minority member. However, religious minorities are more likely to emigrate than non-minorities, in order to find greater freedom to worship, so it is not surprising that villages with a large number of minorities experience greater emigration.
6. An immigrant who poses least economic threat to the nation’s automobile assembly workers is an immigrant
- who does not intend to work in the automobile industry unless it is to supply a skill which is in short supply
- who intends to work in an industry which is complementary to the automobile industry
- who has a large amount of cash he/she wishes to invest in that nation’s automobile industry
- who has a good marketable idea to improve worker productivity
- who has few dependents and little need for government subsidies such as health care and language training.
7. A large group of unskilled, poor, illiterate refugees arrives in your city. To make sure that all residents benefit economically, the government should
- subsidize language training using local providers
- subsidize other life skills needed using local providers
- subsidize job search training for all residents, using local providers
- make sure employers have the loans needed to expand operations and employment
- attract suitable employers to the city
- liase with leaders of this ethnic group who already live in the city or nearby. They will probably have good advice and job connections
- knowing that local wages for unskilled workers are likely to be affected, offer wage insurance for a period of time, temporarily expand its welfare offerings, or reduce utilities costs and taxes for low income households.
8. If our nation has a shortage of doctors, we can
– expand our medical schools and admit more medical students
– pay doctors more, or reduce their workload, so that more people will want to be doctors, and so that more doctors will stay in our nation
– substitute some doctor care with telephone services, nurse practitioners, or other things
– increase immigration of doctors
– help immigrant doctors become part of our medical system
9. If you want to know whether patrolling the border makes economic sense, you need to know what would happen if the border were not patrolled. Presumably, illegal immigration would surge and the decrease in labour market surplus would be much larger than what is was initially. Hanson does not have enough information to conclude that the border should not be patrolled.

1. It appears that illegal immigrants are more likely to have a net positive effect on GDP than legal immigrants because they contribute to GDP without qualifying for many government services. This assumes that the work they do is actually recorded in GDP, instead of being “under-the-table”. Illegal immigrants are less likely to bring kids or elderly parents with them, with the result that government money is not diverted to caring for these dependents and can be used instead to build up the productive capacity of the economy. Illegal immigrants also tend to come and go as needed, and come to the specific sectors which have job vacancies. They do not collect unemployment insurance benefits.
We might argue that in the long run, the maintenance of a second-class category of workers has a corroding effect on our social conscience, and builds a grey zone where criminal behaviour can hide. We could also wonder whether the depressing effect of illegal migrants on the real wage of low-skilled workers is offset by productivity gains or falling prices for goods and services. Or does it keep many native-born workers in poverty?
2. In the 1990s, Canada began to increase the proportion of immigrants from the skilled worker class. However, this policy failed to alleviate poverty among immigrants. Apparently, skill had not been the binding constraint preventing immigrants from achieving well-paying jobs. Other barriers, such as experience, language, racism, and a need for Canadian credentials, were binding.
3. The city may have little say in the nation’s international immigration policy, but it could focus on being attractive to immigrants once they have been accepted, and on being attractive to citizens in other parts of the nation. In order to be attractive the city needs to offer a high expected real wage. This can be done in several ways:
-increasing the probability of finding employment by assisting with job search
-stimulating businesses by providing good infrastructure and reducing red tape
-providing sizable unemployment benefits
-reducing the cost-of-living by providing good infrastructure, other public goods, reducing taxes

-
-
Temporary Foreign Workers in Canada today Indenture Serfdom Slavery Migrate freely? Yes, but may be misinformed. May not be willing but obligated. Serfs unable to migrate. Unwillingly confined to a property. May have been duped. Once enslaved, no freedom of movement. Family life, choice of employer? No No May raise a family. No choice of employer.
No Unpleasant work? Typically Typically Not necessarily Typically Permanent condition? No No Yes Yes 2. Although western Africa was land-rich, and not labour-abundant, its agriculture, mining, and domestic markets were not well-developed. There was little capital or investment. Consequently, it would be profitable to sell people to other land-rich countries which had more developed markets and in which the slaves could be forced to work intensely. However, much of the slave trade was involuntary, with economically more powerful countries forcing the compliance of local authorities in the trafficking of people, or taking advantage of a lack of local governance to steal people away.
-
3. Polygyny is less likely in an urban environment. Children, and wives who do not work in the marketplace, are of less pecuniary benefit in cities, since they can no longer work the land. The cost-of-living is higher in the city, making it more difficult to support dependants. Theoretically, one’s wives could be earning money in the workplace, which would make having multiple wives financially beneficial; however, this would give the wives exposure to other views and possibilities, making it less likely they will tolerate polygyny.
4. In an open-ended question like this, make sure to stick to concepts and terms discussed in this course. Take time to collect your thoughts. Here is a sample answer.
The push-and-pull factors which lead to the victimization of these girls should be identified. Is there any chance the parents do not know who these employers really are? Lack of information may be the problem. You can provide documentation. On the other hand, “outing” these families may lead to the village closing protectively around them against you, the foreigner, or may lead to suicide of those involved. Proceed discretely.
Poverty is probably the constraint that prevents parents from resisting the “employers” and their offers. Lack of respect for women or human rights could be another factor. Economists such as ourselves are trained to address the poverty. Perhaps you, with your foreign connections, can bring employment to this area, and alleviate the poverty of parents. Perhaps you can bring education, and increase formal sector employment opportunities for the girls. Simply cutting off the “employers” will not lead to the girls and their siblings being well fed and properly educated; it could even lead to the girls starving or being killed.

- Although there were twice as many marriages as divorces this year, we cannot conclude that 50% of marriages end in divorce. There may have been very many more marriages in previous years, of which the 5 d this year represent only a tiny fraction. The marriage rate this year may be low because the underlying population has few people who have never yet been married.
Other possible differences in age structure and marriage patterns could be possible, so that the actual divorce rate is higher or lower than 50% of ever-married couples.
- In Canada today, relatively few households include grandparents. Grandparents may be relatively independent or the opposite. When they are independent, they can help their adult children with domestic chores and childcare. If quality, affordable daycare is more available outside the home than previously, there will be less incentive or need to have grandparents live with the family. It’s possible that with low interest rates in recent decades, fewer adult children need the grandparents to help them afford a home. And with grandparents being, on average, healthier and wealthier than ever before, fewer may need or desire to live with their children.
The economic consequences of independent seniors living on their own would include more resources allocated to housing, and more senior participation in the labour force and in the community, though less senior participation in the lives of families with young children.
To the extent that grandparents are in need of financial assistance or support with daily living, the fact that fewer live with their children may have something to do with the economy, for example increased participation of their children in the workforce. The opportunity cost to spend time at home caring for parents is higher as the real wage rises, though the real wage hasn’t been doing a lot of that in North America in recent decades. Improved pensions and government assistance to seniors is another explanation.
The economic consequences of needy seniors living on their own would include more taxpayer resources being allocated to supporting seniors, either in their own homes or in long term care facilities.

The following answers are suggestive, not exhaustive.
1a) The mechanization of agriculture will release men from agricultural tasks. It will be less critical to have a large number of sons to work the farm, easing son preference. Bride price should also fall in areas where women work on the farm.
The productivity of the farm and the value of the land will likely rise. This means that more could be given to the bride upon marriage. Both groom price and bridge price could rise.
The mechanization of agriculture will require more ready cash to pay for equipment and fuel. Family members may search for work in other sectors. Exposure to new ideas and opportunities in town may reduce son preference. Groom price may ease if life becomes less precarious. Groom price might rise if income variability leads to different socioeconomic classes competing for the upper class men.
b) Reductions in infant mortality improve the viability of male children, likely leading to a lower target number of sons. Eventually, the increasing availability of men could help reduce groom price or increase bride price, but there are many other things which influence groom price and bride price.
c) We saw in chapter 22 that child labour is not very productive, so the absence of children from the farm may not affect productivity very much; in fact, it may the caregiving parent, typically the reproductive mother, to get more done. On the other hand, once educated, more of the children will take a non-traditional life path. We know that the young women will be less likely to immediately marry and have children of their own, and families will become smaller. The young men may choose alternative careers where they have enough money to send back home to the farm.
Son preference may wane as the family anticipates a mix of careers, and learns that daughters too have career potential.
With education, life and employment become less precarious; this may ease son preference and groom price. Bride price may have to rise if more women are rejecting traditional roles.

1. In the Malthusian flowchart, institutions could show up in between the standard of living and the birth rate or the death rate, showing that institutions are significant in either changing the standard of living (through taxes or transfers, perhaps), or controlling births. Institutions could show up in between the population growth rate and the standard of living, showing that the degree of pressure that population growth puts on resources is moderated by institutional arrangements that protect the environment. Institutions could be shown to be developed when there is an increase in the standard of living, and they could promote innovation and consequently increase the standard of living in a virtuous cycle. Other answers are possible.
2. In the Boserup-Simon flowchart, institutions could show up in the same places described in the answer to question 1. Additionally, “Innovation” could be placed within a box called “Institutions”, showing that the degree of innovation depends on institutional arrangements. “Rising prices” could be placed within a box called “Market and Property Arrangements”, showing that prices will only rise to register scarcity if resources are marketed and if resource extraction is costly/regulated rather than open access. Other answers are possible.
3. The role of family is different in Chapter 25’s Indigenous model compared to the Clark model. In the Indigenous model presented, particularly the medicine bowl formulation, the achievement of peaceful family life is one of the pillars of well-being. The standard of living cannot grow unless families are peaceful and well. This includes all families. The Clark model agrees that family is important to the standard of living, but only those families which have certain characteristics. These characteristics (literacy, numeracy, thrift, and hard work) are conducive to innovation and important for survival. What matters for the economy is that these characteristics are inherited and become more and more dominant in the population due to these kinds of families having more surviving children than other families.
So in Clark’s model, “upper class” families are important as a means to an end, whereas in the Indigenous model, all families are important as one of the quadrants of the medicine bowl.
4. What might a complete breakdown of family do to any of these models? A complete breakdown of the family
- might reduce the birth rate and increase the death rate at any level of the standard of living
- might exacerbate the effects of population growth on the standard of living
- would empty the medicine bowl and lead to the lowest possible level of wellbeing in the Indigenous model
- might encourage the rapacity described by the Ehrlich model
- might discourage the transfer of literacy, numeracy, thrift, and hard work within the Clark model
Other answers are possible.
