

Written by Thomas Robert Malthus in various editions, An Essay on the Principle of Population as it Affects the Future Improvement of Society (1798) is famous because it presents an equilibrium that is both credible and terrifying. On the basis of his model, Malthus predicted that the standard of living can never increase, and that it is useless to help the poor.
Malthus’ model assumes two things: first, that food production can never grow as fast as the population can grow, and second, that the population grows whenever food becomes more plentiful. The model ignores a number of factors which will be discussed later. It is also, as expected of social science and natural science models, constructed without reference to any deity or any metaphysical principles.
Malthus’ model achieves an equilibrium because population size affects the amount of food per person in a simplistic and rigid way, and the amount of food per person affects the population in a simplistic and rigid way that is exactly opposite. Since the forces are opposing, no positive or negative feedback loops can form.
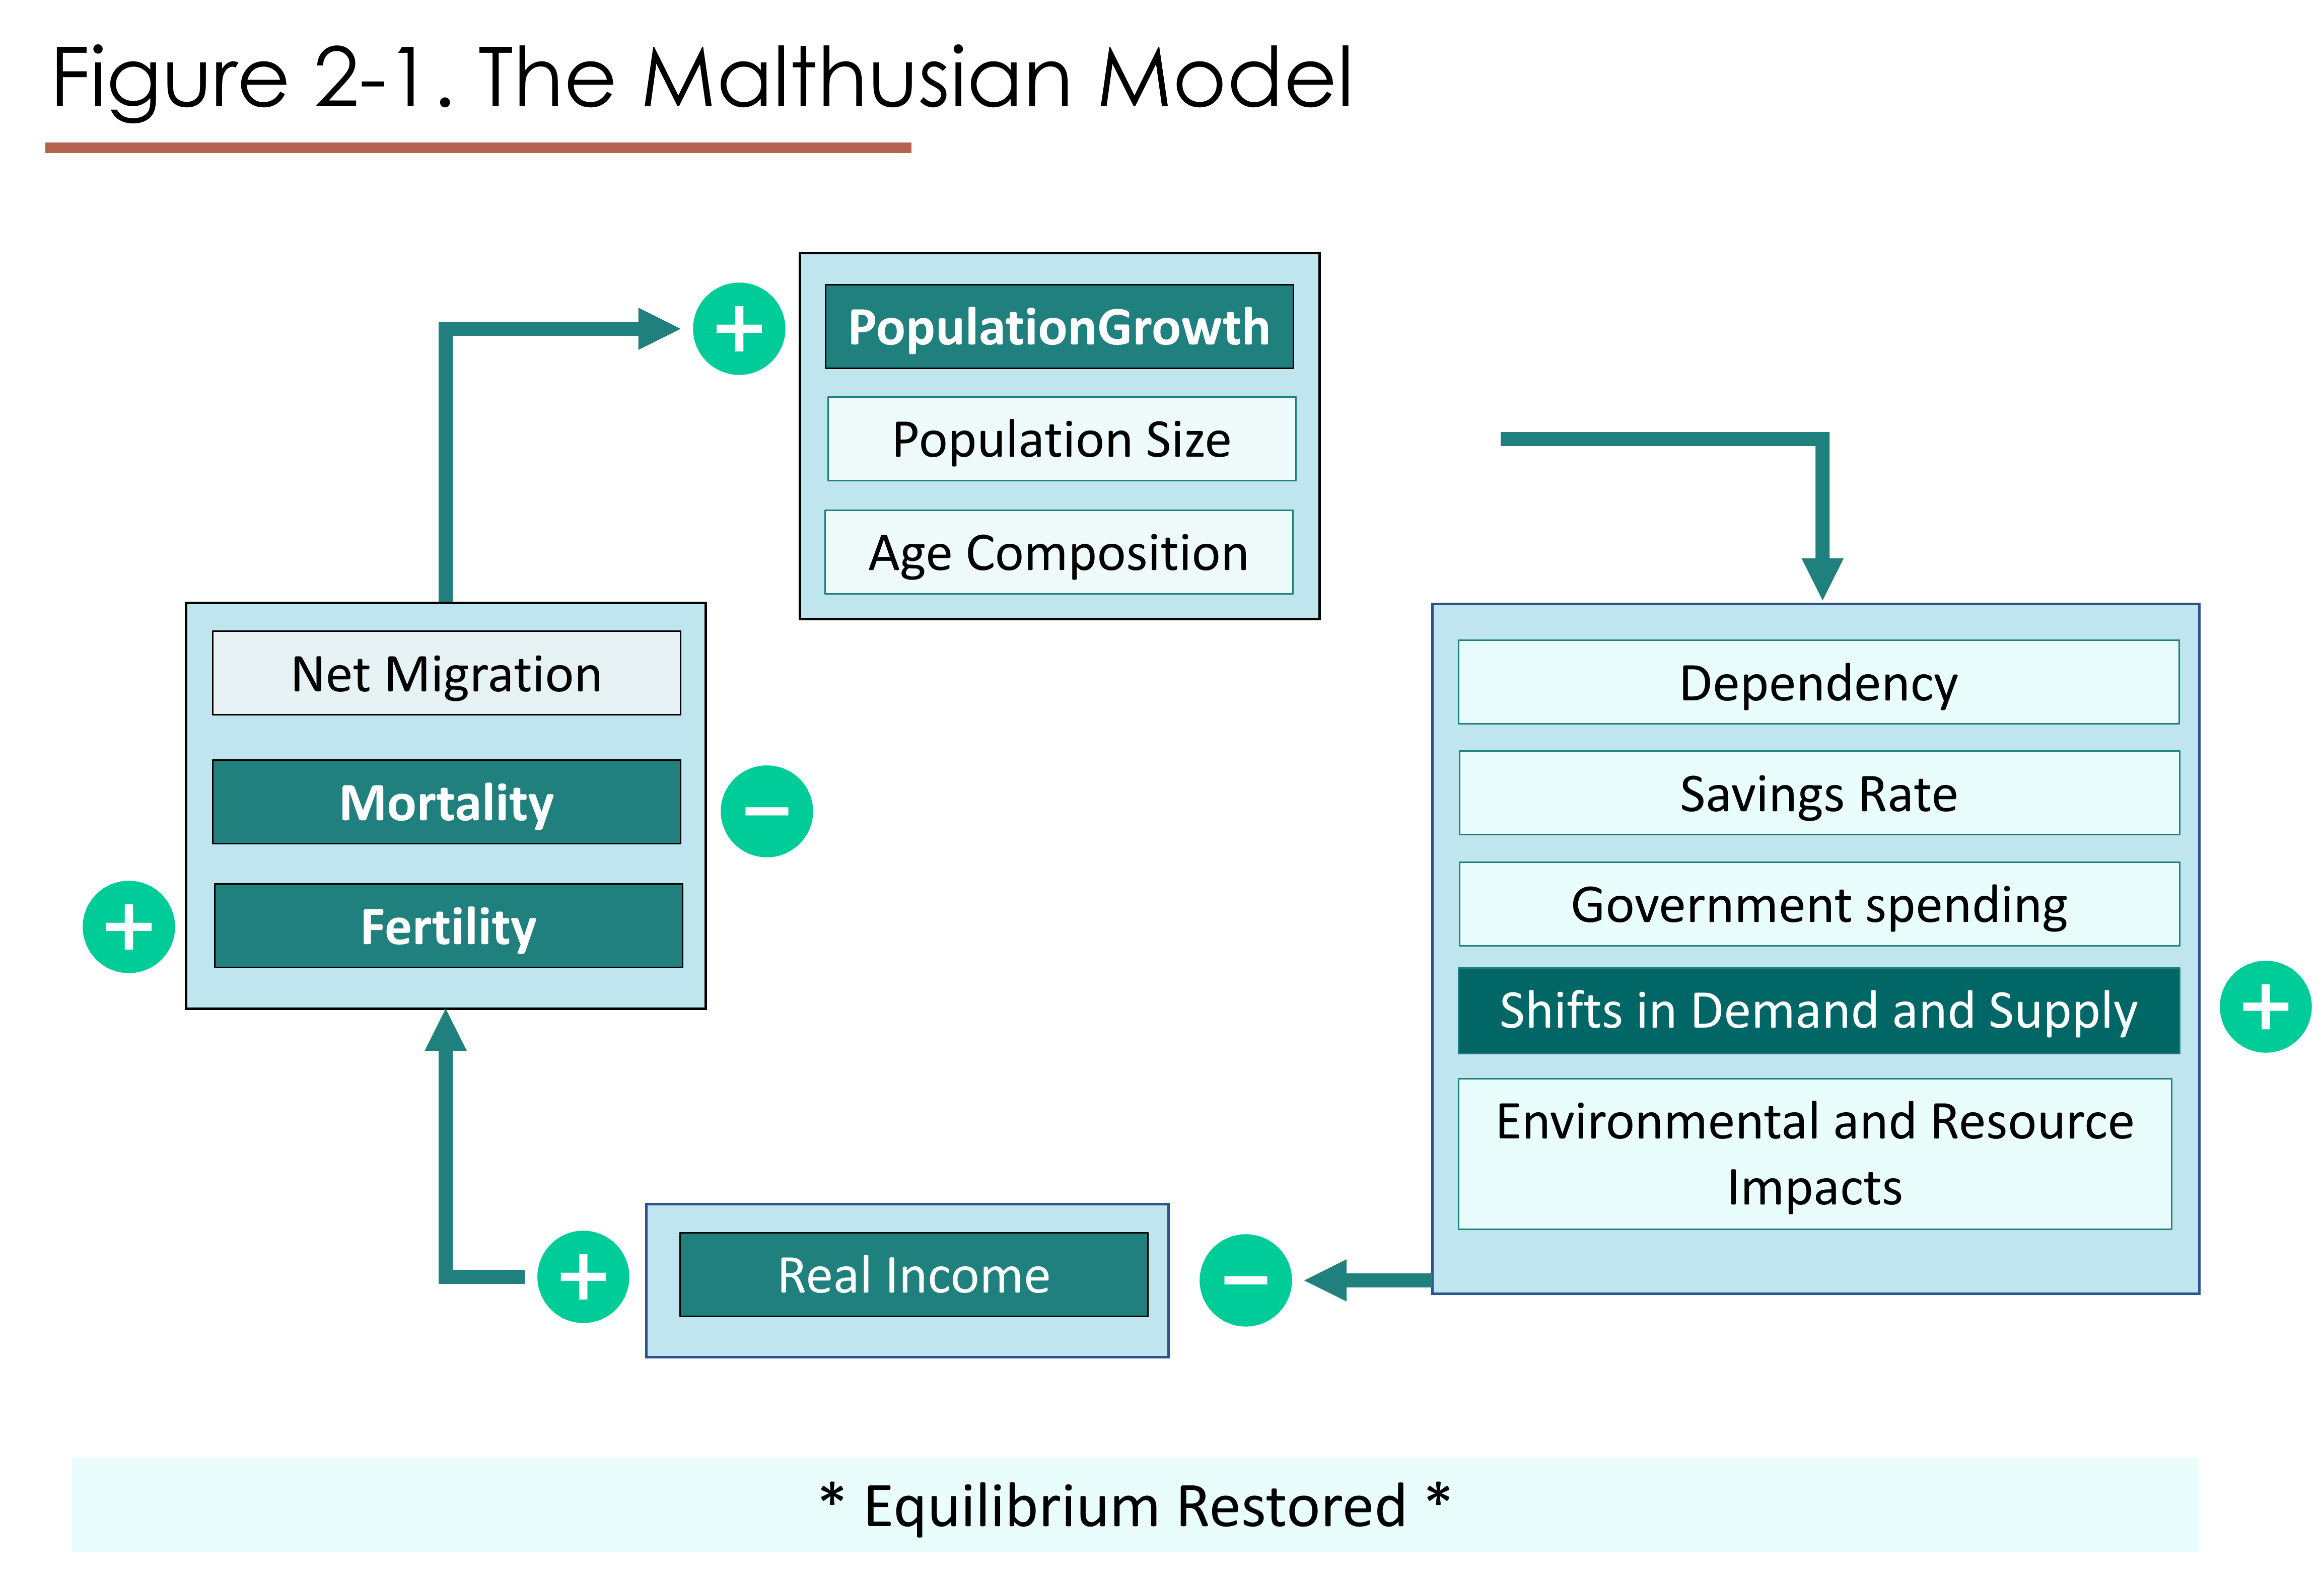
Let’s begin our examination of the Malthusian model by looking at “Real Income” at the bottom of Figure 2-1. Malthus didn’t actually talk about Real Income; he talked about “Food per Person”, which is conceptually similar to real income per person or per household. Real Income per household is the average household’s income divided by the overall price level. So it measures how much stuff households can afford to buy.
Malthus believed that if something happened to increase Food per Person/Household Real Income, then the birth rate would increase and the death rate would decrease. This is shown by the lower left arrow, although fertility and mortality are not exactly the same thing as births and deaths (as we will learn in later chapters).
The upper left arrow shows that an increase in fertility and a decrease in mortality cause the population to grow.
The population growth causes demand for food to increase. Malthus believed that agricultural supply could not keep up with the demand for food caused by population growth, so food per person/real income would decline as the population grew, as shown by the lower right arrow. We would end up at the original level of food-per-person/real income.
Figure 2-2 is a graphical depiction of how the Malthusian equilibrium is determined.
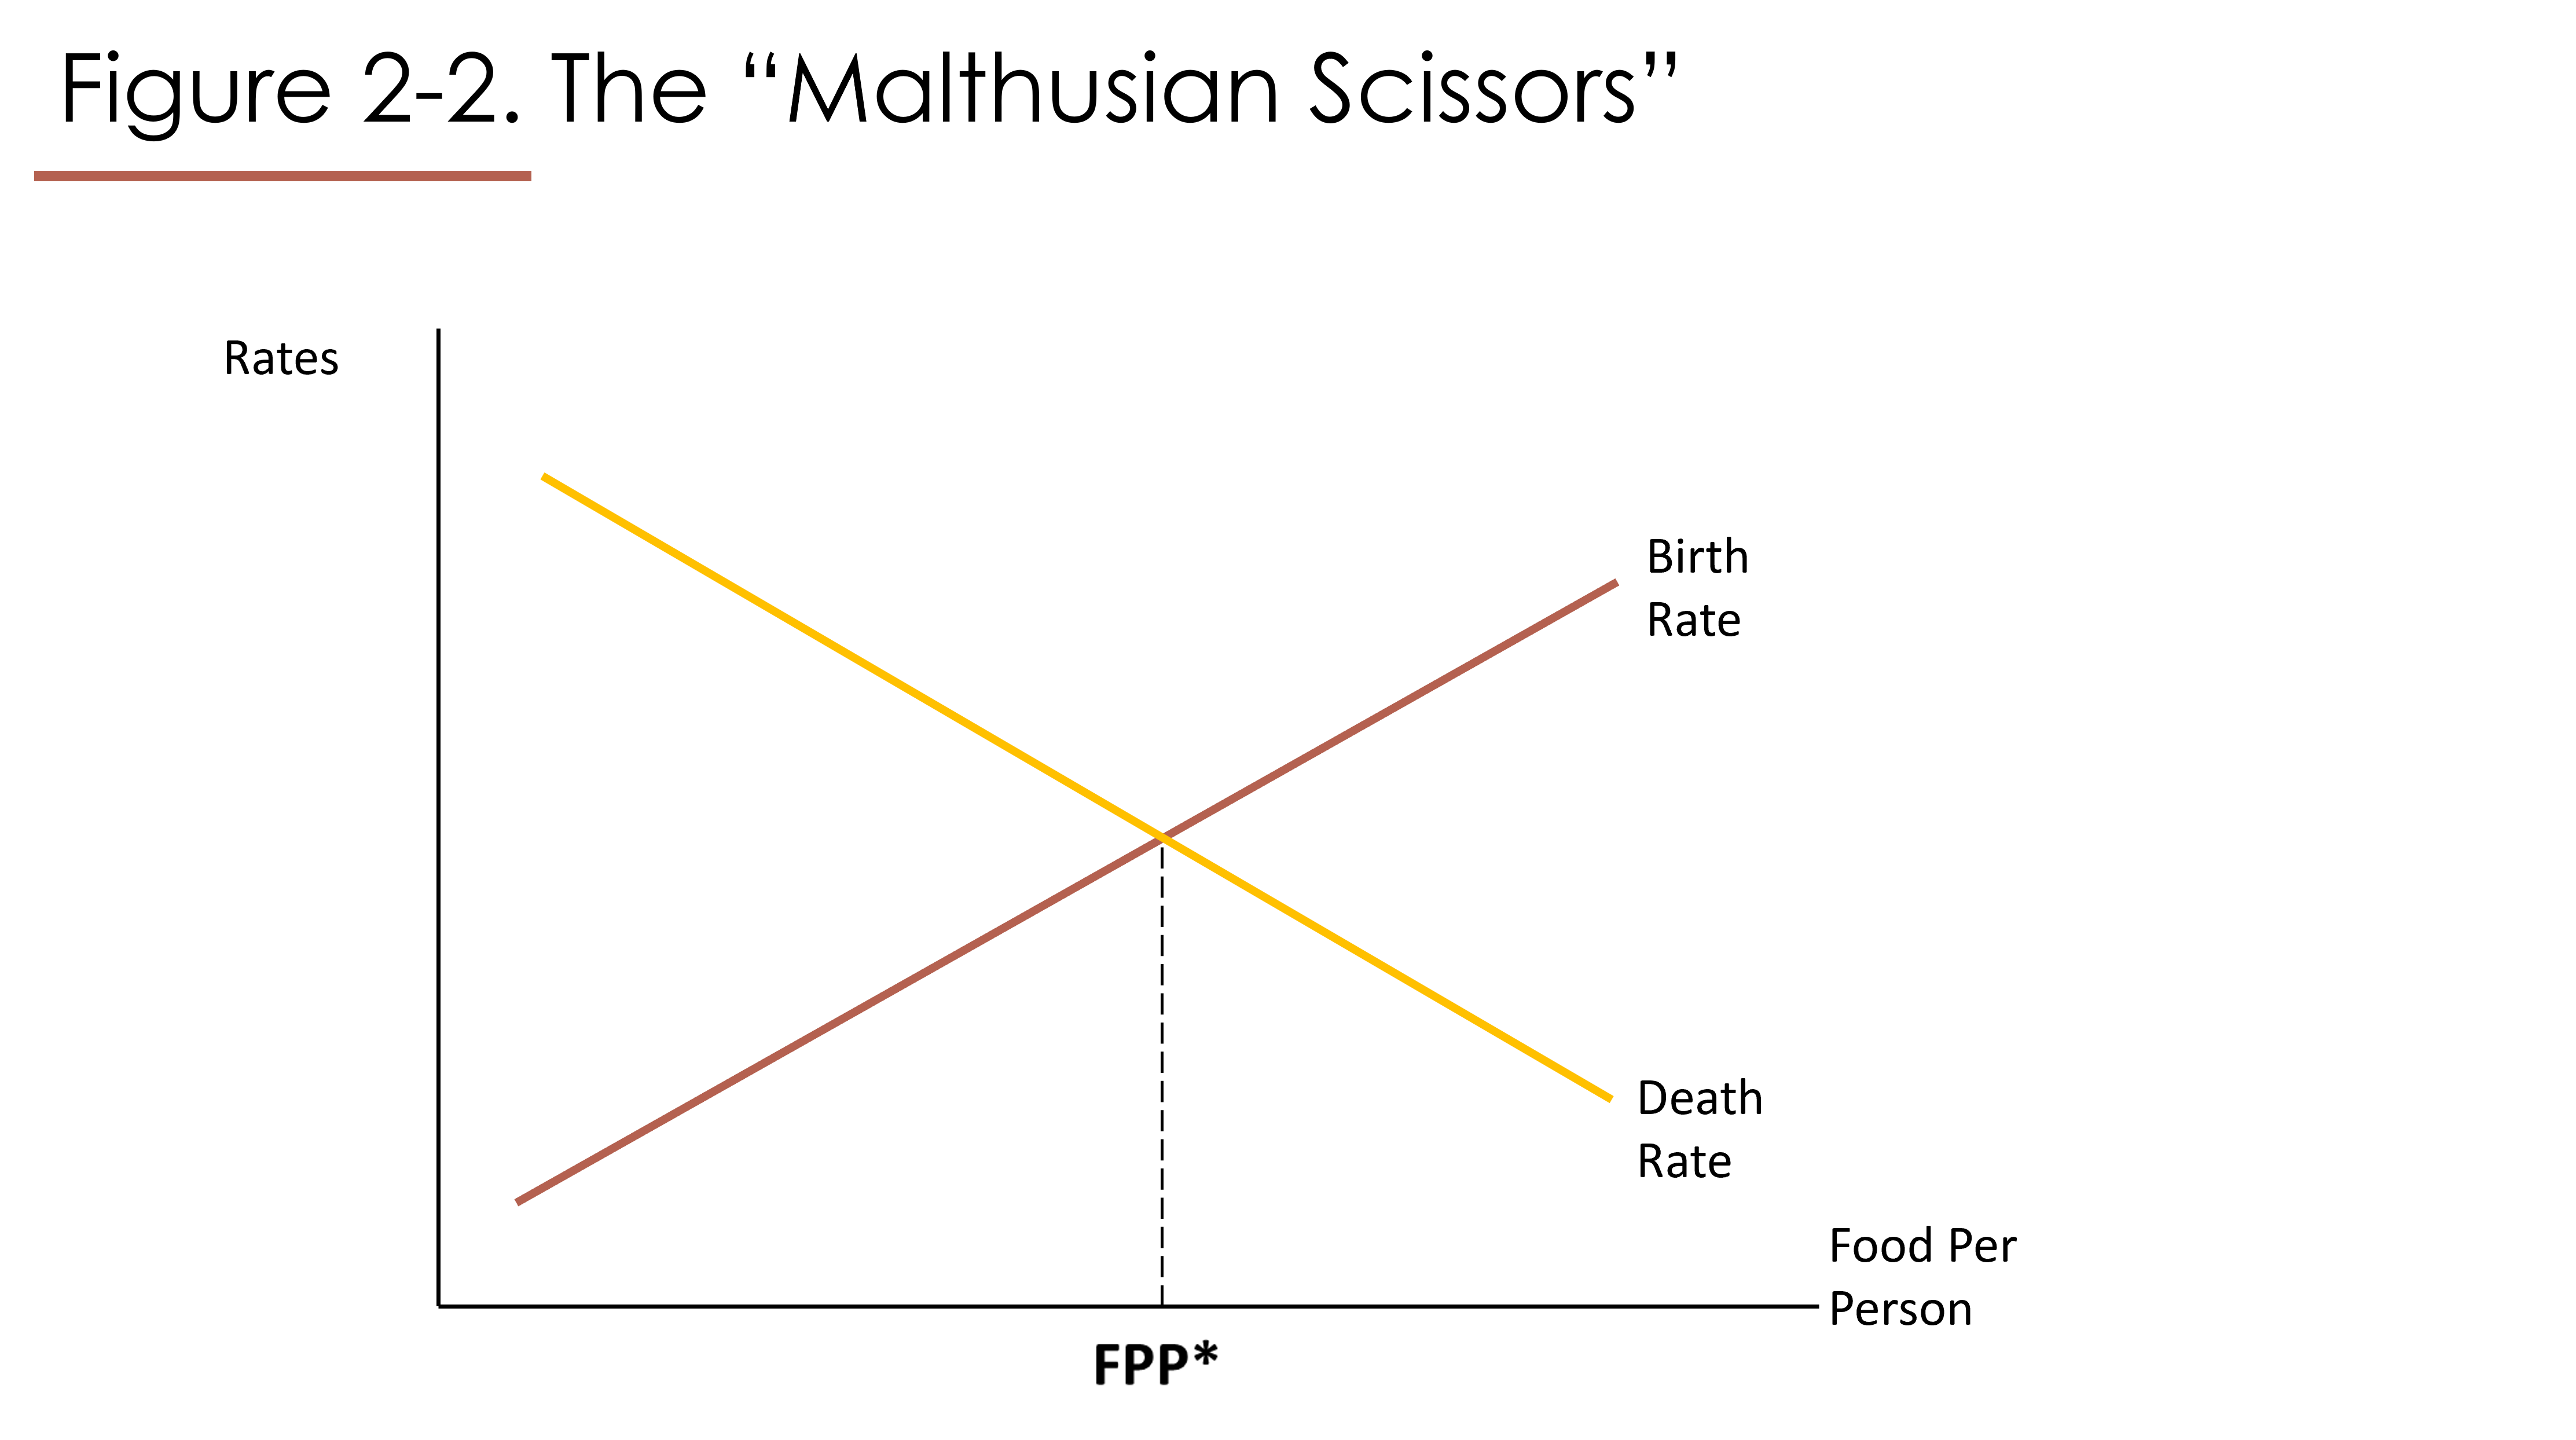
In Figure 2-2 we have the birth rate as a positive function of food per person and the death rate as a negative function of food per person, in keeping with Malthus’ assumptions. The point where they intersect is the Malthusian equilibrium level of food per person. Malthus assumed that this level of food per person would be low, just enough for survival or “subsistence”. But that’s not necessarily the case. The Malthusian model’s predicted equilibrium level of food person is just whatever level of food per person coincides with zero population growth. That is to say, the equilibrium level of food per person is found where the birth rate is equal to the death rate.
So not only do we have an equilibrium level of food per person, we also have an equilibrium level of population growth, namely zero population growth (“ZPG”).
Figure 2-2 shows us that if food per person were to be any higher than its equilibrium level, for example because of favourable weather, the birth rate would exceed the death rate. This means that the population would grow and cause food per person to come back down. As food per person declined, the birth rate and death rate would converge once again until the original equilibrium was restored. Similarly, if food per person were any lower than its equilibrium level, perhaps because of famine, the death rate would exceed the birth rate, and then the population would shrink. As the population shrank, food per person would increase again. Eventually, food per person would be at its original level, and the population would have stopped shrinking.
Note that, in Figure 2-2, the birth rate line is NOT like a supply curve. It does not shift to the right when the birth rate rises at every standard of living. It shifts up vertically in that case. The death rate line also shifts up vertically with an increase in death rates, and shifts down vertically when they fall.
What might cause the birth rate line to shift? Malthus noted that the age at which people get married affects the birth rate. Whatever the level of food per person, if social norms or personal choices mean that most people get married younger/older, then the birth rate will rise/fall.
What might cause the death rate line to shift? An outbreak of a new disease, for example, would cause the death rate to shift up, though it would likely shift up more for people who have less food per person than for people with higher incomes. The development or distribution of a vaccine would cause the death rate to shift down.
What happens to the equilibrium level of food per person if the death rate shifts down? You might be surprised. Trace it out and you will see that if the death rate line were to shift down, or if the birth rate line were to shift up, the original equilibrium level of food per person would now coincide with a birth rate that is higher than the death rate. There would be positive population growth at this level of food per person, stressing the food supply. The economy and the population would settle at a new equilibrium, an equilibrium consistent with a lower level of food per person.
Gregory Clark, in his 2007 book “A Farewell to Alms,” notes that homes in medieval East Asia were likely a lot cleaner than they were in medieval Europe. In East Asia, cats and dogs were not permitted indoors, people took their shoes off when entering the house, and people’s urine and defecation was removed from the home and used to create fertilizer. Because Europe didn’t follow such practices, death rates were likely higher in Europe. Clark provides some data to back this up. The Malthusian model predicts that the higher death rates in Europe would result in a higher equilibrium level of food per person, ceteris paribus. Accordingly, Clark believes that the lack of hygiene in Europe was a major reason for the higher standard of living in Europe.
Whether Clark’s argument is historically accurate or not, the Malthusian model warns us that it is not enough to offer vaccinations and medical technology to poor societies. Everyone needs not only to survive, but to thrive. If peoples’ lives are to be saved by vaccination or other means, food per person may be strained. Assistance with food production or other ways of earning income is essential. This may involve removing barriers that put poorer countries at a disadvantage in international trade.
Malthus believed that population growth will always strain food per person, because he assumed that technology cannot keep up with population growth. For him, technology was not constantly changing but was fixed for long periods of time, as shown in Figure 2-3.

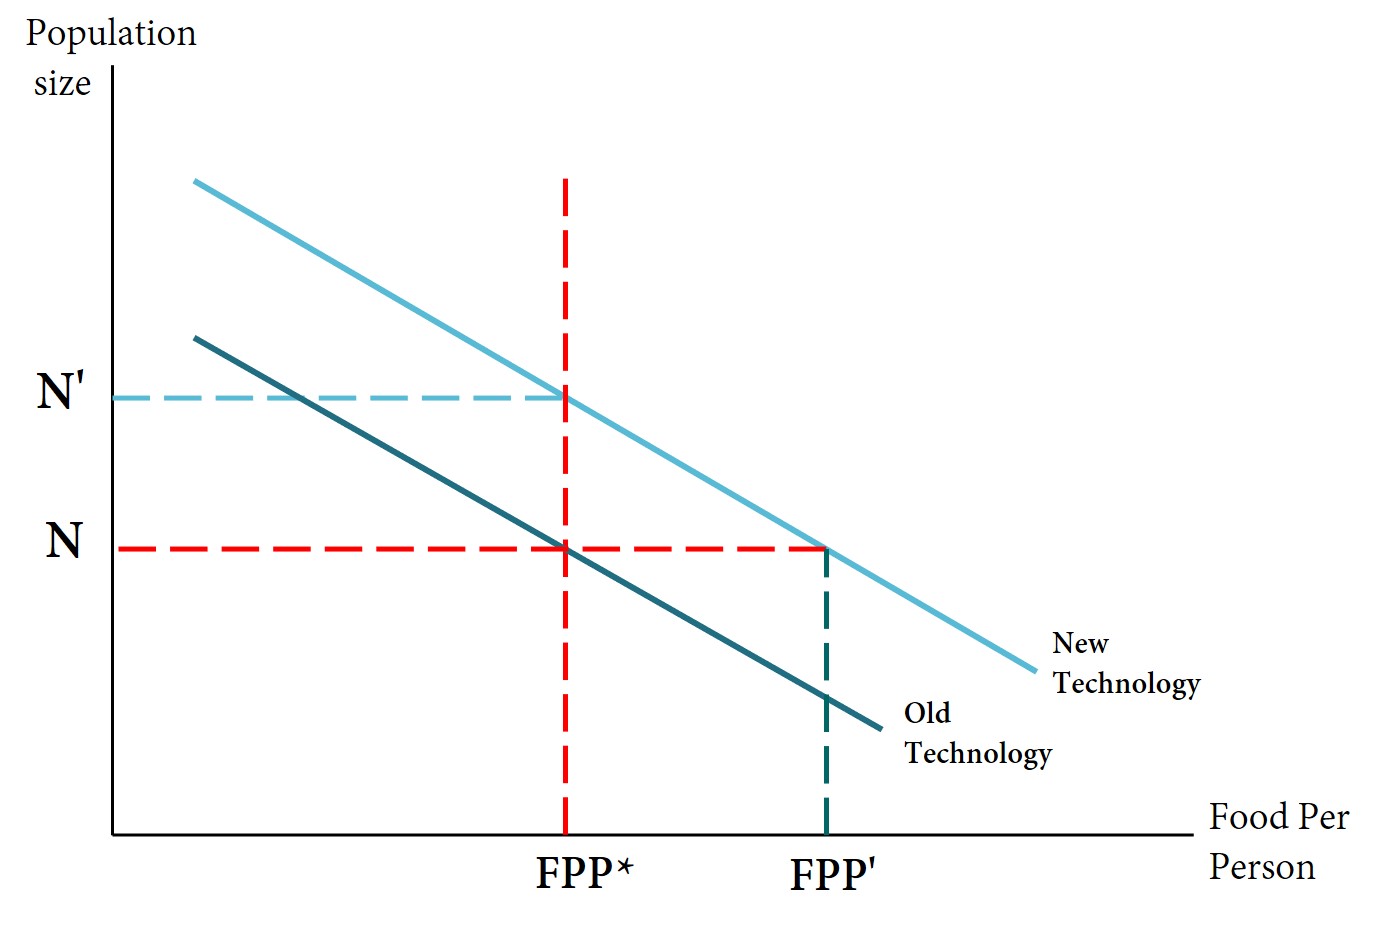
In Figure 2-3, the technology lines do not refer to birth control technology or medical technology. They refer only to technology that affects the ability of people to produce food/earn income.
Figure 2-3 shows that, because of technological limits, there is a trade-off between the population’s size and food per person. The technical possibilities might suddenly improve, because of good weather or a new invention; this is shown by the New Technology line being above the Old Technology line. With the New Technology, the original population of size N can now enjoy a higher level of food per person, FPP’. That sounds great; however, that improvement in food per person will set off population growth, reducing food per person. The economy will move along the higher technology line from (FPP’, N) to (FPP*, N’), ending up at the original level of food per person. Population growth falls back down to zero; however, the population is now higher than it was originally.

Malthus and others concluded from this model that it is pointless to help the poor. They reckoned that most people won’t use late marriage, birth control, and other “preventive checks”, so population will surge if people get more to eat. As population surges, resources will become scarce due to technological limits. “Positive” checks like disease, crime and warfare will hasten the return to the original level of food per person. Indeed, as we have already discussed, a growing population needs to have the means to support itself; if not, sad things can happen.
Before we become too discouraged, however, we should listen to our humanitarian values and take a more critical look at the model.
The first thing we can question is whether Malthus’ two main assumptions hold. Clearly, they do not hold in modern times. The birth rate is no longer simplistically and positively correlated with the standard of living. The global birth rate is trending down. And food production has grown much faster than population. The world’s population has grown and become better fed at the same time!
In some societies, for example where government is corrupt, markets rife with inefficiencies, international trade restricted, loans unavailable, and technology outdated, people may be very reliant on local resources and food systems. The Malthusian model would have some predictive power there. Most pre-industrial societies fit this description.
But even in those situations where a Malthusian equilibrium could be expected to exist, helping the poor is not, materially speaking, pointless. Giving a population size N a higher level of food per person than FPP* can accomplish important things for the economy.
First, the period of relative prosperity during which (FPP’,N) transitions to (FPP*, N’) in Figure 2-3 could accomplish several beneficial things. The population is catching a break. It is happier and feeling more secure with loved ones surviving. It plans and invests for a longer lifespan. It has greater health and strength and, possibly, motivation. It can use its (temporarily) extra income to invest in tools, infrastructure, and education. It has opportunities to trade, explore, and experiment. New technologies may be discovered that reinforce the increase in the standard of living. A positive feedback loop could develop as technology improves, food per person rises, and the new healthier population develops new technologies.
Second, the population grows larger, and a larger population is sometimes advantageous for reasons we will explore in Chapter 19.


Archeology, oral and written history, and literature attest to the fact that, prior to the Industrial Revolution which began around 1750 AD, humanity experienced a much lower standard of living and a much lower rate of population growth than what we have seen since then.
As observed and predicted by Malthus, many societies experienced close to zero population growth as well as a stagnant standard of living which was close to a subsistence level of food per person.
A traditional Chinese tale (Lily Toy Hong, 1995) explains that The Emperor of Heaven took pity on humanity’s struggle to find enough to eat. He sent the Ox star from the sky down to earth with the message that hardworking people would be able to eat well every three days. But the Ox garbled the message, promising three square meals a day. To keep His word, the Emperor of Heaven conscripted the Ox to help humans. Without its help, three meals per day would have been impossible.
![The Gleaners (1857). Painting by: Jean-François Millet [2]](https://ecampusontario.pressbooks.pub/app/uploads/sites/1262/2021/05/Jean-Francois_Millet_-_Gleaners_-_Google_Art_Project_2-1-scaled.jpg)
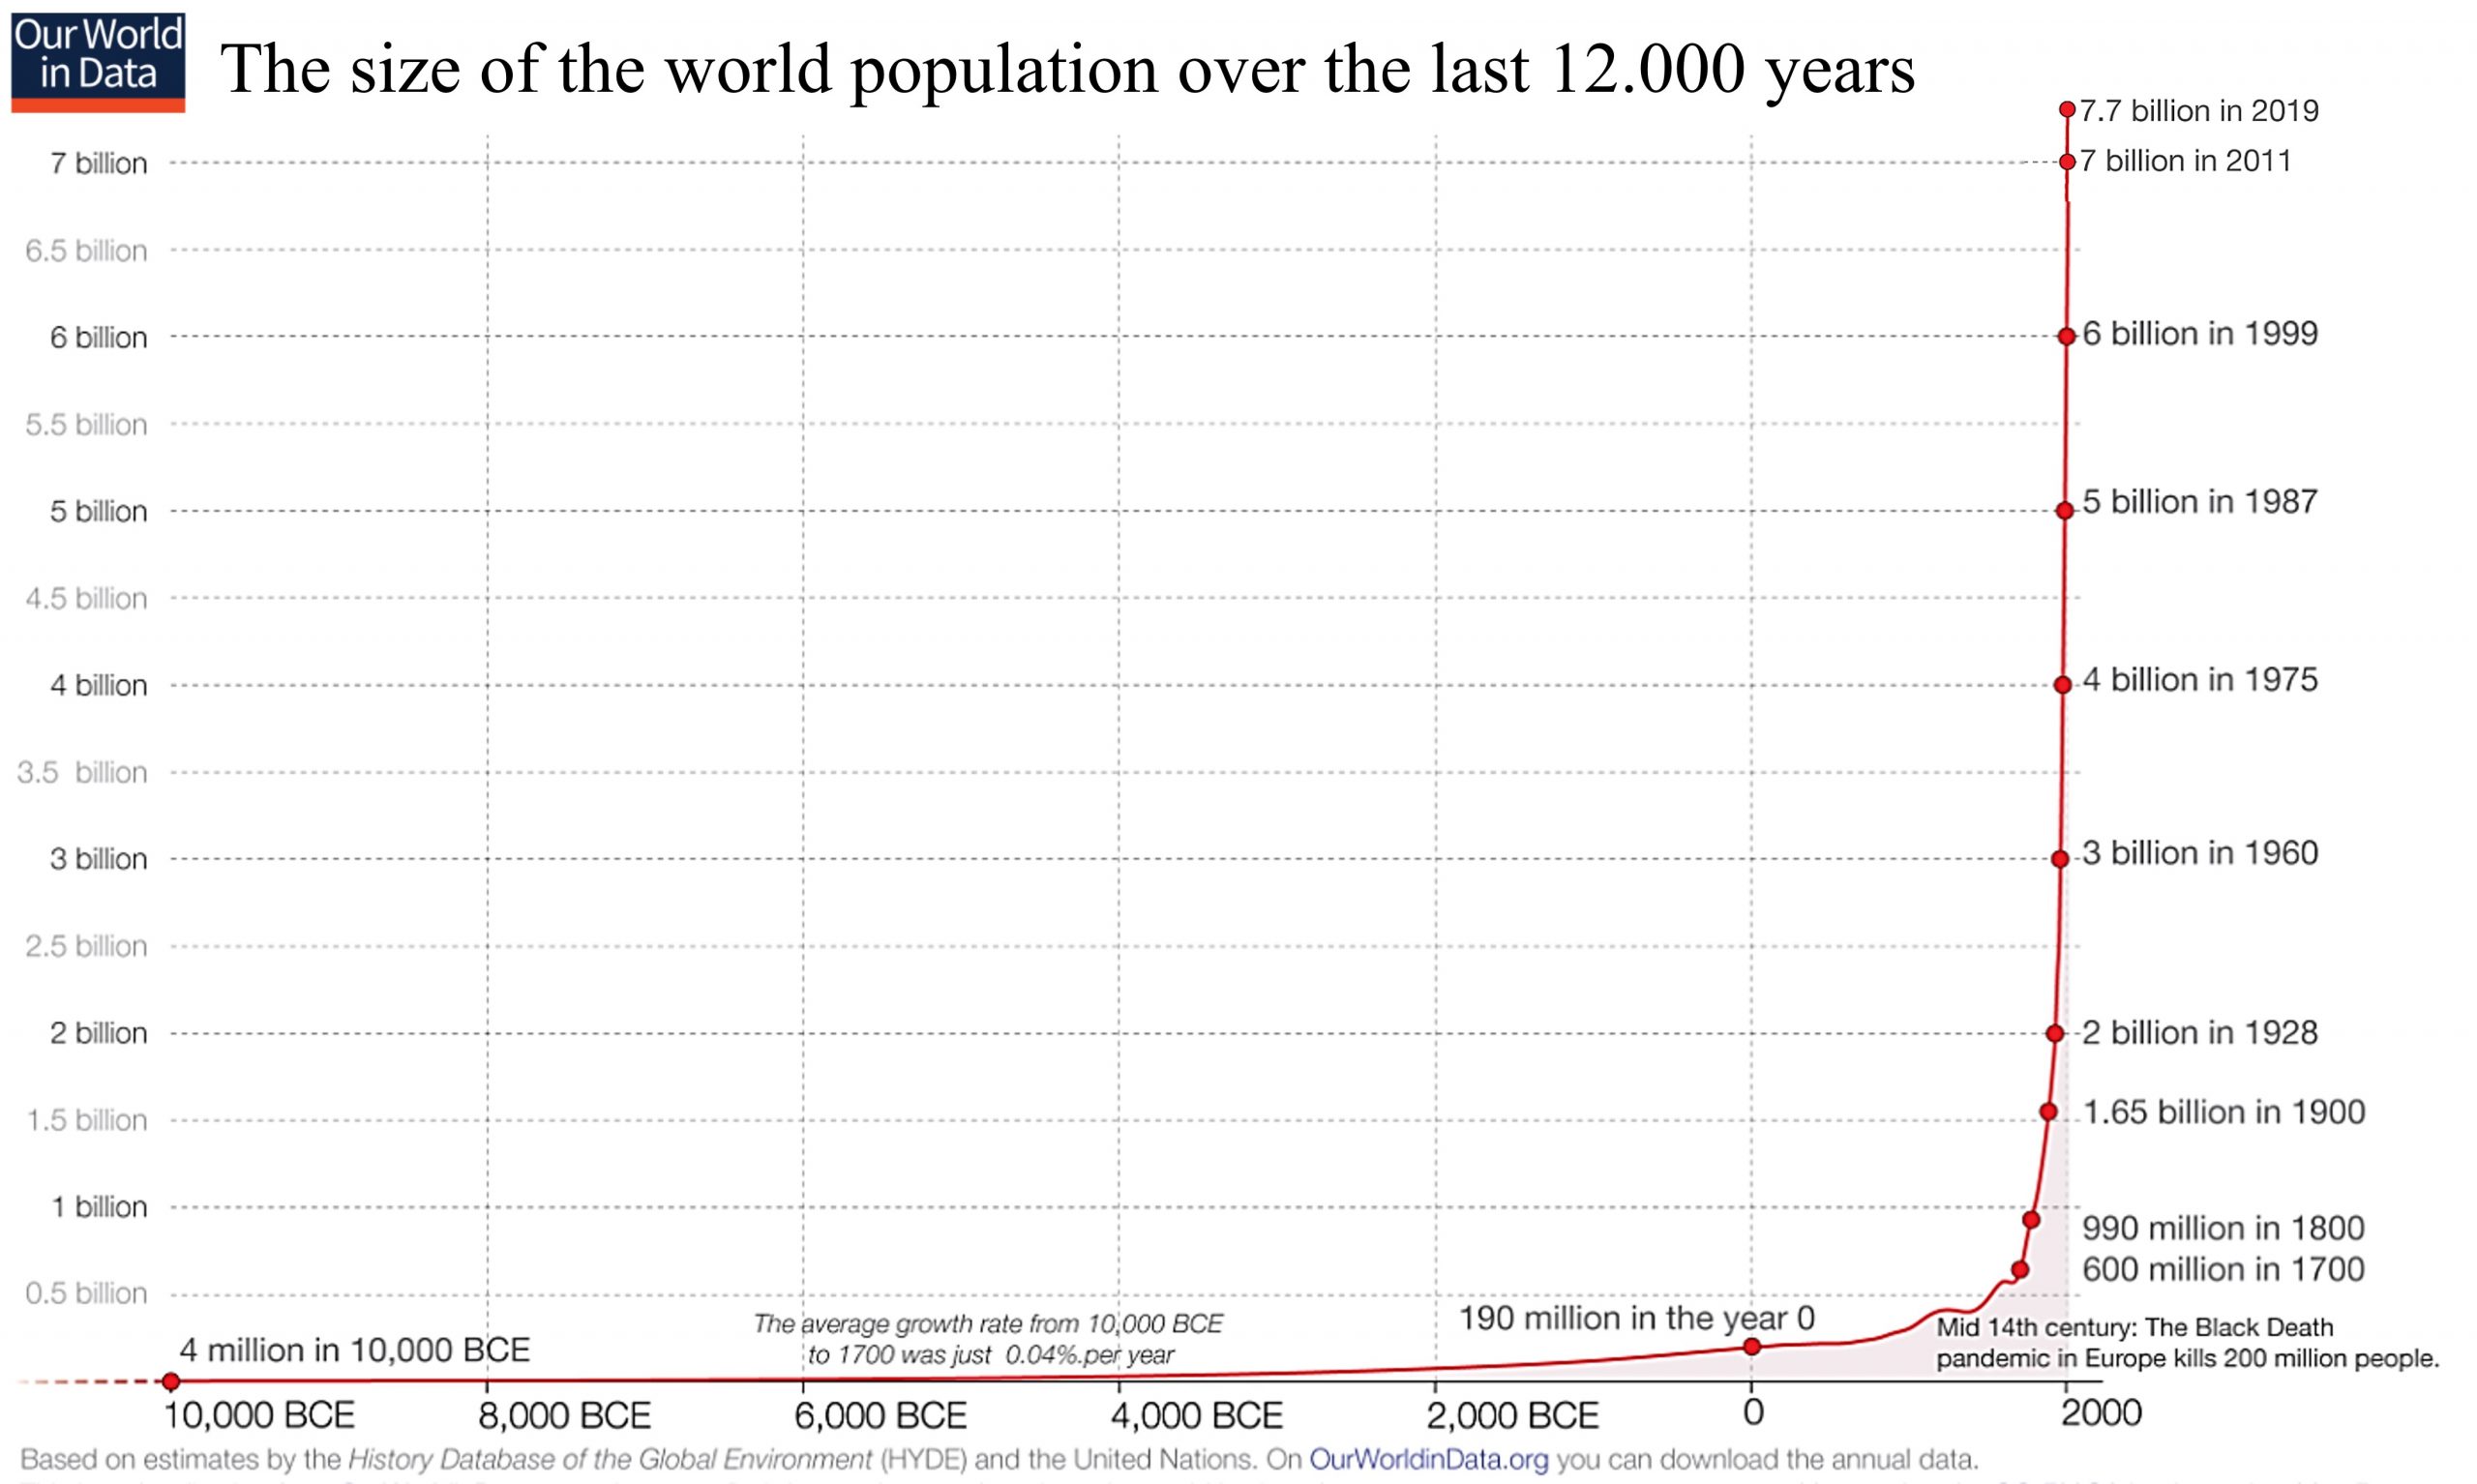
We know that there were times of prosperity for all; then again, there were terrible famines and the collapse of civilizations. The human population of our planet grew slowly until AD 0, with many reversals. The population growth that occurred was equivalent to that which would have occurred if the population had grown from 9000 BC at a constant exponential rate of 1/20th of one percent. Figure 2-4 shows the extremely gradual increase in population believed to have occurred in prehistoric times.
By AD 0, total population was probably about 300 million. After AD 0 the population continued to grow at the same modest pace, resulting in a population of about 790 million in 1750.

Before 1750, most people everywhere lived in poorly heated homes, experienced periods of famine, and died young. The slow rate of population growth prior to 1750 is attributed to:
-
- Low rates of technological change
- A standard of living so low that it left the population vulnerable to crises such as crop failure, pandemic disease, and war
- High chronic mortality rates which decreased when food per person increased
- Fertility rates significantly less than the maximum biologically possible
- Fertility rates which increased when food per person increased
We might also add, poking Malthus in the eye
- Income inequality and a lack of a safety net for the poor. With many people unable to participate fully in production, trade, travel, education etc., technological advancements were delayed or missed completely.
Malthusian-era Mortality Rates
The fact that mortality rates were high in pre-industrial times is no surprise. We all know how little technological and medical assistance was available to people back then. Their clothing, housing, and sanitation were crude. They gave birth without ultrasound, hand-washing, or sterilizing of equipment. They didn’t know about the need to boil water given to infants; there was no infant formula and no pasteurization of cow’s milk. They worked with crude tools and heavy livestock. Most people were employed in weather-dependent agriculture, hunting, fishing, trapping and gathering, without benefit of insurance. It is estimated that life expectancy at birth was between 20 and 40 years. (Life expectancy at birth includes the many infants that would have died shortly after birth in those days. So although life expectancy at birth was between 20 and 40 years, many people who made it to adulthood lived longer than 40 years.)
In pre-industrial times there was little sense that the government should work for peaceful international relations, provide for the poor, or stimulate the economy. There were more frequent violent conflicts between individuals, tribes, and nations.[1]
Malthusian-era fertility rates
Because we observe today that nations with lower incomes tend to have more children per woman, we might suppose that fertility was high in the pre-industrial era. It was indeed higher than it is today, but not as high as you might expect. Certainly fertility was NOT normally near 15 children per woman, which is the maximum biologically possible. For one thing, many women and men did not get married. Think back only 150 years in Canada, and you will recall from novels you may have read the many more “spinsters”, “bachelors”, priests and nuns. Poverty, social isolation of farming men, strict social norms around courtship and engagement, and high mortality rates for men in war and work meant that many potential couples did not unite.
Even within marriage, infertility, poor nutrition, length of time breastfeeding, women’s deaths in childbirth, and early widowhood (death of husband or wife) conspired to keep fertility rates lower than the maximum possible.
Estimates of pre-industrial fertility differ. Clark (2007, Table 4-2) estimates that the average woman in England before 1790 gave birth to about 5 children, not all of whom survived. Meanwhile, in New France (now Quebec), where farmland was readily available to colonists, the average married man of European descent had 9 children, but only 4.36 of these children would survive to have children of their own[2].
Among Indigenous peoples on Turtle Island before contact with European colonizers, families were apparently not large[3]. Most tribes had nomadic lifestyles, which would not be possible with a large number of infants, toddlers, and young children needing to be carried long distances. Population growth had to be balanced with the capacity of the natural environment to provide enough food through hunting and gathering. There is some evidence of infanticide among the people of the Plains and among the Inuit. Breastfeeding on demand inhibited conception to some degree.
Later
Mortality and Fertility have changed a great deal since 1750, when the Malthusian era began to give way in the wake of the Industrial Revolution. In our coming chapters we’ll take a look at
-how mortality and fertility changed
-how economic factors influence mortality, fertility, and migration
-how mortality, fertility, and migration translate into population growth, shrinkage, and aging
-how changes in population size, growth, and age composition affect the economy
-what models of population and economic change might replace the Malthusian model
But first we’ll talk about how we measure birth and death rates, and where our demographic data comes from.

1. Consider Figure 2-1.
a) When food-per-person surges above FPP*, what happens?
b) When food-per-person drops below FPP*, what happens?
c) When births drop at all levels of food-per-person, what happens?
d) When deaths drop at all levels of food-per-person, what happens?
2. According to Malthus, the equilibrium level of population growth is
a) unsustainable
b) high because people do not use preventive checks
c) low because, in the absence of preventive checks, positive checks cause death
d) zero
3. Briefly describe the following before 1750:
a) technological innovation
b) productivity
c) population growth
d) mortality
e) fertility
f) the standard of living
The standard of living measures how well off people are, materially speaking. It refers generally to the quantity and quality of food, housing, medical care, education, and recreation that they can afford.
Real income is income divided by a price index. The price index measures the cost of living. Thus, your real income measures how much stuff you can buy with your income.
The birth rate is the number of live births during the year, divided by the midyear population, all multiplied by 1000.
The death rate is the number of deaths in the population during the year, divided by the midyear population, all multiplied by 1000.
Ceteris paribus is a Latin phrase meaning "all other things being equal" or "holding everything else constant".
Life expectancy refers to expected life years remaining for the average person age x. If age is not specified, life expectancy refers to expected life years remaining for the average newborn.
