
The Demographic Transition poses economic and social challenges at each stage.
Young populations are typically rapidly-growing because the birth rate is high. The large number of children set to approach childbearing age means the birth rate will be high for some time. In this context, and especially if the economy is only beginning to modernize, loanable funds may be scarce and interest rates may be high. The capital stock may not be able to grow as quickly as labour, so worker productivity may be low.

Young populations face high young dependency. Governments and parents must budget for housing, schools, opportunities, and early childhood vaccinations.
The Demographic Dividend
The Demographic Dividend is possible when society is experiencing a drop in the Total Dependency Ratio. This typically occurs when the birthrate begins to fall and there are not yet many older adults needing care. At this point the working-age population and its government have an opportunity to invest their savings into infrastructure, research, and other productivity enhancements.
If jobs are available, banks are accessible and safe, inflation is low, and savings can be channeled into productive investments, this will be a time of economic growth. Policies that support this outcome are policies that make it easy for businesses to become established, get loans, and hire workers. The labour force needs to be healthy and have the necessary knowledge and skills.
With so much competition for jobs, young workers face more economic stress. Wages may be low due to the large labour supply or due to low productivity (if capital is scarce relative to labour). If young peoples’ expectations are not realized, they may become frustrated. There are more potential recruits for the army, and there are also more young people ripe for radical politics and tempted to act out their frustration.
The time of Demographic Dividend for today’s economically developed nations was between the mid 1960s and the early 2000s. While these countries may still have a large fraction of their population between the ages of 25 and 64, their opportunity to collect a Demographic Dividend is fading. Figure 17-0 show us that Europe, North America, Australia, and New Zealand, as well as East and Southeast Asia, are experiencing decreases in the fraction of the population that is of working age i.e. increases in total dependency. By contrast, the rest of the world is experiencing falling total dependency.

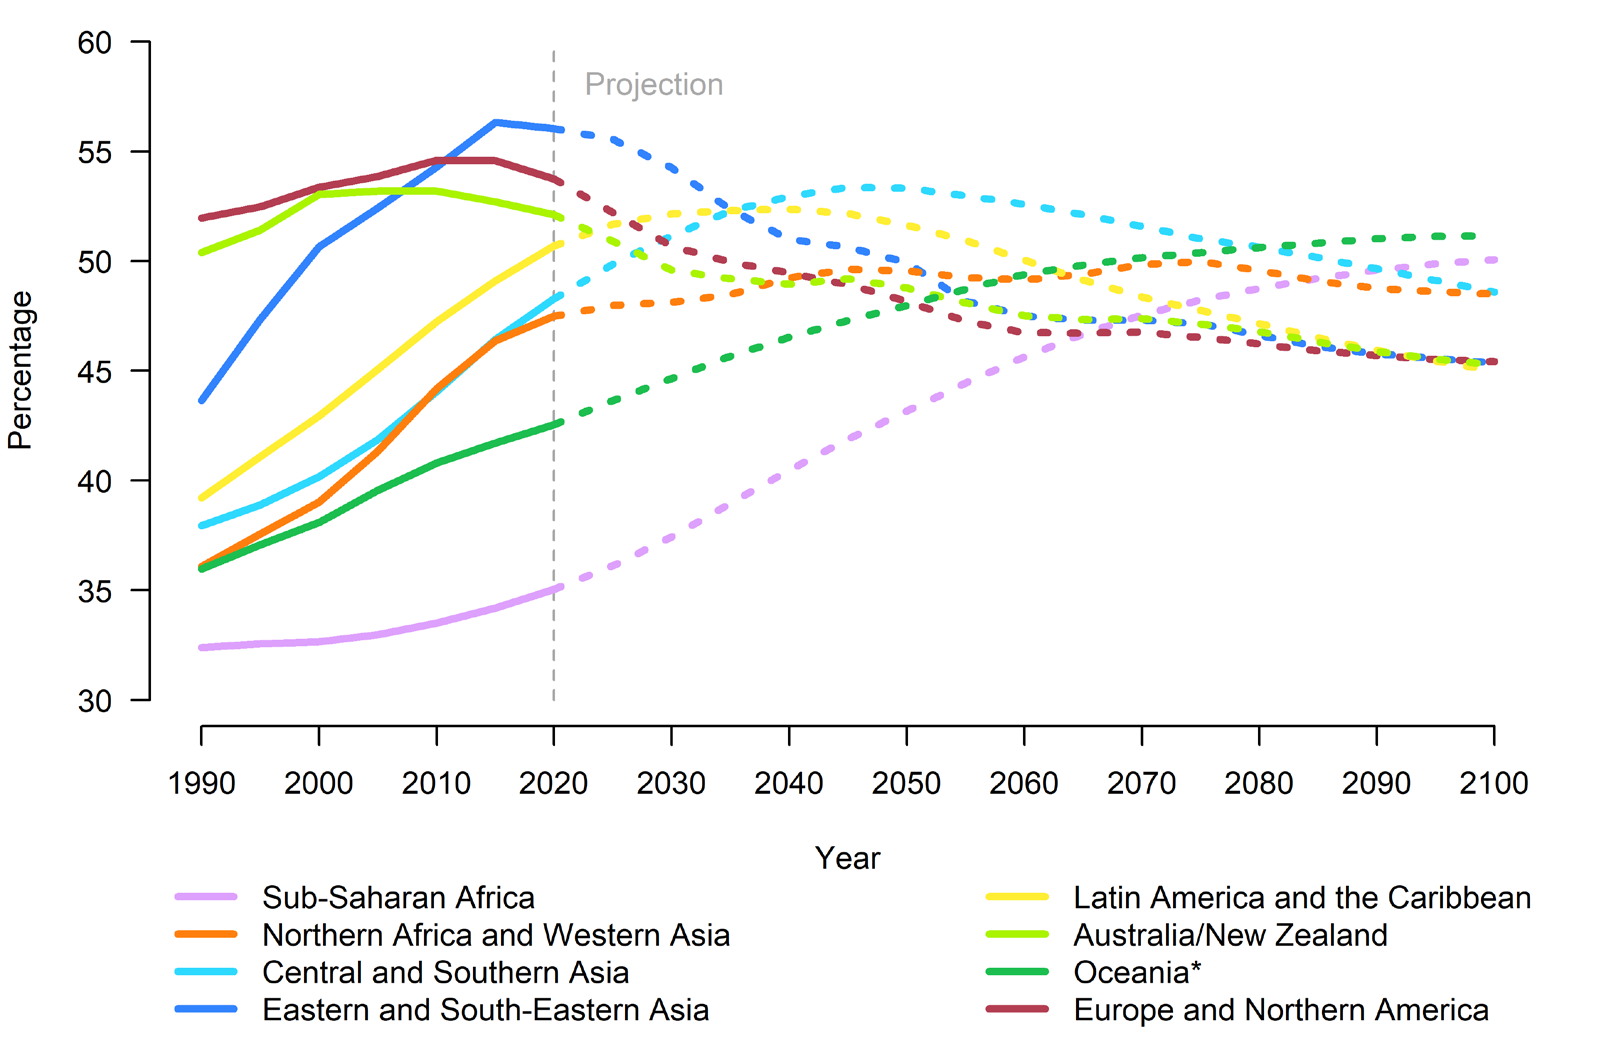
As indicated in Figure 17-0 above, Latin America, the Caribbean, North Africa, Central Asia, Southern Asia and Western Asia will achieve roughly their projected maximum L/N (fraction of population working) by 2050. Sub-Saharan Africa and Oceania will need more time than that to achieve a high L/N and hopefully experience the Demographic Dividend, because fertility rates and child dependency are still high there.
Morné Oosthuizen (2019) took a close look at South Africa’s age structure in the year 2015. As you might expect given South Africa’s racist history, different racial groups in South Africa were at different phases of the Demographic Transition in 2015. White South Africans were probably already experiencing the Demographic Dividend at the household level while many Black South Africans, who were on average younger, less socioeconomically privileged, and having more children, were likely not. It was unclear to Oosthuizen whether South Africa as a whole would soon experience a Demographic Dividend.
The Challenges of Aging Populations
Societies where the birth rate has come down almost to the death rate are growing slowly and have a large share of older adults in the population. Wages may rise as workers become more scarce. There may be some reduction in house prices as older adults sell their houses and move to smaller accommodations.
Interest rates should remain low as retired persons do not immediately deplete their savings, and because the average worker is older and is saving a great deal. The government must spend more on pensions, medical care, and residential care, while the number of workers to tax may be falling.
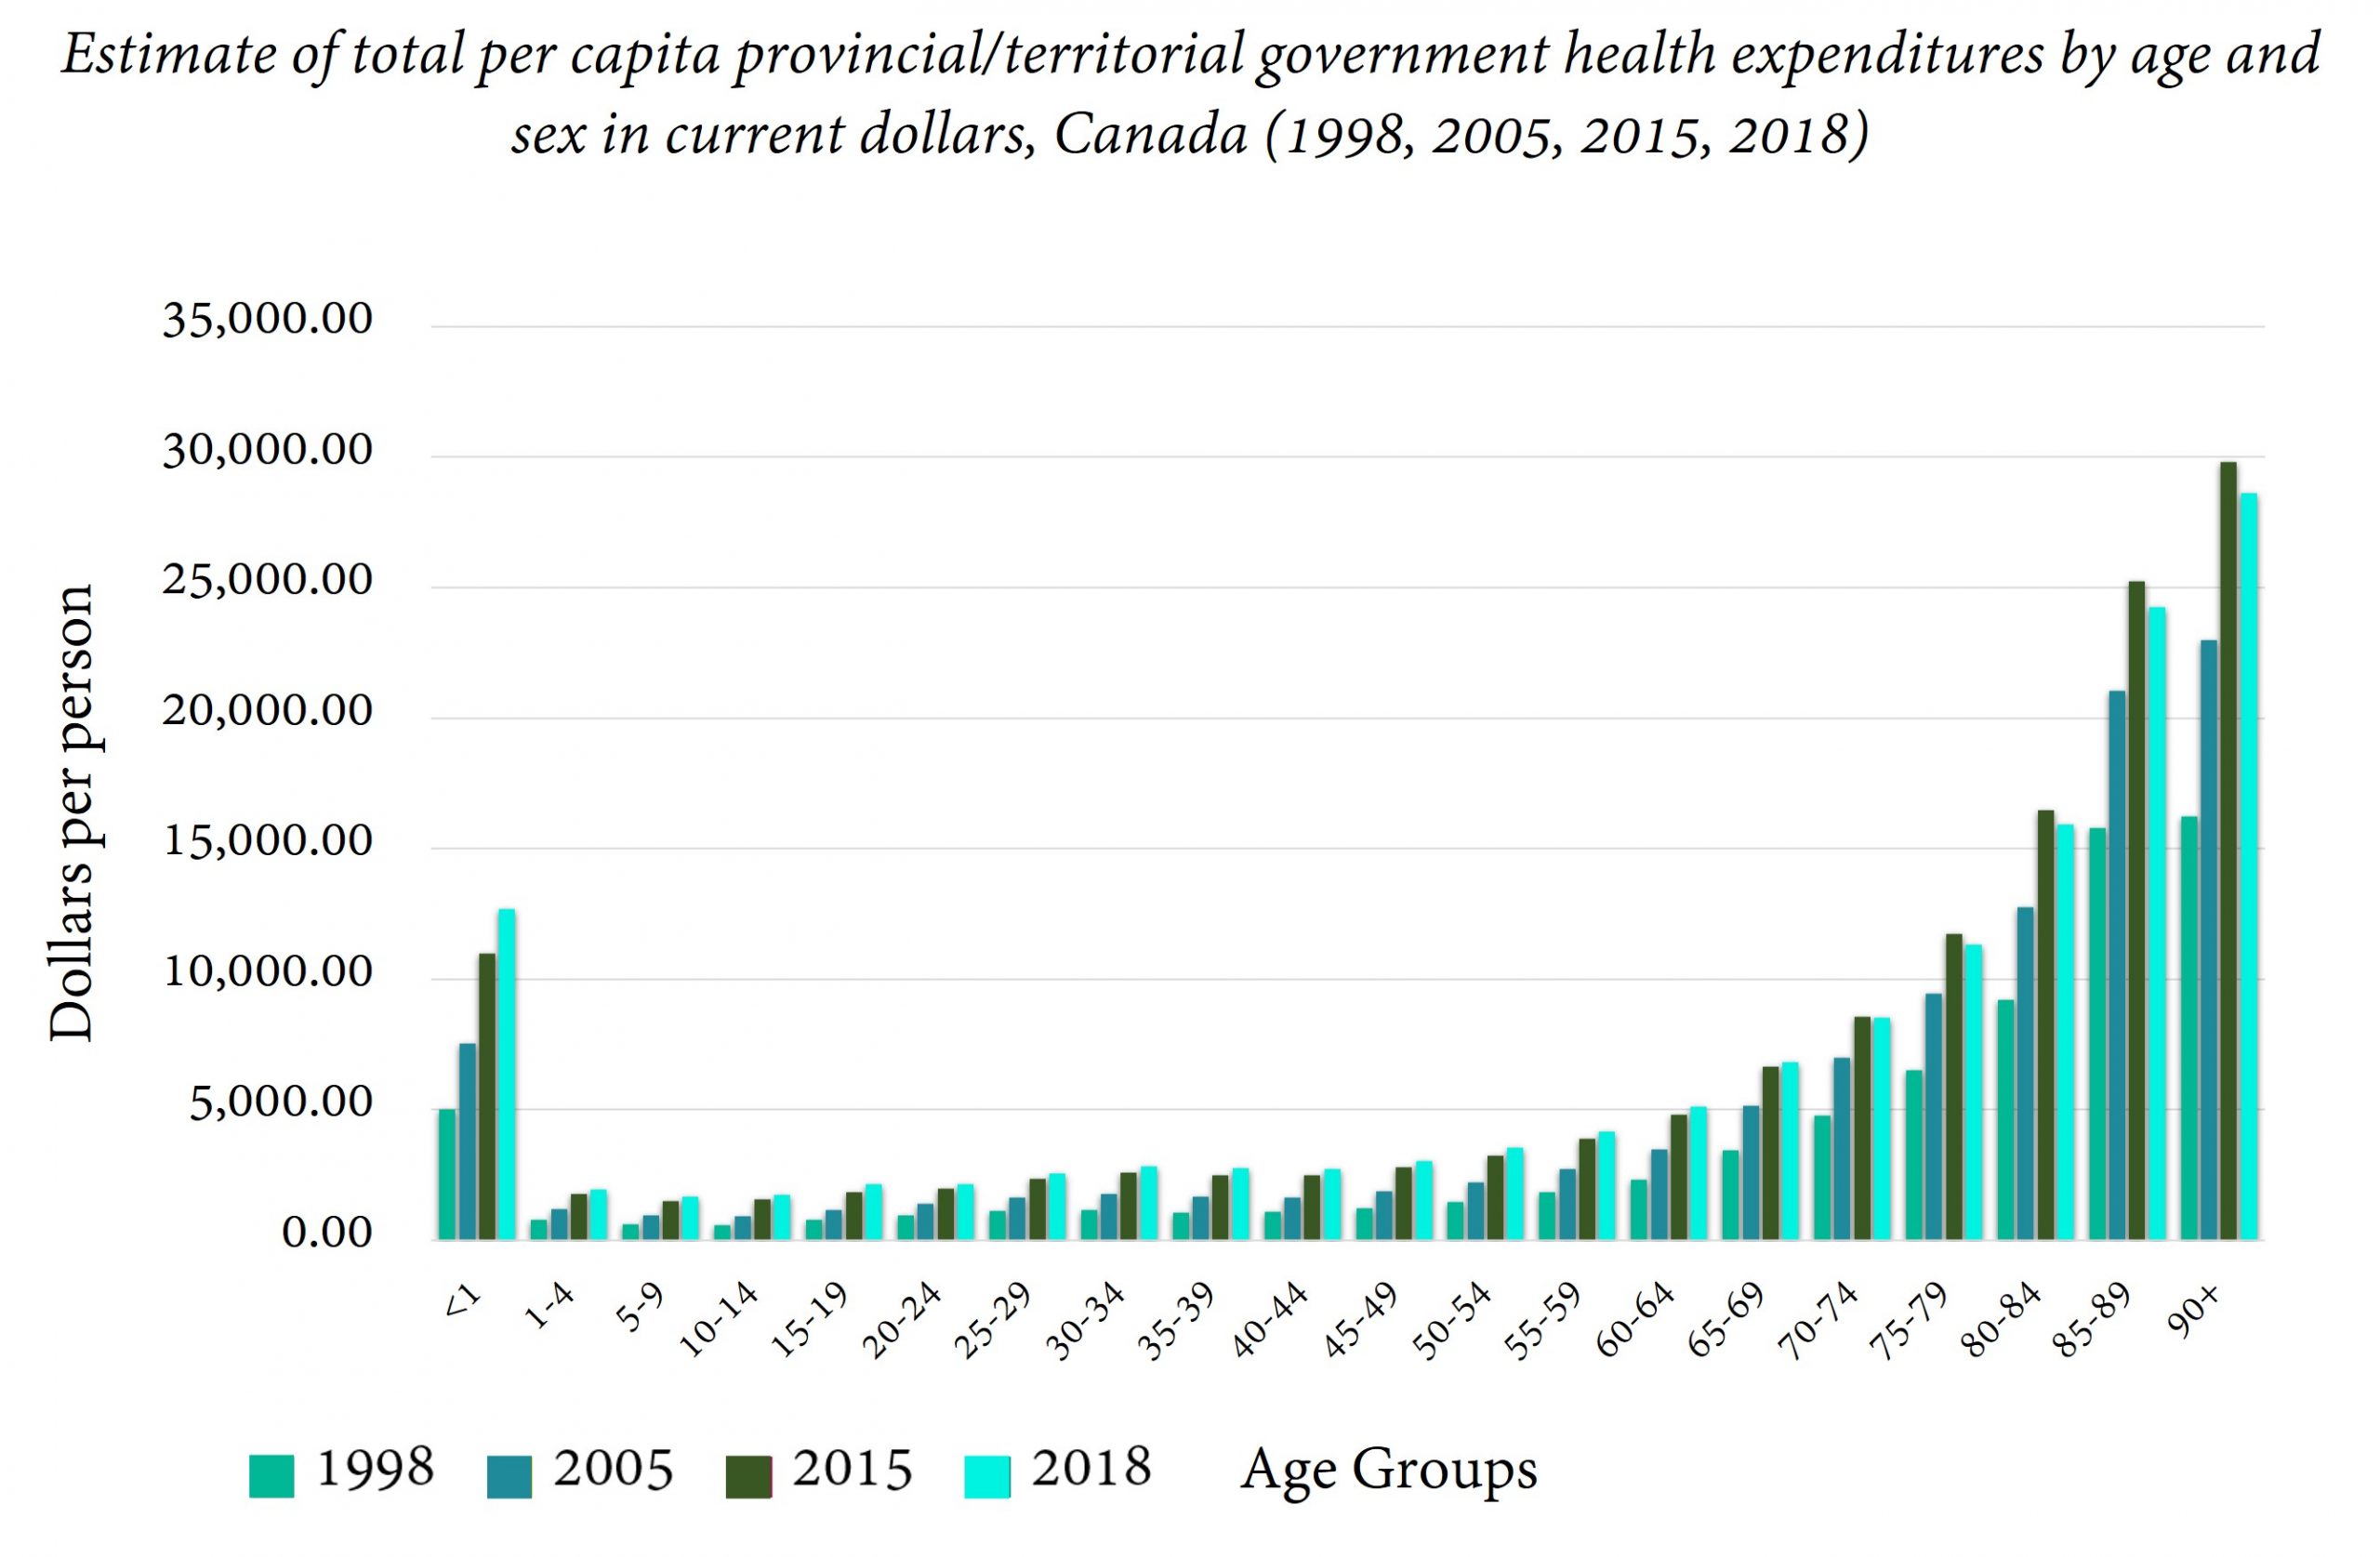
We think of older adults as requiring a great deal of medical intervention; it is true that, around the world and in Canada, more money is spent per older adult on health care than per younger adult. Figure 17-1, which totals federal and provincial/territorial spending, illustrates this.

While it is true that health care expenses rise with age, the extra expense due to the aging of the population is not as runaway as it may seem. The next diagram shows that annual health care spending by the different levels of government in Canada rose about 1% because of aging and 1% because of population growth between 2000 and 2019. While old people are more expensive medically, aging is not happening so quickly as to be the leading cause of rising medical costs.

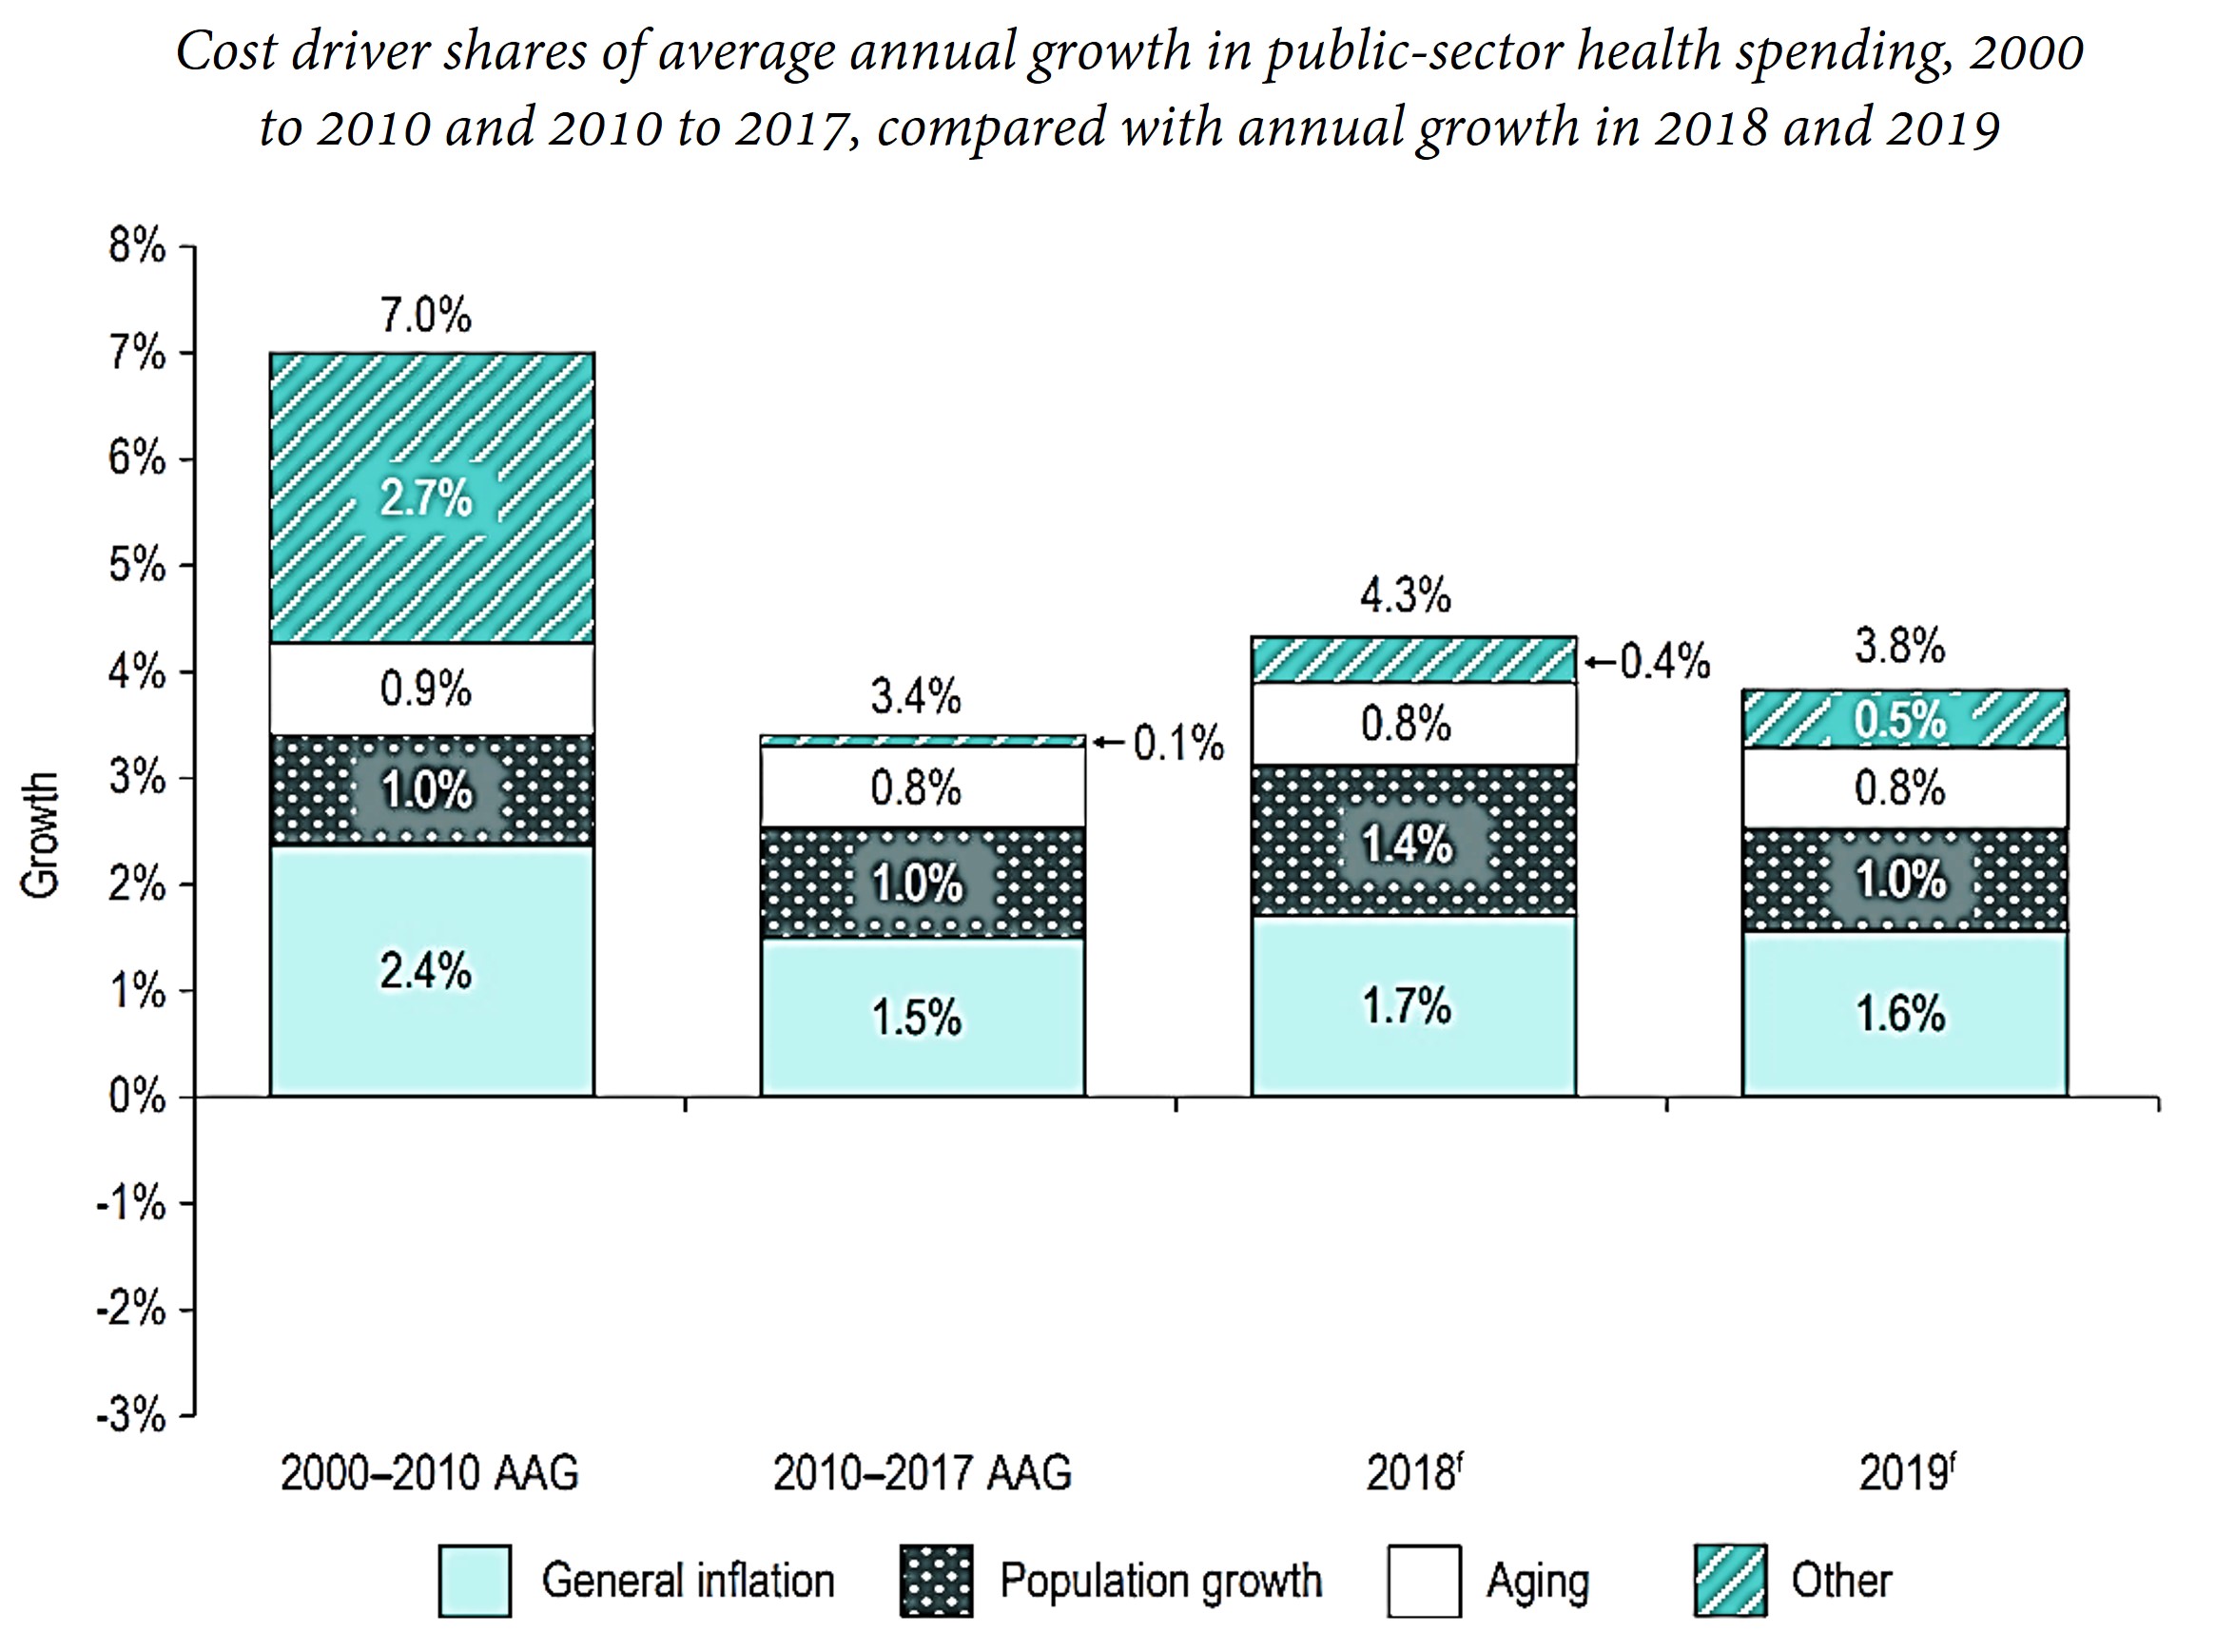
Source : Figure 16 of Canadian Institute for Health Information (2019)In their study of rising health care costs in British Columbia between 1996 and 2006, Morgan and Cunningham (2011) noted that most of the increase in cost could be explained by the increased use of specialists and the increased use of diagnostic tests. They also found that improved survival rates for older people reduced hospital spending by 0.3%. When older people are healthier, the medical interventions they eventually need are compressed into the last months or weeks of their lives.
If older people find that they have inadequate supports and opportunities to maintain their standard of living, they may become more conservative in their politics. There is a tendency for older voters to support nationalist, anti-immigration parties. This may also be part of cognitive and emotional changes that occur with aging. Older people may feel more vulnerable as their physical strength diminishes and as technology and social norms change rapidly. They may find themselves targets of scams that exploit deafness, confusion, unfamiliarity with technology, and concern for family.
Benefits of Aging Populations
Let us remind ourselves that, in the words of Bloom et al. (2003), “an aging population is, fundamentally, a mark of development success.” We’ve all wished to live a long life, and we’re having it. Many have wished that population growth would slow down, and it is. Aging is a consequence.
Knowing that we have more life years remaining to us may motivate us to invest in our human capital, our relationships, our societies, and our natural environment. Haiming Li and Xiuli Zhang (2015) show that increases in life expectancy at birth were correlated with increases in human capital investment, labour force participation, and savings in China between 1982 and 2012.

A society’s older adults often help hold families together: they can provide love, child care, advice, financial support, and a sense of one’s place in history. In cultures indigenous to Canada, and in many other cultures, Elders are honoured for their roles as keepers of tradition, masters of craft, and witnesses of history. Research by Rachel Caspari (2011) regarding prehistoric human communities indicates that only the most recent human societies had a relatively high Aged Dependency Ratio, and she speculates that there was a positive feedback loop between the standard of living and the survival of older adults.
Aging Trends
According to Statista.com, the median age in the entire world was 30.9 years of age in 2020, up steadily from 21.5 years of age in 1970.
As we saw in Chapter 6’s Figure 6-1, life expectancy has been improving all over the world. In 1950, life expectancy at birth for the average person was 46.5, compared to 72 in 2020[1].
The Aged Dependency Ratio is increasing in much of the world, especially in Central and Eastern Europe (from Germany to Russia), China, Taiwan, Japan and South Korea, and the Northern Mediterranean (Italy, Serbia, Greece, Romania). Often, double aging is occurring: the proportion of people over the age of 65 is increasing, and the average age of people over the age of 65 is increasing also.
In Canada, in 2022, almost one in five workers was nearing the age of retirement (Zimonjic, 2022); the consequences of aging on the labour market were slightly mitigated by the fact that people were retiring later.
The government, the media, and the average citizen in Canada have for some time believed that continued labour force growth is necessary to our prosperity, a belief challenged in our previous Chapter.
Aging and Intergenerational Fairness
We mentioned that older adults may become more conservative in their politics if they feel economically vulnerable; conversely, young people may embrace populists who promise freedom from the economic burden of providing for retirees. How can a society promote goodwill and fairness among generations?
A baseline level of fairness is achieved when we offer every person basic human rights from birth until death. In Canada, that package of rights includes publicly funded education, publicly funded healthcare, and income support for people below the poverty line. Each successive generation, assuming it lives longer than the previous one, will enjoy this package for longer than the previous generation, so the young people working to pay for these benefits should have at least as much to look forward to.
This assumes that younger generations have confidence that the program is sustainable. When governments have to borrow in order to pay for health care or pensions, young people may rightly question whether the programs will last long enough to serve them.
Professor Paul Kershaw (2023) of UBC has concluded that Canada’s baby boom generation, born between 1946 and 1964, did not pay enough taxes during their lifetime to cover everything they can expect to receive from the government in retirement. Before we blame them, let’s consider that during their working lives, no one could foresee how long they would live, how medical science would improve, and what entitlements would be offered to them.
Governments in the West have gotten used to living beyond their means, partly because they can borrow at favourable interest rates, sometimes below the rate of inflation. Citizens of less economically advanced or less politically stable countries are eager to acquire western currencies and financial instruments, especially the US dollar and US Treasury bonds.
Another reason that western baby boomers – and the governments they elected – didn’t live within their means is that they assumed that tax revenues would always grow because of productivity improvements and population growth. Tax revenues did grow automatically as the labor force grew and as its productivity grew, thus individual workers did not need to pay much tax. This was the logic behind Canada’s pensions system before its revision in 1998.
Two Basic Types of Government Pensions
Many people collect pensions from their former employers, but here we will discuss pensions that come from the government. If the money for these pensions comes out of current tax revenues, we call the pension plan a pay-as-you-go pension. Working-age people are taxed, and the money collected from them is used to pay people who are currently retired.
A pay-as-you-go plan is affordable so long as the population is young and growing. With each working age cohort larger than the previous one, workers do not have to be taxed very much to provide for the much smaller cohort of retirees.
Canada, the United States, and western Europe have been criticized for saving too little for pensions and health care for retirees. We got used to our tax revenue increasing every year just because the working-age population was growing. We could “grow our way out of deficits.”[2].
In 1998 the Canadian government realized that the rate of population growth was falling and that the ratio of workers to retirees was falling also. Workers would have to be taxed more and more to provide the promised pensions. So Canada began to convert its pay-as-you-go pension plan to a fully-funded pension plan. In a fully-funded plan, the workers are taxed but their money is set aside in a fund to earn interest and provide for their own pensions in the future. The affordability of this plan depends on the interest rate being high enough. In fact, it can be shown that, if the interest rate is higher than the rate of population growth, the fully-funded plan requires less taxation of earnings than the pay-as-you-go plan. If the interest rate is lower than the population growth rate, the pay-as-you-go pension plan is the more affordable one.
Canada was not able to switch from a pay-as-you-go plan to a fully-funded plan overnight; indeed, as of 2023 the plan was still not fully funded. In 1998, the existing retirees still needed to be paid, and there was no money saved up for them. So, beginning in 1998, the Canadian government increased the amount of money collected from workers, using much of it to pay for current retirees’ pensions according to the usual pay-as-you-go plan, and using the rest of the money to save for future retirees.


The Math Behind Pensions
We can calculate what the pension contribution should be in a pay-as-you-go pension scheme. We’ll use the math from Chapter 14, the math we used for a stable population growing at rate n. Let s(x) be the survival rate from birth to age x. Then for any NN newborns, there will be NNe-n s(1) one year-olds, NNe-2n s(2) two years-olds etc. For simplicity, we’ll also assume that everyone over age 18 works and that everyone works fulltime.
The number of people of working age is:

Similarly, the number of retired people is:

If we want to give each of these retired people one dollar by charging each of the working age people a pension contribution of p, we’ll have to set: Rearranging,
You can see that, the more retired people there are relative to working age people, the higher the pension contribution must be.
In fact, the pension contribution rate $p = the Aged Dependency Ratio. In a pay-as-you-go system, the higher is the ADR, the higher pension contributions must be.
Also, the higher the population growth rate n, the lower the fraction of retirees will be, and the lower the pension contribution needs to be.
No big surprises there. The big surprise is that we can do almost exactly the same math for the case of a fully-funded pension. For a fully-funded pension, the relevant parameter is not the population growth rate “n” but the interest rate earned on savings, call it “r”. For a fully-funded pension, it’s not relevant how fast the population is growing. What’s relevant is how fast the savings are growing.
If we’re tracking money through time, we have to incorporate the fact that money now is actually worth more than money later, because money now can be invested. Just as $1 at birth might be equivalent to receiving $5 eighty years later, receiving $1 at age 80 might be equivalent to receiving 20 cents at birth. Shrinking the $1 received at age 80 down to a value of 20 cents at birth is called discounting.
We are going to express the value of any pension contribution or pension payment in terms of what it is worth at the date of birth. We have to pick one date, so it might as well be birth.
This time we’re not using NN (the number of newborns) and shrinking that down by e-nx to give us the size of the group which is age x. Instead, we are shrinking the value of money received at any age x by e-rx to give us its value at the time of birth.
 Again, x is your age, the number of years that have gone by. s(x) is your survival rate to age x because there’s some chance you won’t make it to age x. If you don’t make it to age x>64, the government won’t have to pay you a pension. Using survival probabilities allows us to generalize the individual case to the wider population.
If you want to receive one dollar every year that you are retired, how much does your annual pension contribution $p have to be during your working years? Rearranging the previous equation, we get:

The longer you can expect to live after working, the higher the pension contribution must be. And the higher the interest rate r, the less you need to contribute and save.
The math for both pension schemes is identical, except that one uses the population growth rate and one uses the interest rate on savings. So, roughly speaking, a fully-funded pension scheme will require a lower pension contribution rate than a pay-as-you go pension if the rate of interest is higher than the rate of population growth.
How much should pensioners receive?
Our math tells us the minimum amount we need to collect from workers for every $1 we want to give to retirees. But it doesn’t tell us how much we should give to retirees. Pension payment decisions are just one kind of the many decisions governments make that affect our lives.
We use generational accounts to explore whether the government’s overall system of taxation (including mandatory public pension contributions) and transfers (including public pension payments) is fair.
A generational account at year y for a person age x, represented by GA(y,x), is the present value (at year y) of all the taxes and all the transfers the average person age x will have to pay as time t progresses from date y to the end of the person’s life at Max Age.
Using the math we are becoming familiar with, we can write this as:

where Max Age – x is the remaining years of life for an individual age x, and s(x) is the survival probability to age x.
Check out Figure 17-3. It plots the Generational Accounts for Portugal in 2010 by age.

Think of this graph as a graph of “net tax payments remaining” for a person age x. What do we see here? We see that the present value of all the taxes a baby born in Portugal in 2010 could expect to pay over their lifetime, net of subsidies, was about $80,000 USD, assuming that today’s tax and subsidy rates persist. This is not necessarily unfair. A positive amount of net tax being paid over one’s lifetime means that the government has money to spend on public goods like research, environmental protection, and national defense.
According to Figure 17-3, people about to enter the workforce in Portugal faced the steepest net tax bill, because the tax-paying phase of their life was near. By contrast, a 46-year old living in Portugal in 2010 could expect to pay zero net taxes for their remaining life. Anyone older than that would receive more transfers than taxes for the rest of their life. But people older than 63 had lower expected net transfers to collect because they had fewer years of life remaining.
It might occur to you, that, to be intergenerationally fair, the generational account should be the same at each age. This is not possible: the tax potentially paid by a newborn cannot be the same as the tax potentially paid by someone who has hardly any time left to live.
What if the generational account for newborns never changes, regardless of when they are born? Then the value of lifetime net taxes never changes from generation to generation.
Let’s use that definition of Intergenerational Fairness:
Intergenerational Fairness can be said to exist when each generation faces the same tax costs and subsidy benefits over its lifetime.
We don’t have the raw data on which Figure 17-3 is based, but imagine that we multiply the Generational Accounts by the number of people in each age group at the time (2010). So $80,000 for each newborn multiplied by the number of newborns, then the level of the graph at age 1 multiplied by the number of one year-olds, and so on. Add up all that money to get the present value of the net amount that the government of Portugal can expect to collect from all the Portuguese people alive in 2010. If that amount is equal to or greater than the Portuguese government’s debt in 2010, fine. If not, the Portuguese government is going to have to find some more money to pay the difference; it’s likely that future generations will have to pay this net debt. Bernd Raffelhüsen (2001) estimated that, in 1995, European Union countries were living above their means: future generations would have to pay 54% more in net taxes to pay off the net debts of their countries.
If future generations will have to pay more tax than the current generation, then our tax and subsidy system is not intergenerationally fair. To achieve intergenerational fairness we will have to do some combination of paying off our debts, raising taxes, and reducing subsidies. This is what Canada began to do in 1998 when it raised pension contributions (from workers’ pay) and saved some of that money for the next generation of retirees.
The editors of the Globe and Mail (“A long-term plan for long-term care,” March 14, 2023) have proposed that the Canadian government now institute an additional 1.5% payroll deduction , matched by employers, to be saved on behalf of each worker in a public Long-Term Care insurance (LTCI) fund. Their idea is that the government would use the money in this fund to pay for mobility aids, home care, nursing-home care, and palliative care when and if needed. People whose LTCI savings do not add up to enough to pay for their care would not be denied necessary care.
Environmental Sustainability
Another aspect of intergenerational fairness is whether the current generation is using natural and environmental resources sustainably. We will examine that issue in our next two chapters. For now, we can assume that, if we are not using resources sustainably, then taxes or borrowing will have to go way up in the future as we face the cost of environmental remediation, clean-up, substitute technologies, and sourcing of scarce natural resources.

- What is required for a baby boom to yield a demographic dividend?
- What’s good about an aging population?
- How does aging affect GDP per capita?
- How does aging affect a nation’s “net debt” as defined in this chapter?
- How can a nation prepare for rising aged dependency?
The amount you would be willing to pay today for the privilege of receiving $x tomorrow will be some $y<$x. We say that this $y is the present value of $x. Generally, we calculate the present value of $x received t years from now to
be equal to $x divided by j, where j =(1+r) raised to the exponent t. "r" is the relevant interest rate. An additional adjustment can be made for inflation.
Intergenerational fairness means treating different cohorts of people equitably. One definition of intergenerational fairness is that each cohort or each generation of people can expect the same net tax burden over their lifetime, i.e. the same generational account at birth.
