

While non-economic factors such as relationships, self-esteem, and risk tolerance affect mortality, income plays a significant role.

Purchasing power or individual income
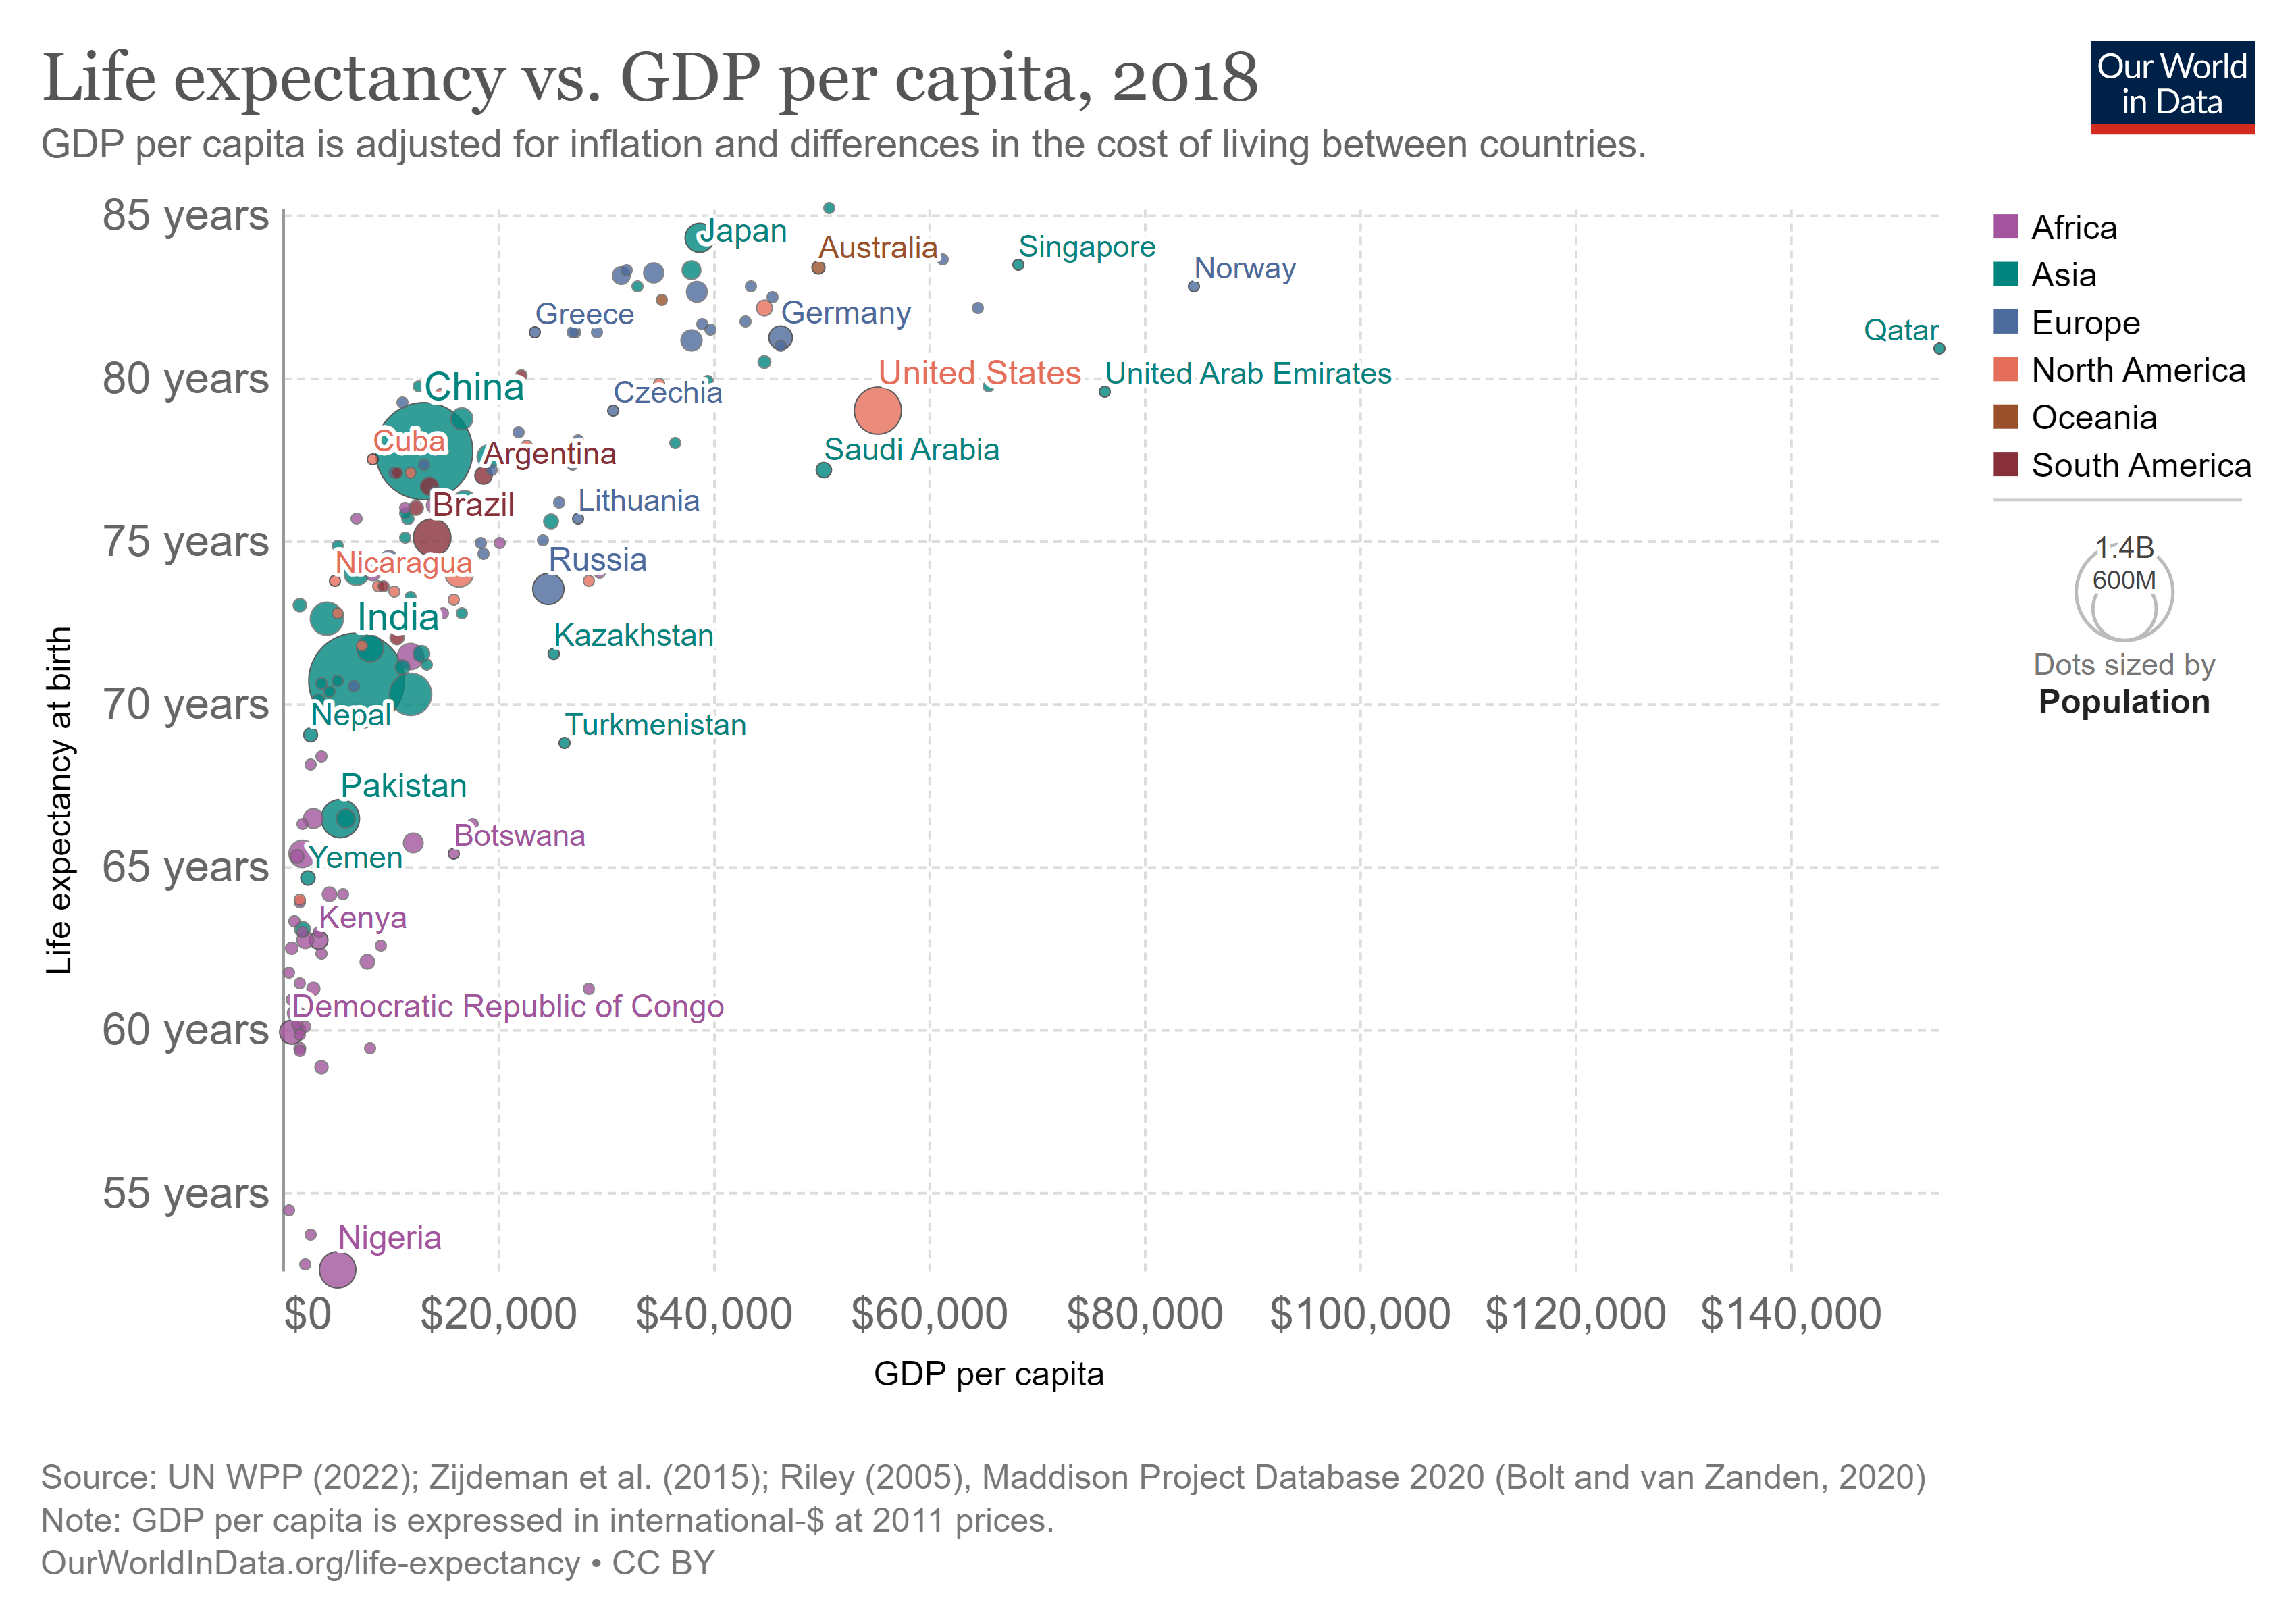
It makes common sense that the richer you are, the better able you are to afford good nutrition, shelter, and medical care. You are more likely to be literate and educated, which helps you make better informed choices concerning your health. Indeed, life expectancy is higher for individuals with greater income.
Chetty et al. (2016) tracked 1.4 million Americans between 1999 and 2014 and found that expected life years remaining – specific to a particular year, age, sex, race, and location – increased with income. For men age forty and older, there was a 14.6 year gap in life years remaining between those in the bottom 1% of income earners and those in the top 1% of income earners. For women age forty and older the gap was 10.1 years. The gap was unfortunately increasing over the time period studied.
In the United States in 2017, Black men had a life expectancy at birth 4.6 years below non-Hispanic White men[1]. Economic disadvantage would be a major reason why. For Black women the gap was 2.9 years. However, Hispanic (Latino) women had a higher life expectancy than White women, by 3.3 years, indicating that income is not the whole story. Similarly, Hispanic men had a 3-year advantage over White men. This phenomenon of a higher life expectancy for the lower-earning racial group is known as the Hispanic Paradox.
Another apparent paradox is the fact that, since 1900, African Americans age 75 and older have more life years remaining than White Americans age 75 and older. That is to say, once age 75 has been reached, Blacks are more likely than Whites to live longer. This Black-White Crossover Effect could be an instance of the Paradox of the Life Table. If the Paradox of the Life Table is indeed the primary explanation, it speaks volumes about the hardships experienced by Black Americans before the age of 75: those who make it to age 75 are stronger than the typical White American person age 75.
Canada has a similar story to tell. Although Canada did not collect death statistics by race up until the early 2020s, estimates of life expectancy by Indigenous identity had been computed a few times. Those estimates presented cause for concern.

National Income

 Income Inequality
The Business Cycle
Stephen Bezruchka (2009) confirmed a pattern first observed in Ogburn and Thomas (1922): for richer nations, mortality follows the business cycle, rising during booms, and falling during recessions. Though suicide rates increase during recessions, and degenerative diseases such as cancer seem unaffected by the business cycle, mortality rates for infants and mortality rates from accident, infection, and other diseases actually fall during recessions.
Taking a look at Canadian data between 1960-2020[3], we find a correlation coefficient of -0.52 between the unemployment rate and the infant mortality rate, indicating that infant deaths tended to decline when unemployment increased (1 means perfect positive correlation, -1 means perfect negative correlation, and zero means no correlation). It is almost the same at -0.51 when 2020, the first year of the pandemic, is excluded. When we compare infant mortality to the previous year’s unemployment rate, the negative correlation is almost identical at -0.51, with the effect a slightly stronger (-0.53) if 2020 is excluded.
Dehejia and Lleras-Muney (2004) studied pregnancies and births in the United States between 1975 and 1999. They found that, although fewer babies were conceived in times of high unemployment, they were born healthier. Women pregnant during recessions were more likely to be between 25 and 35 years old and to attend prenatal care appointments. Black women pregnant during recessions were better-educated and more employable than Black women pregnant at other times, and were smoking and drinking less, though White women pregnant during recessions were less educated and lower income and tended to increase their smoking and drinking.
The following table brings other relevant issues to light.

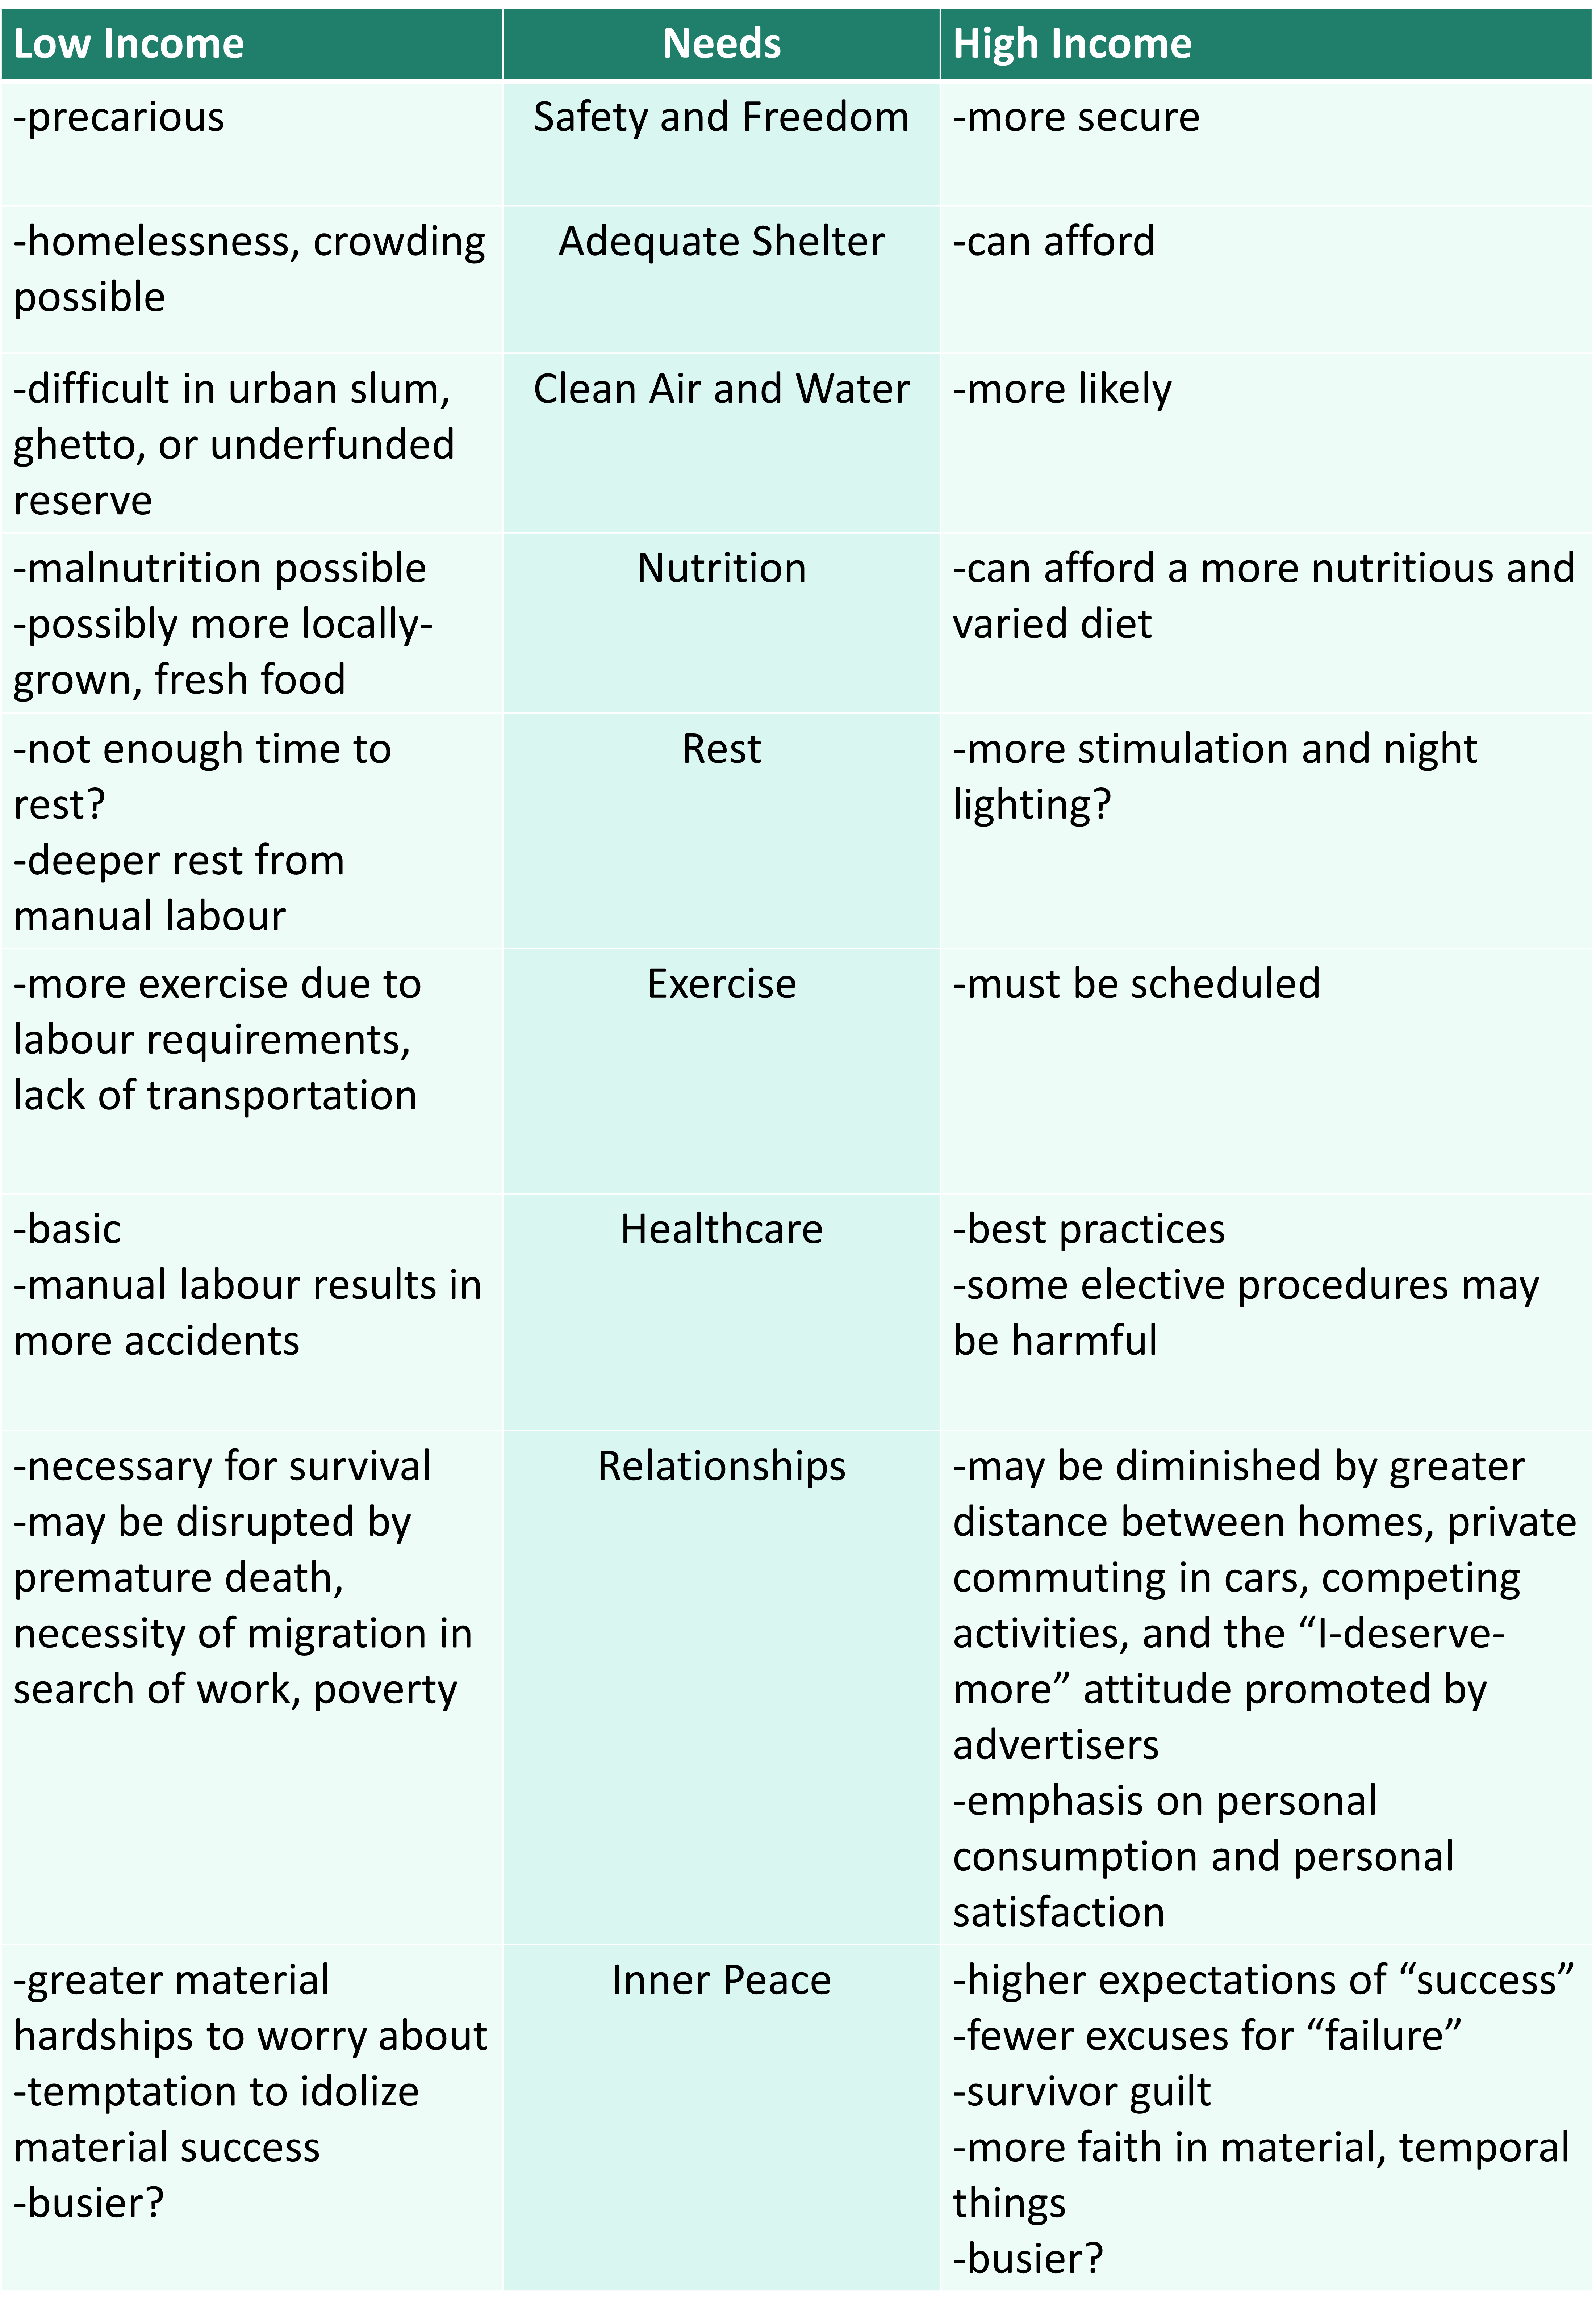
A higher income pays the bills and offers opportunities for enjoyment, but it can also be associated with overindulgence, overwork, and boredom. Let us now turn to the historical record to see how mortality rates have changed over time.

The idea that income promotes survival, until you have too much of it, is reflected in the three stages of mortality suggested by Abdel Omran (1971):
- the Age of Pestilence and Famine
- the Age of Receding Pandemics
- the Age of Man-made and Degenerative Disease
The names basically speak for themselves, with the first Age being one of high mortality, the second being one where mortality falls, and the third being an Age where mortality rates creep back up due to poor lifestyle choices and old age.
Omran’s predicted Age of Man-made and Degenerative Disease has not (yet) definitely arrived; however, later in this chapter we will discuss some recent downward trends in life expectancy.
It might be better to describe the three stages of mortality transition as:
- Pre-transition mortality
- Falling Mortality
- Delayed Aging
Most of the world’s nations are in this Delayed Aging stage.
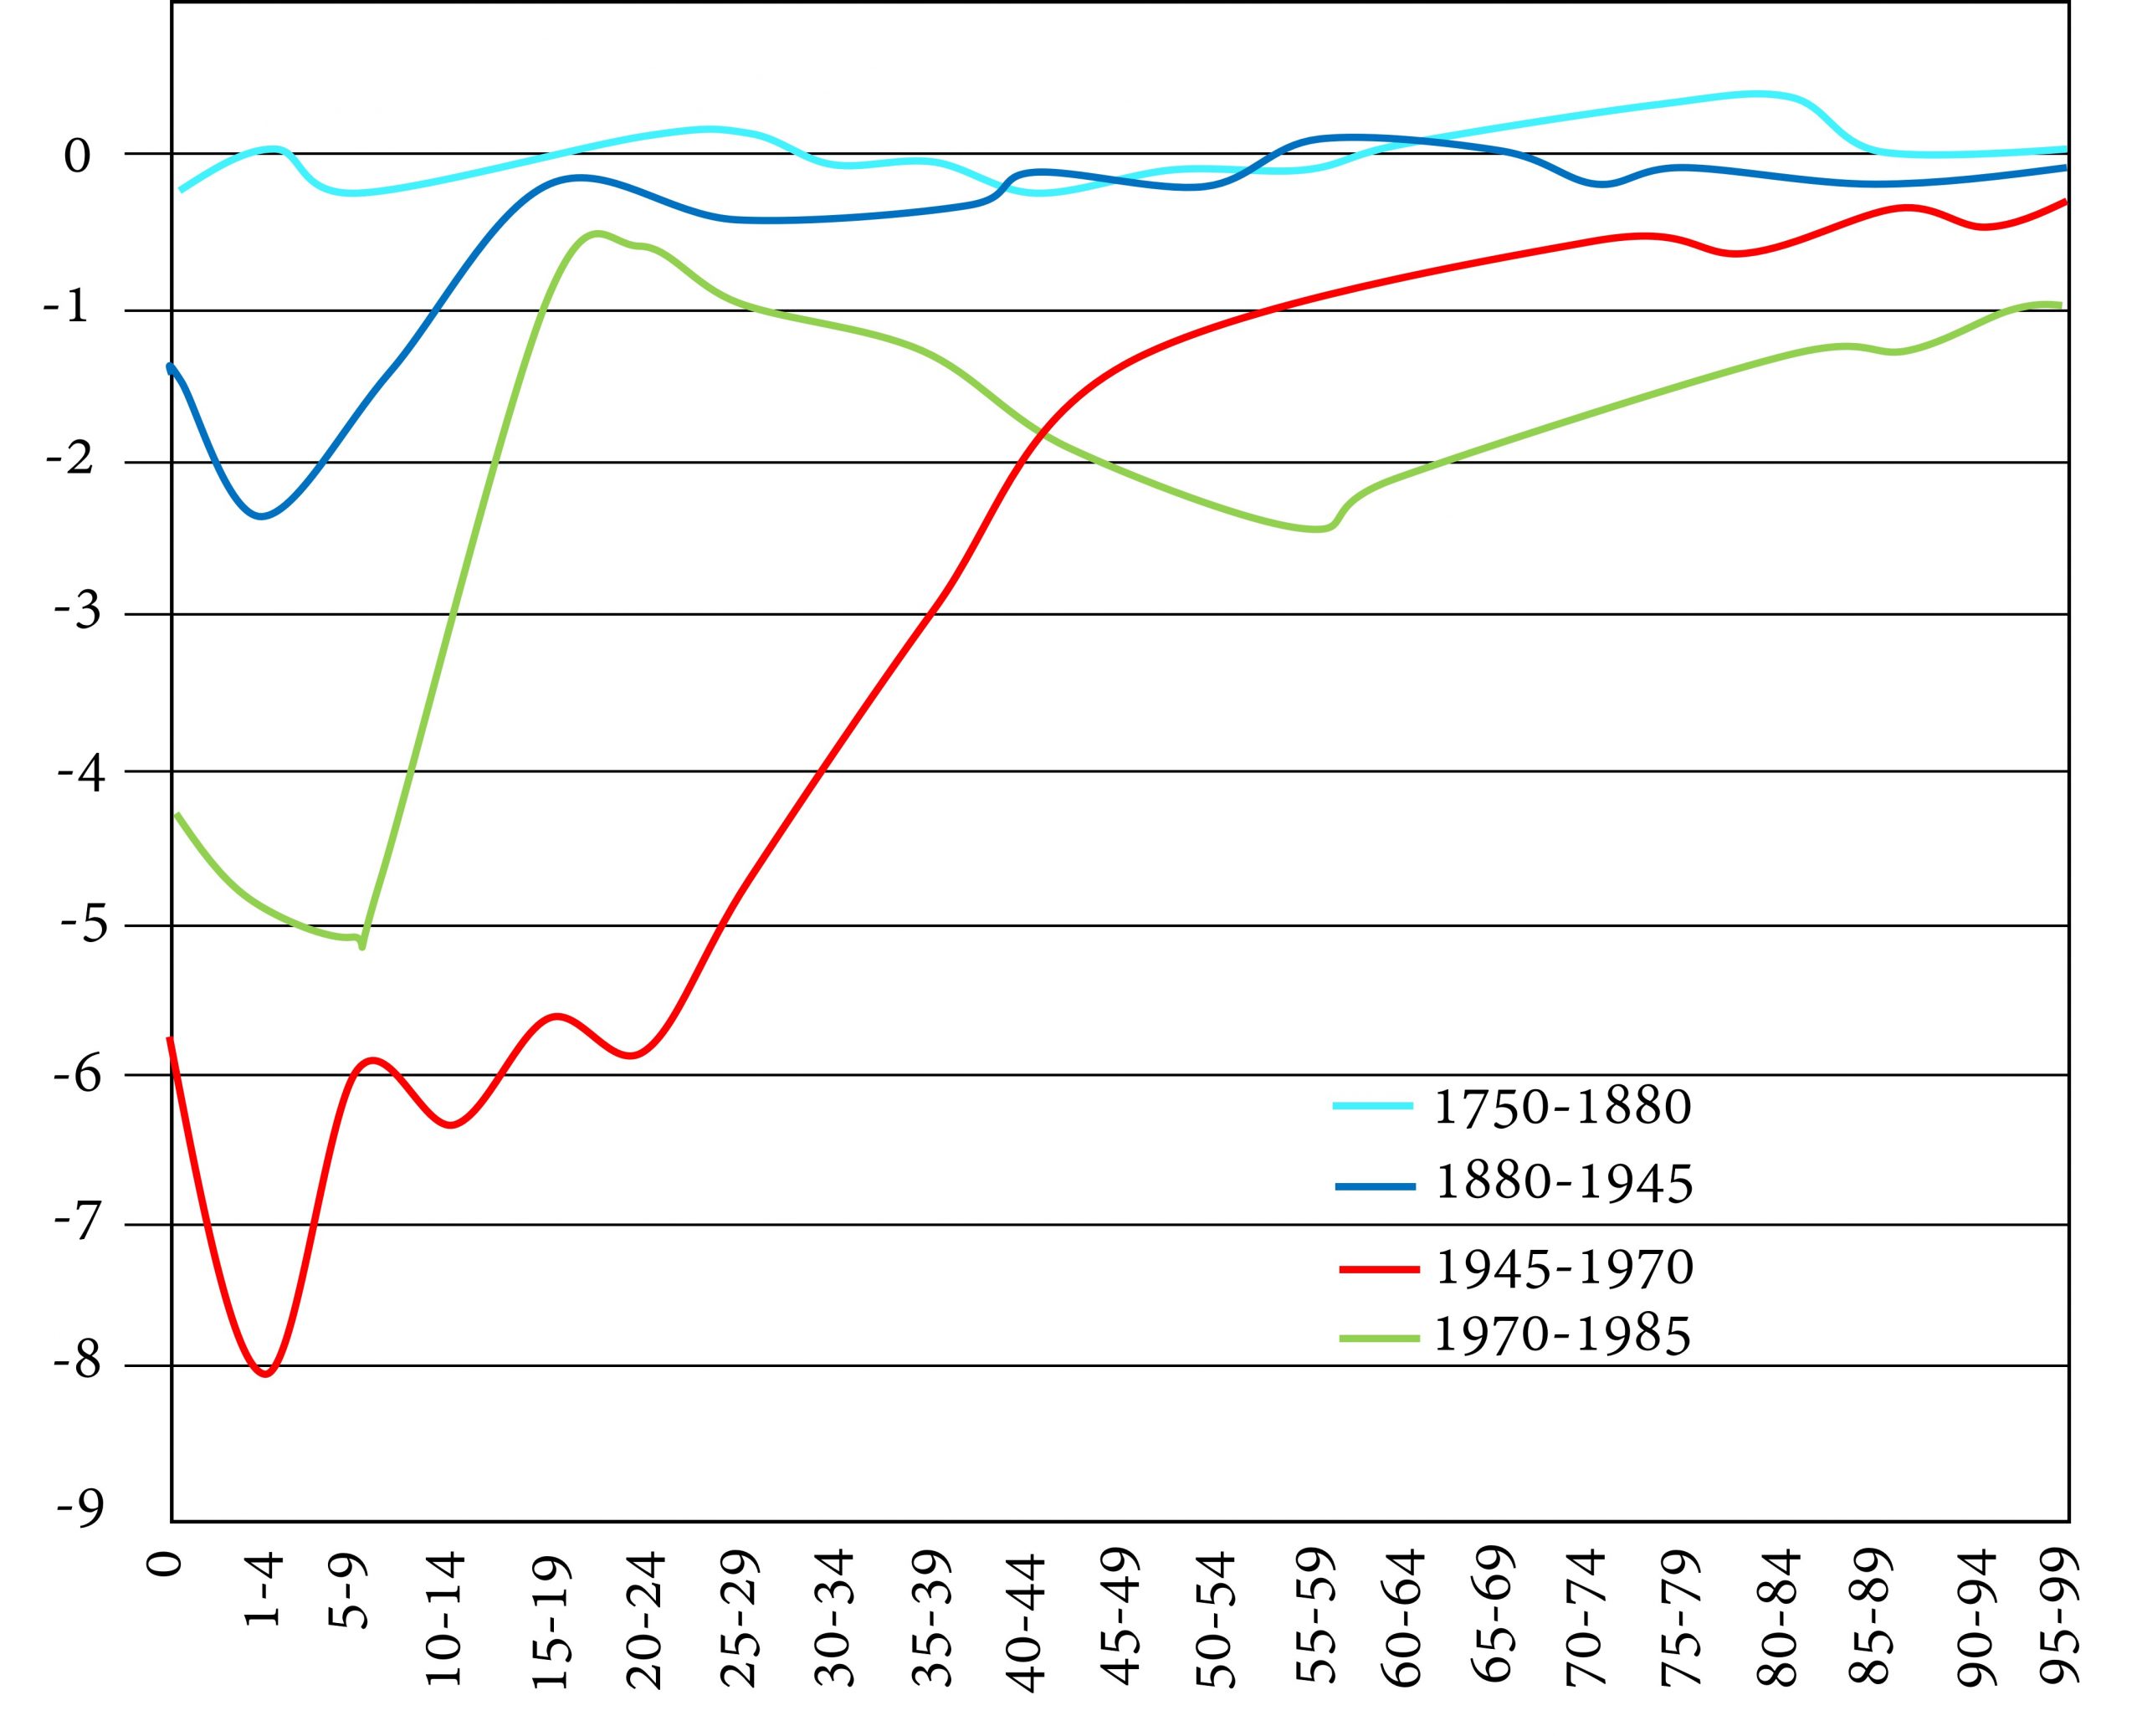
In the graph below, we see data collected by Kannisto et al. (1999) for Finland. The figure shows percentage decreases in mortality for different age groups along the horizontal axis. Each coloured line represents a different time period.
The top light blue line refers to a time period when mortality rates are not changing much, hence, a pre-transition stage. In Finland this did not end until about 1880. The dark blue and red lines refer to a time of major decreases in mortality, first for children only, then for children and younger adults. Finally, the greenish line shows that, during the period 1970-1985, middle-aged and older people’s mortality fell significantly – the period of delayed aging.


Generally, in pre-industrial times, age-specific mortality rates were particularly high for infants and children. Since so few survived to become adults, the ratio of children to adults was high. The average life expectancy was between 20 and 40 years. Females had higher mortality rates than males during their reproductive years, because of the riskiness of childbearing.
Omran (1971) writes grimly:
The scanty evidence available indicates that frequent and violent fluctuations characterized the mortality patterns of pre-modern societies and that the mortality level was extremely high even in the so-called good years.
Caught between the towering peaks of mortality from epidemics and other disasters and the high plateaus of mortality dictated by chronic malnutrition and endemic diseases, life expectancy was short and human misery was assured. More than any other single factor, fluctuating but always high mortality offers the most likely explanation of the slow rate of world population growth until 1650 A.D.
Cippolla (1994) writes,
Mortality was very high indeed in medieval and early modern Europe. A woman who managed to reach the end of her fertile life, let us say at age 45, had normally witnessed the deaths of both her parents, the majority of her brothers and sisters, more than half of their children, and often she was a widow. Death was a familiar theme. And it was a grim business. With no alleviation of pain, the bitterness of death was very real. To make things worse there was the cruelty of people, who had become hardened to the horror of natural death: apart from the give and take of warfare, there was the ferocity of justice, the homicidal intolerance of orthodox religion, and the lack of clemency for the weak and captive.
During this era, crisis deaths, though fewer in number than chronic deaths, formed a greater fraction of deaths than they would later, because poverty and ignorance kept people vulnerable to crises such as weather, war, and epidemics.

Kannisto et al. describe the years 1880-1945 as the Age of Bacteriology, and the years 1945-1970, the Age of Antibiotics. The changes Finland experienced during those years are typical of the stage of Falling Mortality. Medical advances and a rising standard of living reduce deaths from chronic disease such as diarrhea and tuberculosis. Infants, children, and young adults are the big winners. The Paradox of the Life Table is eliminated. Fewer women die in childbirth, and the female mortality rate drops below the male mortality rate for virtually all ages. Life expectancy at birth rises to 50 for men and women.
Omran attributes this declining mortality to a reduction in pandemic disease; but as we have discussed, the more significant breakthroughs have been against endemic, not pandemic, diseases. Learning how to fight bacteria and viruses has turned the tide against cholera, typhus, diptheria, tuberculosis, measles, and so many other formerly common threats. Anti-bacterial and anti-viral work was supported by developments in engineering, manufacturing, transportation, and farming, which improved materials, manufacturing, refrigeration, transport, the standard of living, the reach of commerce, and the capacity of governments to tax and spend.
Malthus had believed that an improving standard of living would lead to explosive population growth and terrible competition for scarce resources. There were indeed wars, pandemics, and famines during the eighteenth and nineteenth centuries. However, in Britain and western Europe, living standards more than kept pace with the growing population. As the improvements in technology and achievements in science spiraled ever higher, and – it should also be noted – as new lands, resources, and peoples were colonized in America, Africa, and Australia, the West sprung free of the Malthusian trap. Most of the rest of the world would soon follow.

In this stage, people have more than enough resources to meet their basic needs. The standard of living is high and innovation, whether technical or medical, is ongoing. Formerly chronic diseases melt away. Crisis deaths become a tiny fraction of deaths. Life expectancy at birth exceeds 70.
During this stage, most people die of diseases which are degenerative or man-made. Degenerative diseases are those that are a natural result of aging, given the current level of medical knowledge. They include cancer, heart disease, stroke, and Alzheimer’s. Man-made diseases are those that are caused by risky behaviour. They include diseases related to smoking, drinking, over-eating, a fat-rich diet, and lack of exercise.

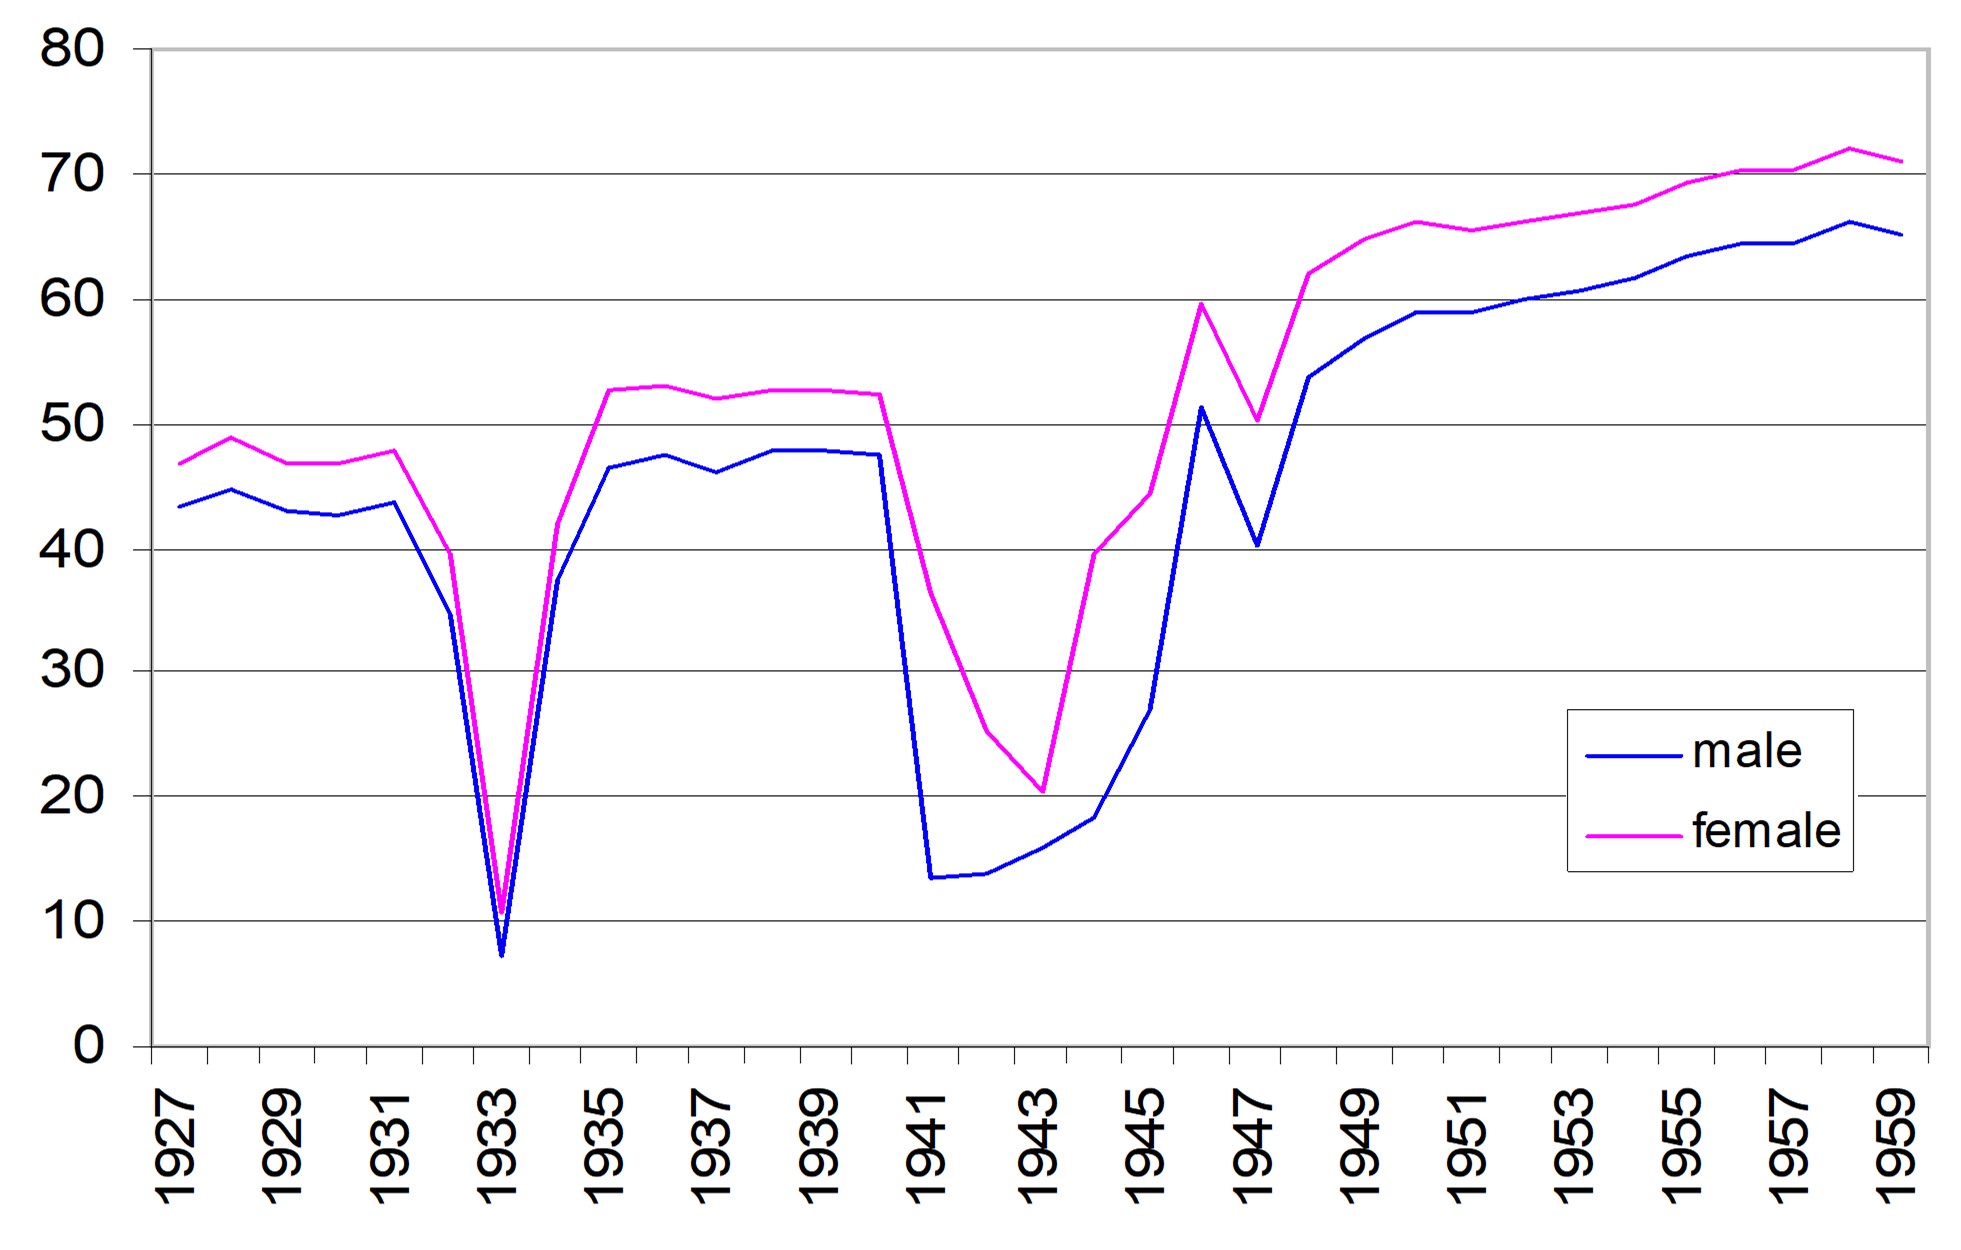
In reality, mortality will not transition as smoothly as we have described above. For example, as shown in Figure 9-2, life expectancy in the Ukraine gyrated wildly in the first half of the twentieth century due to famine (1932-3, 1946-7) and Nazi aggression (1941-1945). The invasion by Russia in 2022 will depress life expectancy in Ukraine once again.


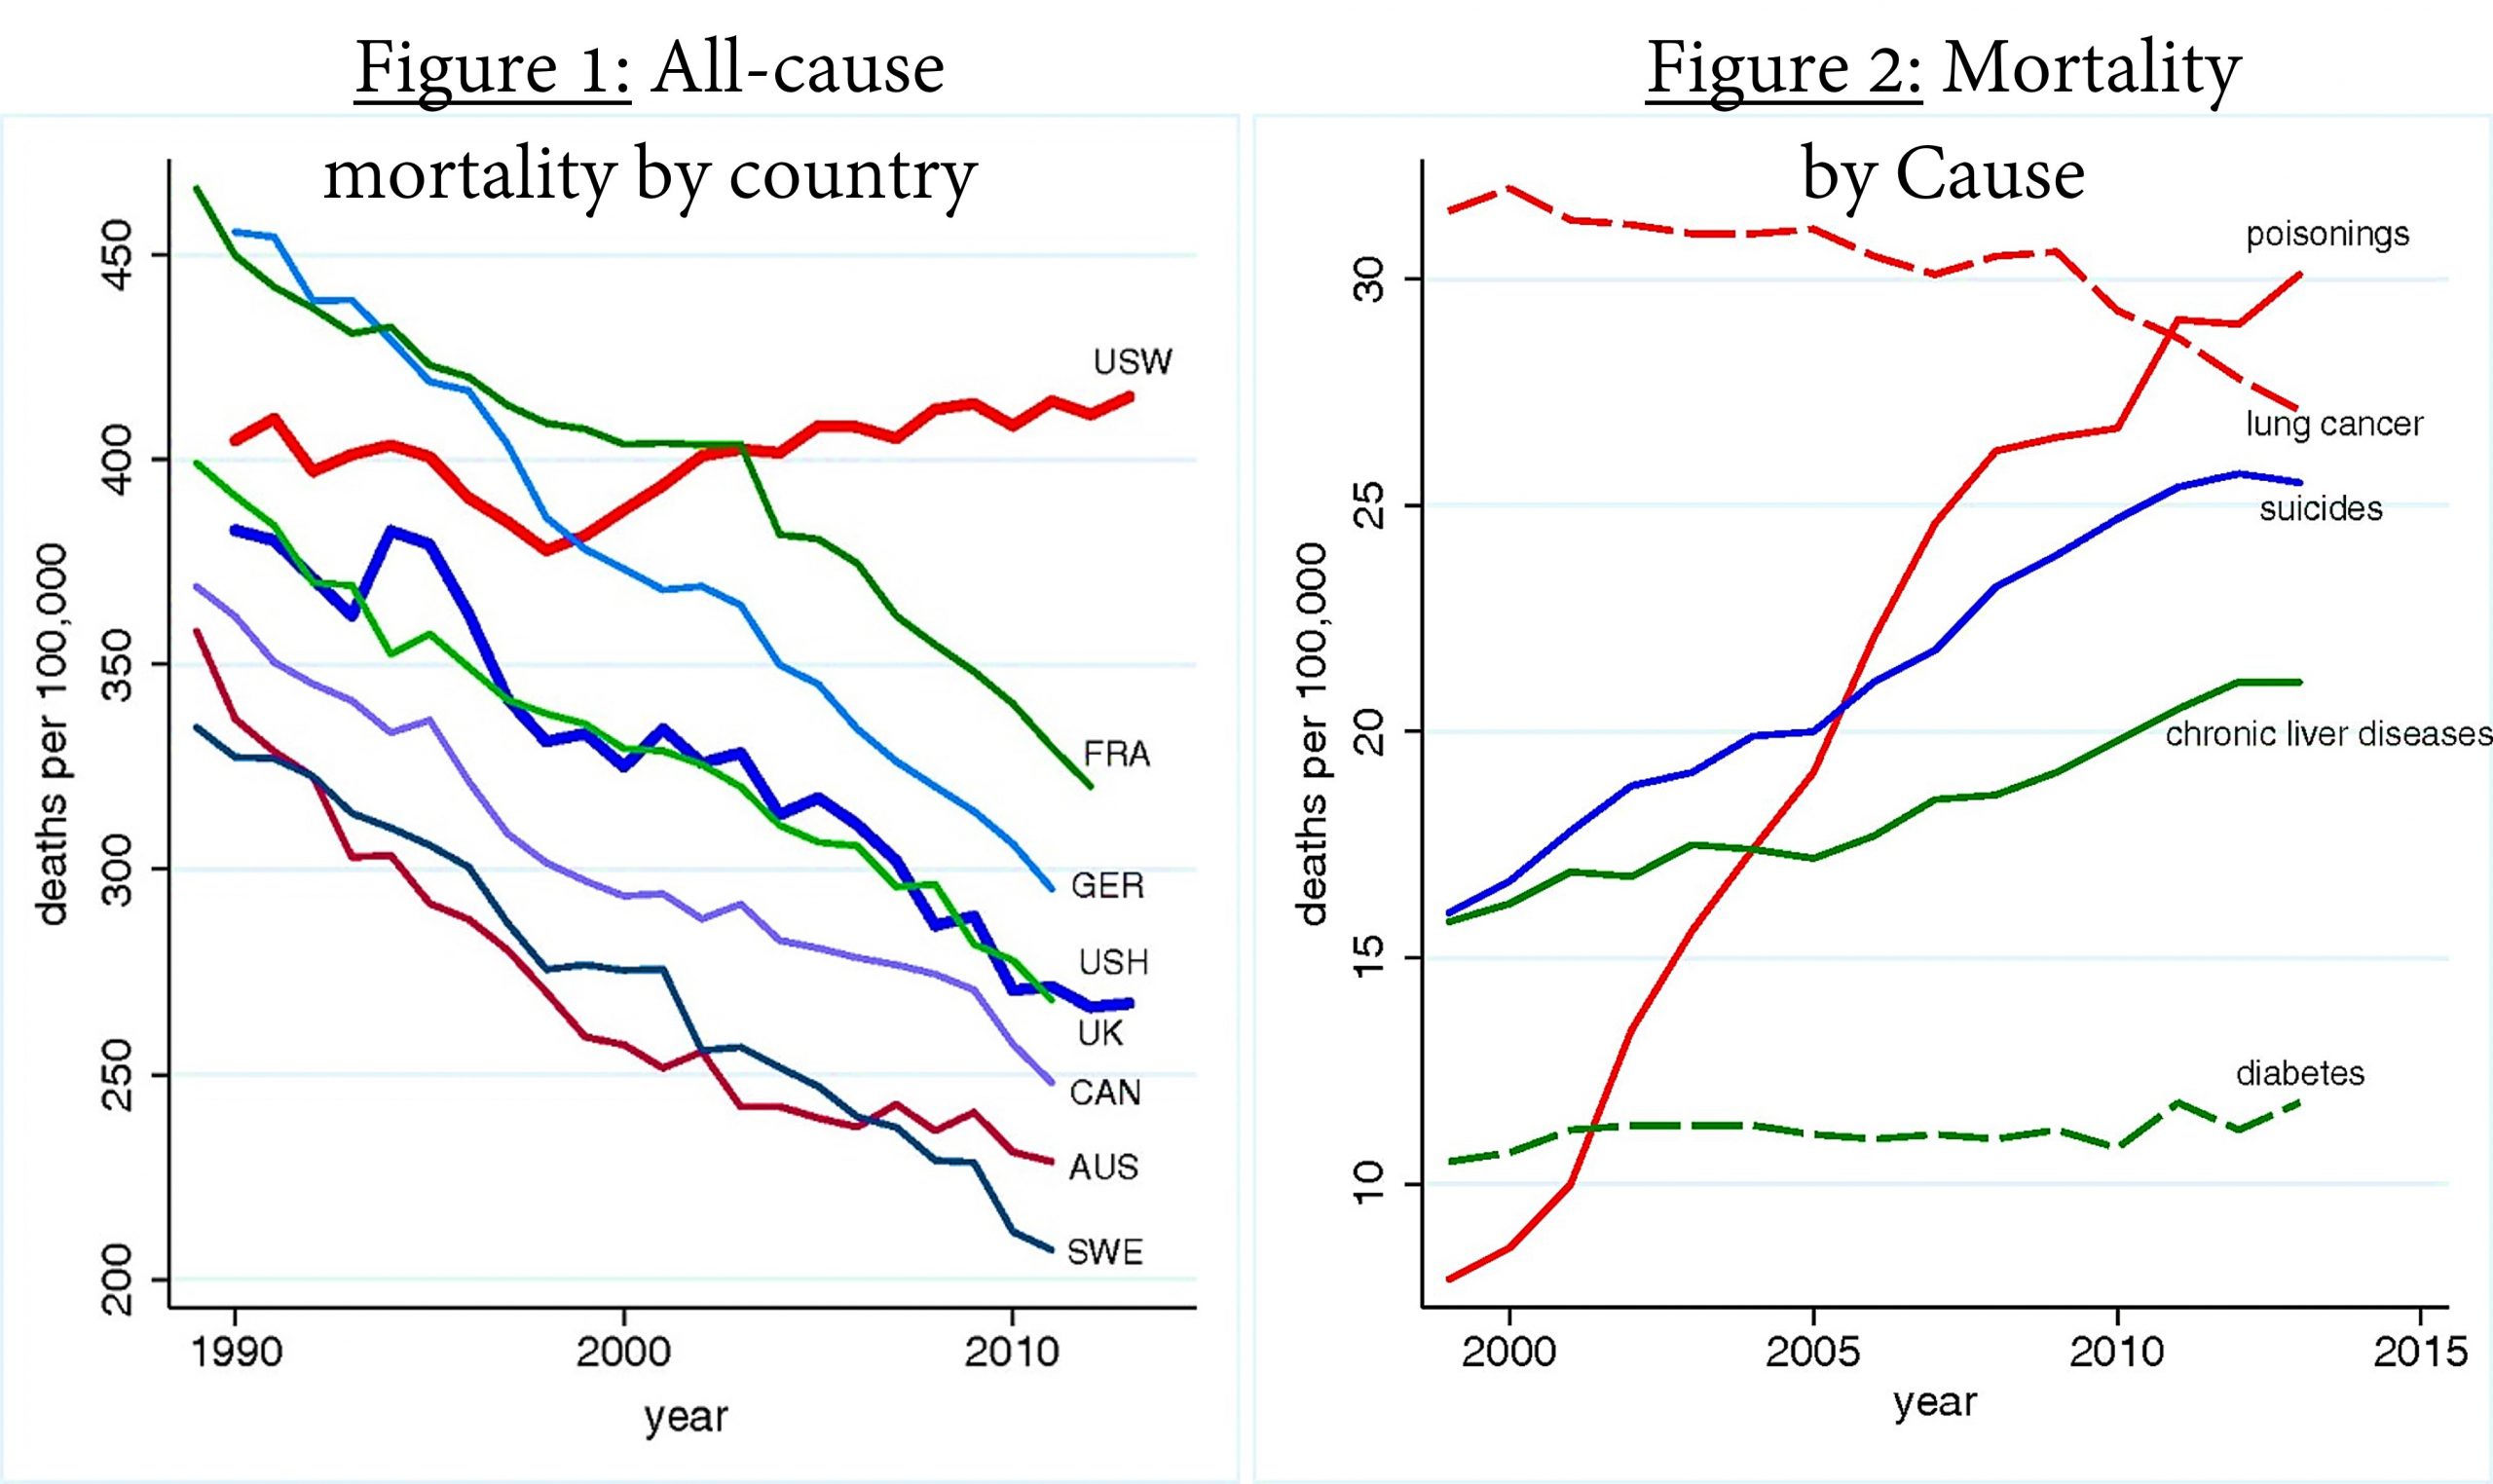
Several years before the COVID-19 pandemic, economists Case and Deaton (2015) published a shocking paper showing that, between 1998 and 2013, life expectancy at birth actually fell for middle-aged American Whites, especially those without a college education. The higher mortality rates for this group (“USW” in Figure 1), compared to middle-aged Hispanic Americans (“USH” in Figure 1), is shown below. Middle-aged Hispanic Americans (light green line) and Black Americans (not shown; mortality rates too high) did not experience rising mortality rates.
The mortality was manifest in higher rates of poisoning (drug overdoses), suicide, and (alcohol-related) liver failure, as shown in Case and Deaton’s Figure 2, below. There was also an increase in self-reported pain, and a decrease in self-reported mental health, physical health, and ability to work.
Canada has also experienced rising opioid-related mortality, particularly among men ages 25-45. British Columbia initially reported a decrease in life expectancy of 0.38 years between 2014 and 2015 for its overall population, with drug overdose deaths accounting for about one third the increase (Ye et al. (2018)). It now reports a much smaller decrease for that year; however, life expectancy did fall for three straight years between 2014 and 2017 for a total loss of more than half a year[4]. It also fell by about half a year the first year of the pandemic.[5] In the entire country, life expectancy fell slightly between 2016 and 2017, and because of the pandemic, between 2019 and 2020.[6]. The Canadian and BC life expectancies did not distinguish people by race.
Scholars are still at work analyzing the increased mortality for middle-aged White Americans to determine its underlying causes. As neatly summarized by Ross Douthat (2015), left-wing thinkers tend to blame economic problems like rising income inequality, the gig economy[7], stagnating wages, and the cost of housing, which are problems that government can address. Right-wing thinkers tend to blame the behaviour of individuals and the disintegration of cultural institutions, citing the rising divorce rate and falling church attendance. Putting these factors together, less-educated White Americans are facing economic stresses at such time as their social supports are less strong than they used to be. And compared to Black and Hispanic Americans, White Americans may have fewer coping mechanisms for new challenges. They may be more undone by disappointment.
Stephanie Kelton (2020) writes, “A well-known fact in social science is that social capital – a technical term for communal bonds like membership in clubs, attending church, being married, interacting with one’s neighbours – also increases noticeably with wealth and income.”
Another perspective worth noting:
The culture and educational systems of the contemporary West are based almost exclusively upon the training of the reasoning brain and, to a lesser extent, of the aesthetic emotions. Most of us have forgotten that we are not only brain and will, sense and feelings; we are also spirit. Modern man has for the most part lost touch with the truest and highest aspect of himself; and the result of this inward alienation can be seen all too plainly in his restlessness, his lack of identity and his loss of hope.[8]
That being said, the issues just described are found outside North America too, yet it is in North America that they appear to be so toxic.

Suicides more generally
Suicide has been called a permanent reaction to a temporary problem. If you ever have thoughts of suicide, please reach out and tell people whom you trust. Help is at hand.
As reported by the World Health Organization (WHO 2021), only one percent of global deaths result from suicide. The suicide rate declined significantly between 2000 and 2019, except in the United States, where it is increasing, as discussed above.
In some countries, women are more likely to die by suicide, but globally, men are twice as likely to die by suicide. In Canada, men are three times as likely. More attention should be paid to this differential.
We usually associate suicide with young people because suicide is a leading cause of death of young people. But it is only a leading cause of death of young people because young people are, in general, very healthy and strong. The rate of suicide is actually higher in older age groups. The highest suicide rates in Canada are for those ages 40 to 59 years of age. The “mid-life crisis” is no joke and may be related to financial reversals, divorce, and other stresses.
After accounting for the actual year of the suicide (since each year brings its own distinctive stress factors), and the year of birth (since each cohort experiences unique stresses), Lise Thibodeau (2015) found that, between 1926 and 2008, suicide rates for Canadians were highest at age 50 for men and age 45 for women.
Deaths related to COVID-19
The decrease in life expectancy for US Whites, which Case and Deaton noted, was made worse by the ravages of COVID-19. In 2020 the US experienced 529,000 excess deaths and life expectancy at birth fell a whopping 1.5 years, the largest single-year decline since 1942-43 (during World War 2)[9].
At the time of writing this book, Canada’s life expectancy was recorded as having fallen about half a year between 2019 and 2020[10].
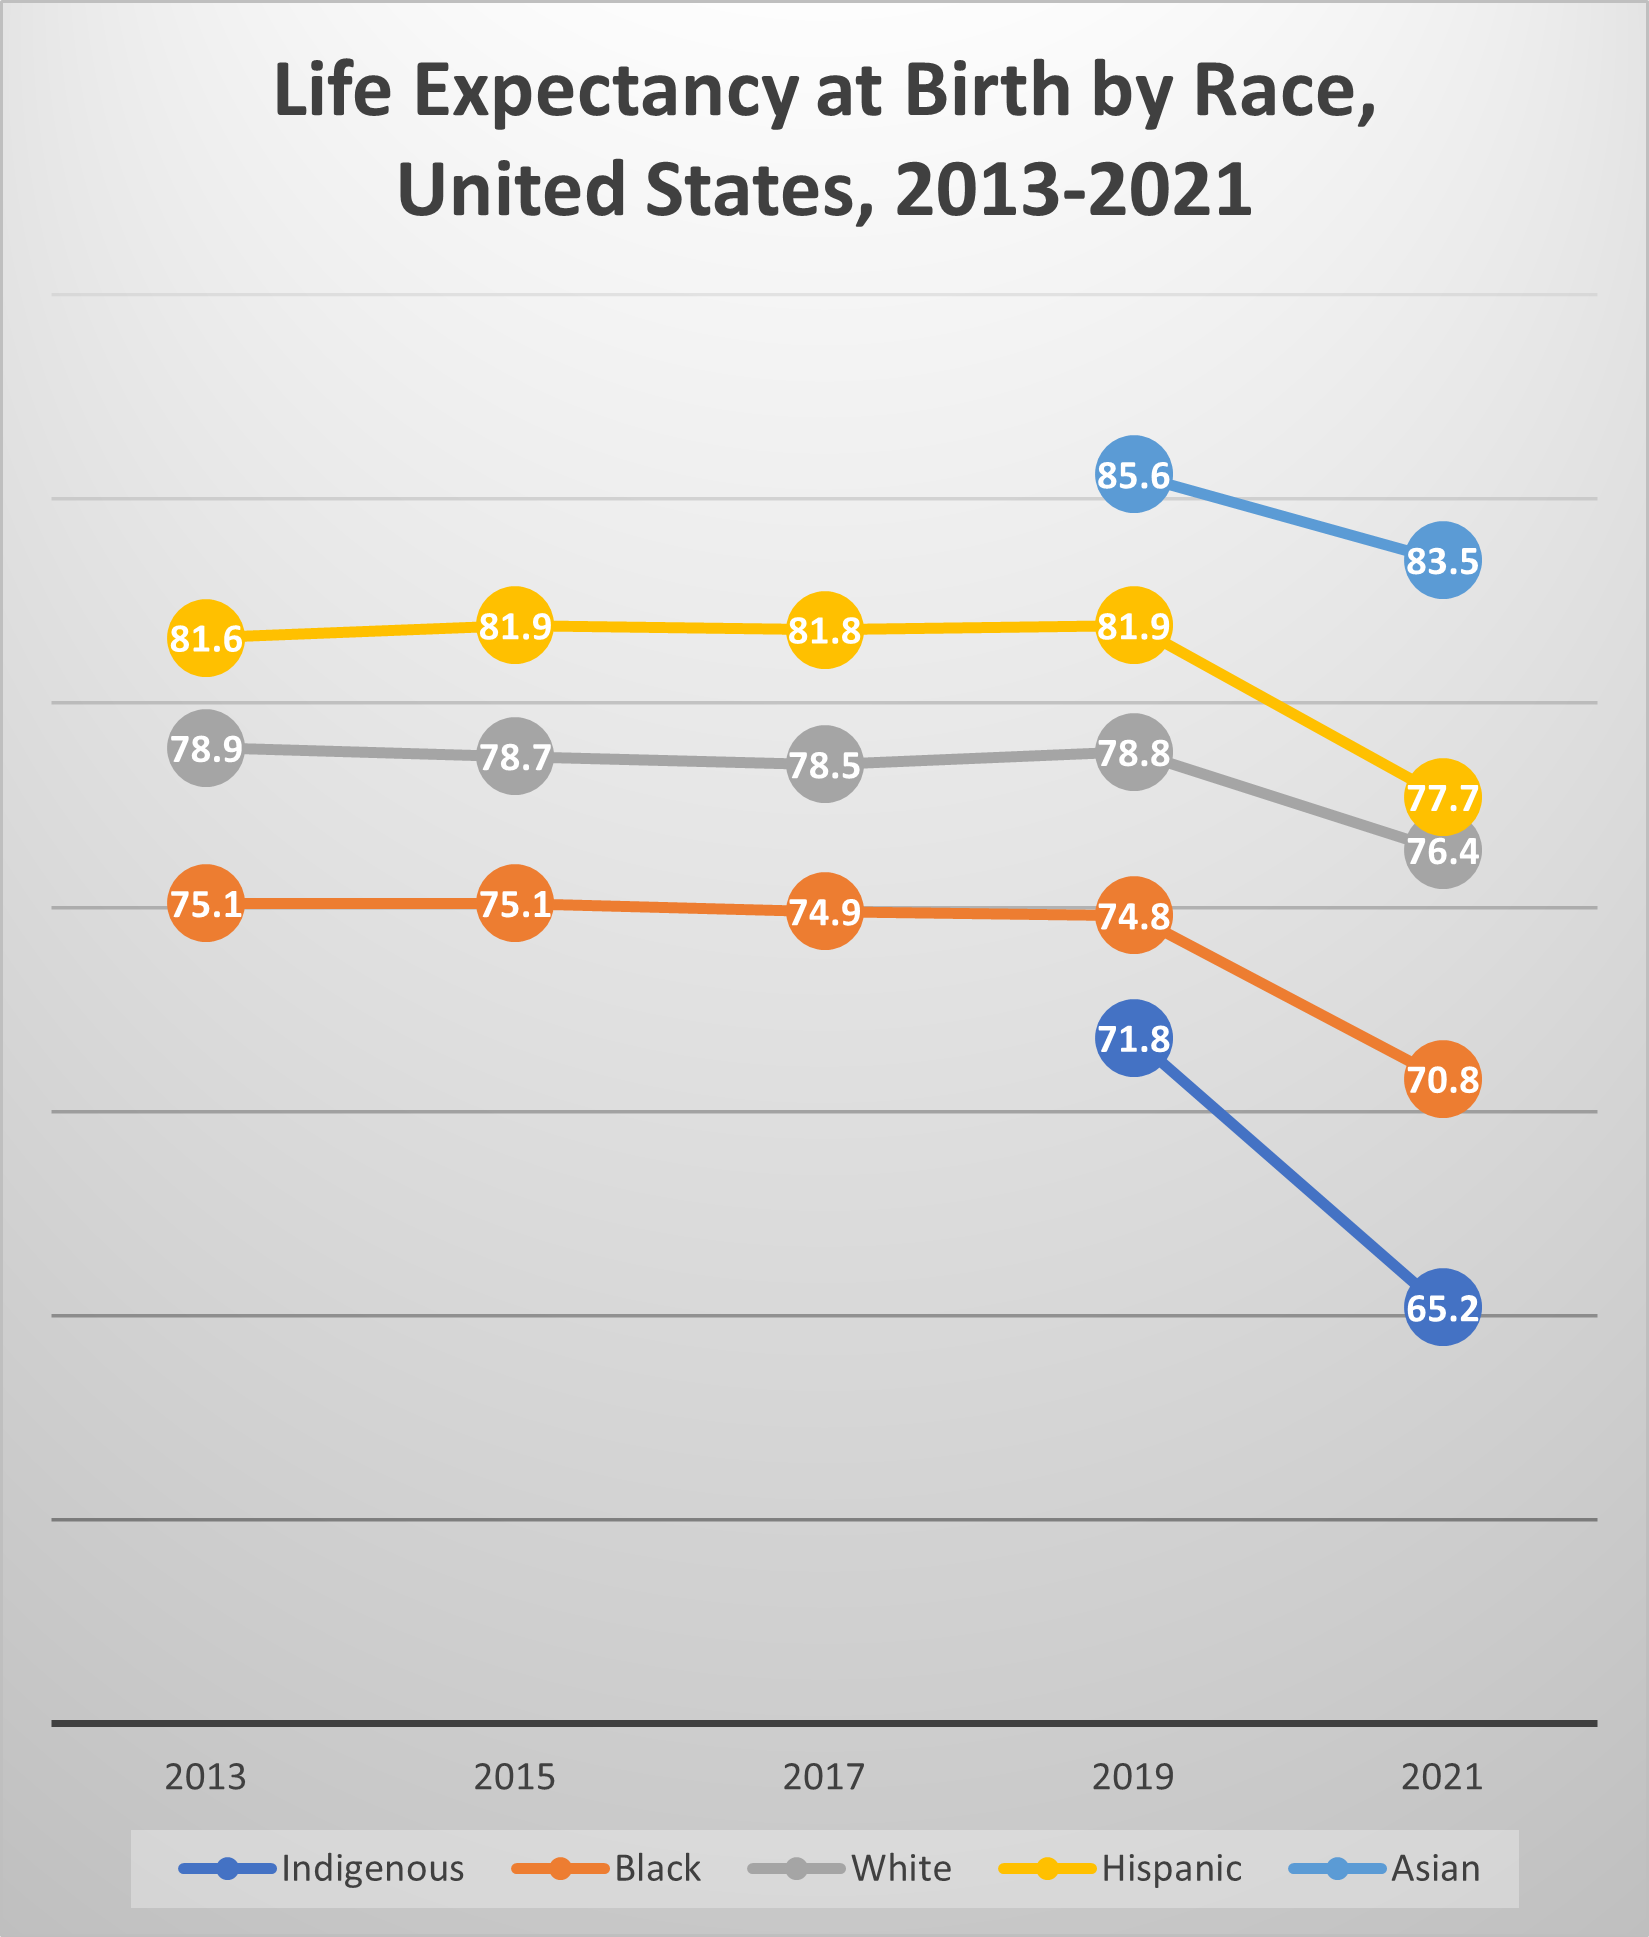
Figure 9-3 summarizes seven years of changes in life expectancy at birth for the United States, by racial group. Life expectancy at birth fell more for Hispanic Americans (3 years) and Black Americans (2.9 years) than White Americans (1.2 years) between 2013 and 2021, therebyreducing the Hispanic Paradox and unfortunately eroding some of the previous gains in relative life expectancy for Black Americans[11].
As reported in Elizabeth Arias et al. (2021), 74% of the 2020 increase in US death rates was due to COVID-19; 3.1% from homicide, about the same percentage from drug overdoses, 2.5% from diabetes, and 2.3% from chronic liver disease. The suicide mortality rate, however, decreased, as did rates of death from cancer, chronic lower respiratory disease, heart disease, and childbirth. These patterns held for Black, White, and Hispanic Americans.
In our next chapter we’ll study how to design good policies to alleviate mortality.


1. Dehejia and Lleras-Muney (2004) found that children conceived in times of high unemployment were healthier.
a) Suggest an explanation for this finding.
b) One explanation given by Dehejia and Lleras-Muney is that the people who give birth during recessions are different from the people who give birth during good times. What do you think they mean?
2. What can you say about mortality in the Age of Pestilence and Famine?
3. What turning points mark the end of this Age?
4. Why are medical innovations not enough to bring a society to the point where life expectancy moves up to 70 or 80?
5. Relying only on what is stated in the text, compare Elizabeth Arias’ findings to Case and Deaton’s findings.
- National Vital Statistics Reports, 68(7), June 24, 2019 ↵
- Government of Canada (2023), "Tuberculosis in Canada: Infographic. Tuberculosis in Canada: Infographic (2021) - Canada.ca ↵
- OECD data from https://stats.oecdorg ↵
- Statistics Canada (August 2023) ↵
- Ibid. ↵
- Ibid. ↵
- The gig economy refers the the prevalence of insecure, part-time jobs without pensions or benefits. ↵
- Ware(1995) ↵
- National Center for Health Statistics (July 2021) ↵
- The Globe and Mail, Dec. 23, 2021 ↵
- National Center for Health Statistics (July 2021) ↵
This Hispanic Paradox refers to the fact that, in the United States, people of Hispanic origin live longer than "non-Hispanic Whites", even though they are, on average, lower-income than non-Hispanic Whites.

