

The Malthusian model seems no longer relevant in a world experiencing ongoing technological development, a rising standard of living, and a slowing rate of population growth.
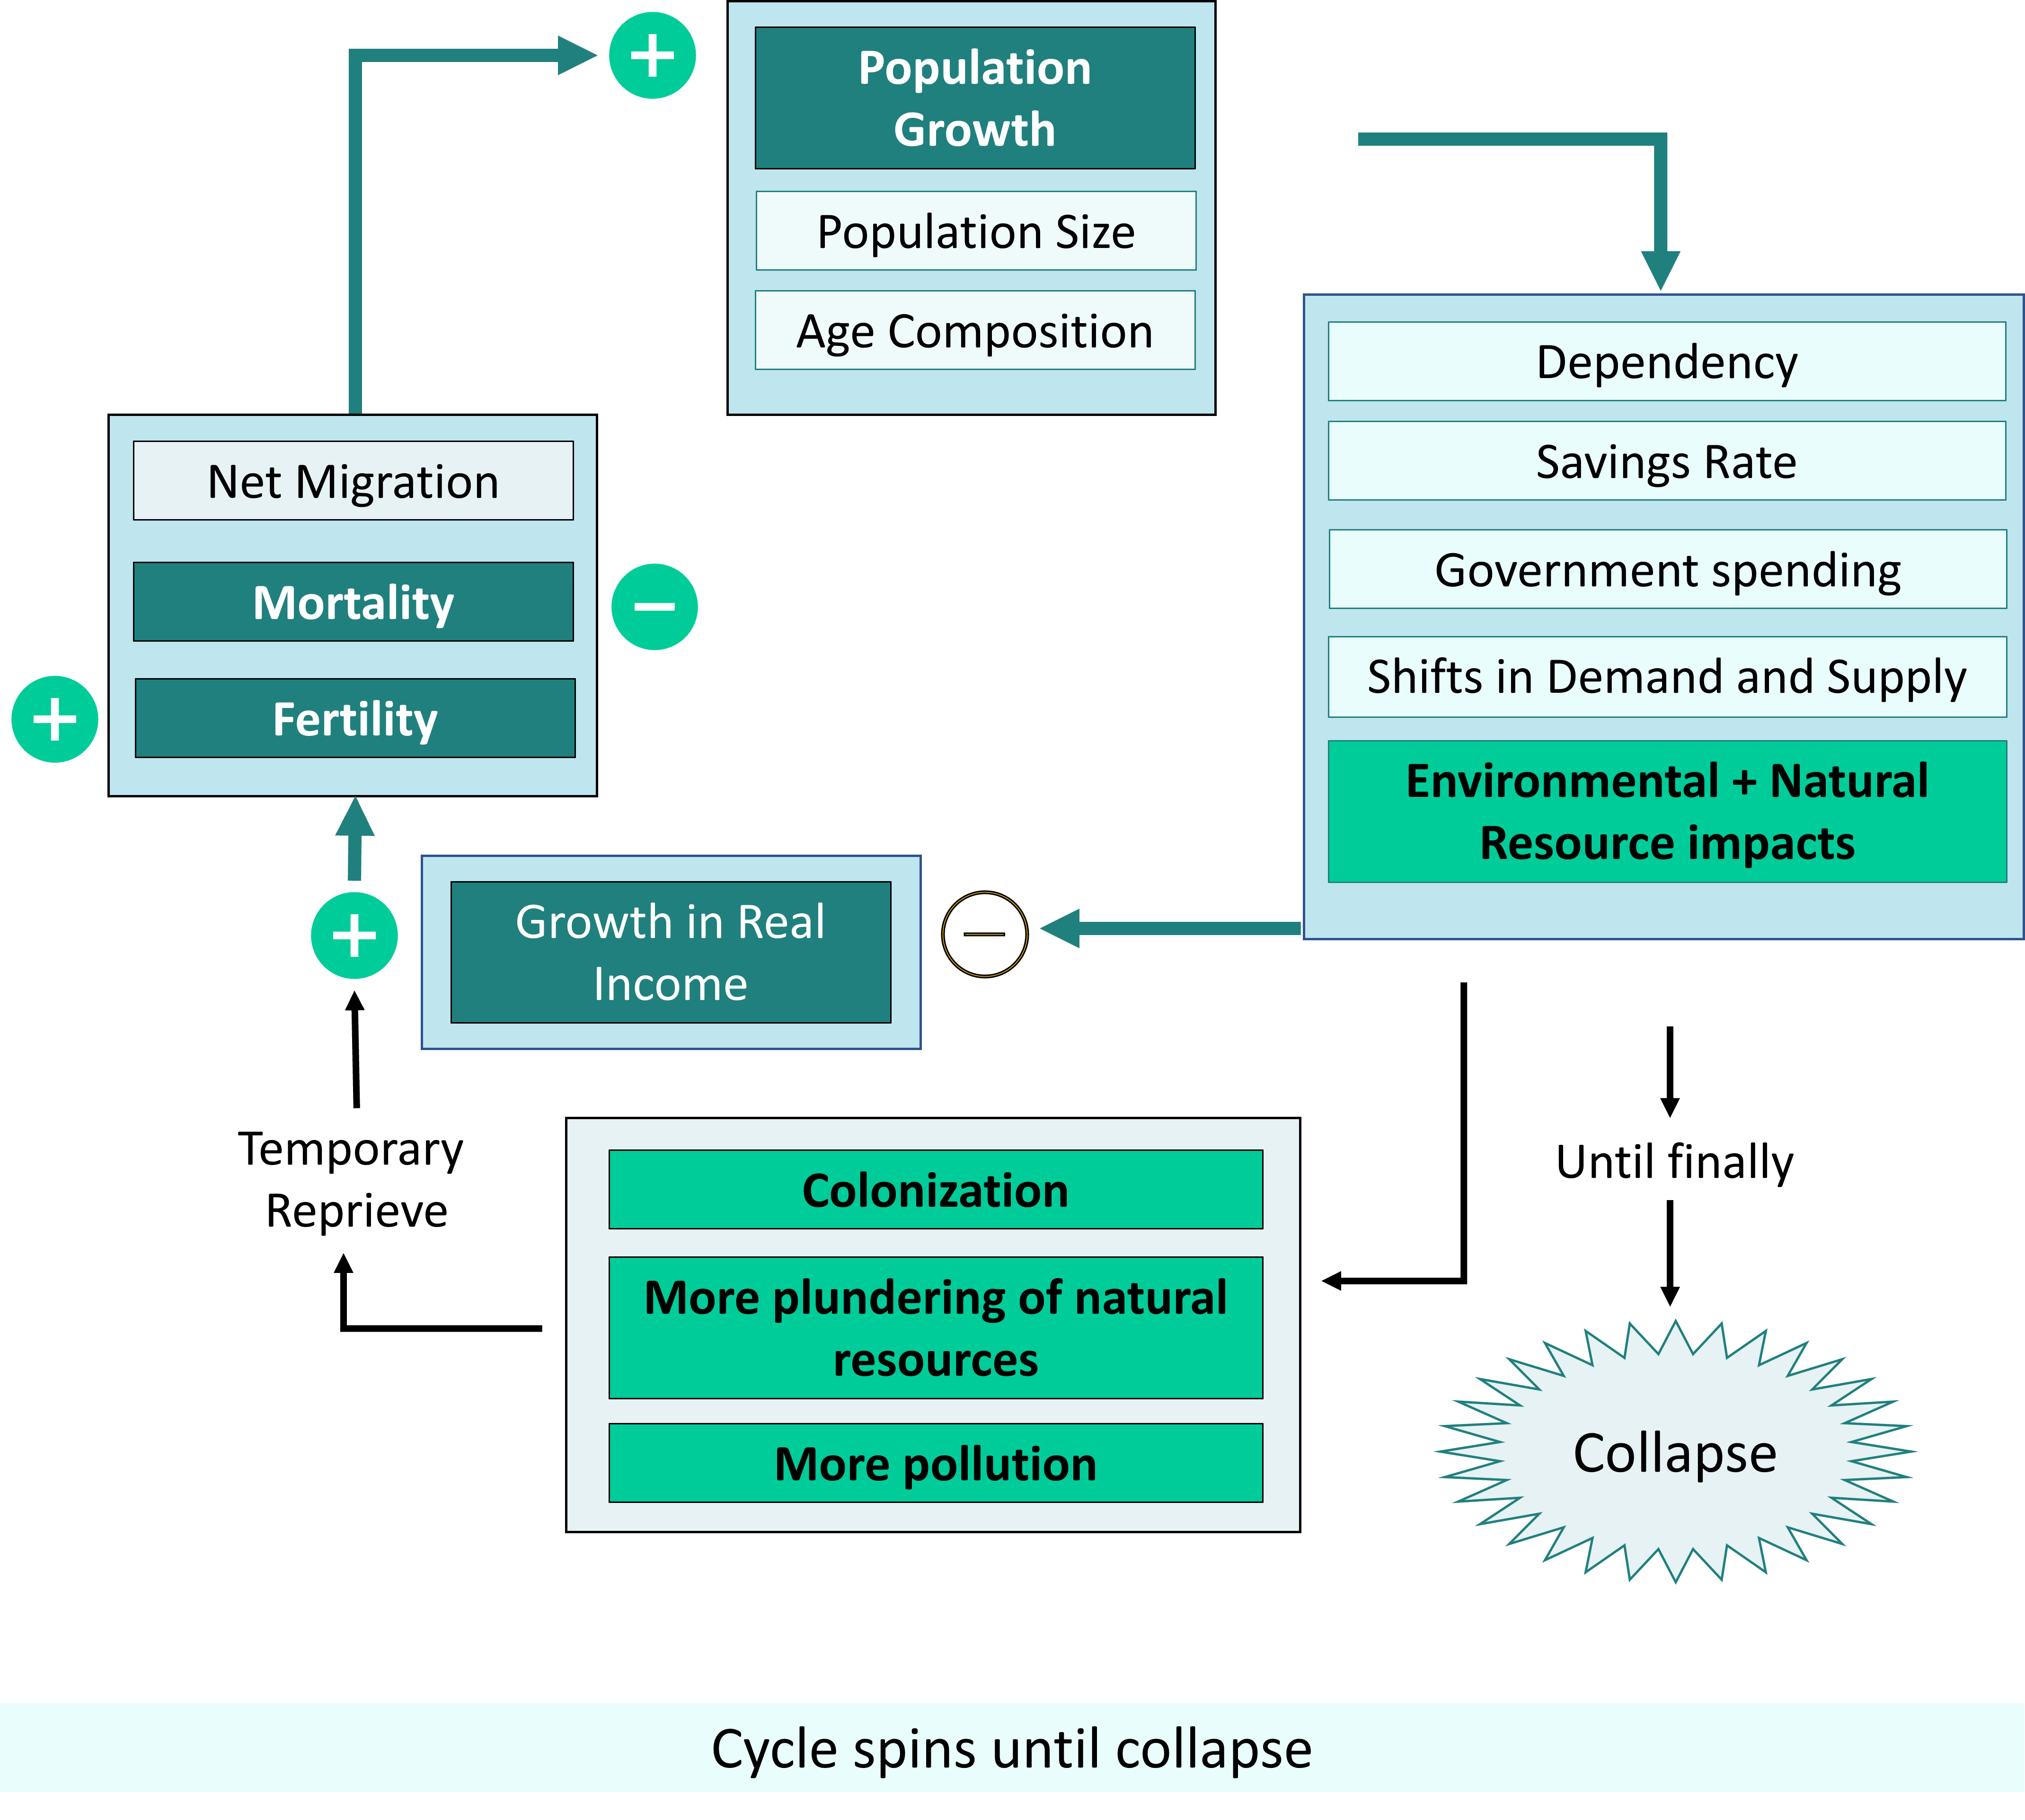
Paul Ehrlich (co-author of The Population Bomb, 1968) warned us not to disregard the Malthusian model. Food production has been able to keep up with population growth, but only because we have been exploiting natural resources, environmental capital, and other societies in an unsustainable way, Ehrlich said. At some point we will not be able to do this any longer; confronted by a wasted environment or social upheaval, our civilization will collapse.

Esther Boserup (1965) and Julian Simon (1981) had a rosier view. They noted that, as population grows and resources become relatively scarce, prices rise. They believed that rising prices will motivate people to innovate and develop new technologies, and that these innovations will be successful.

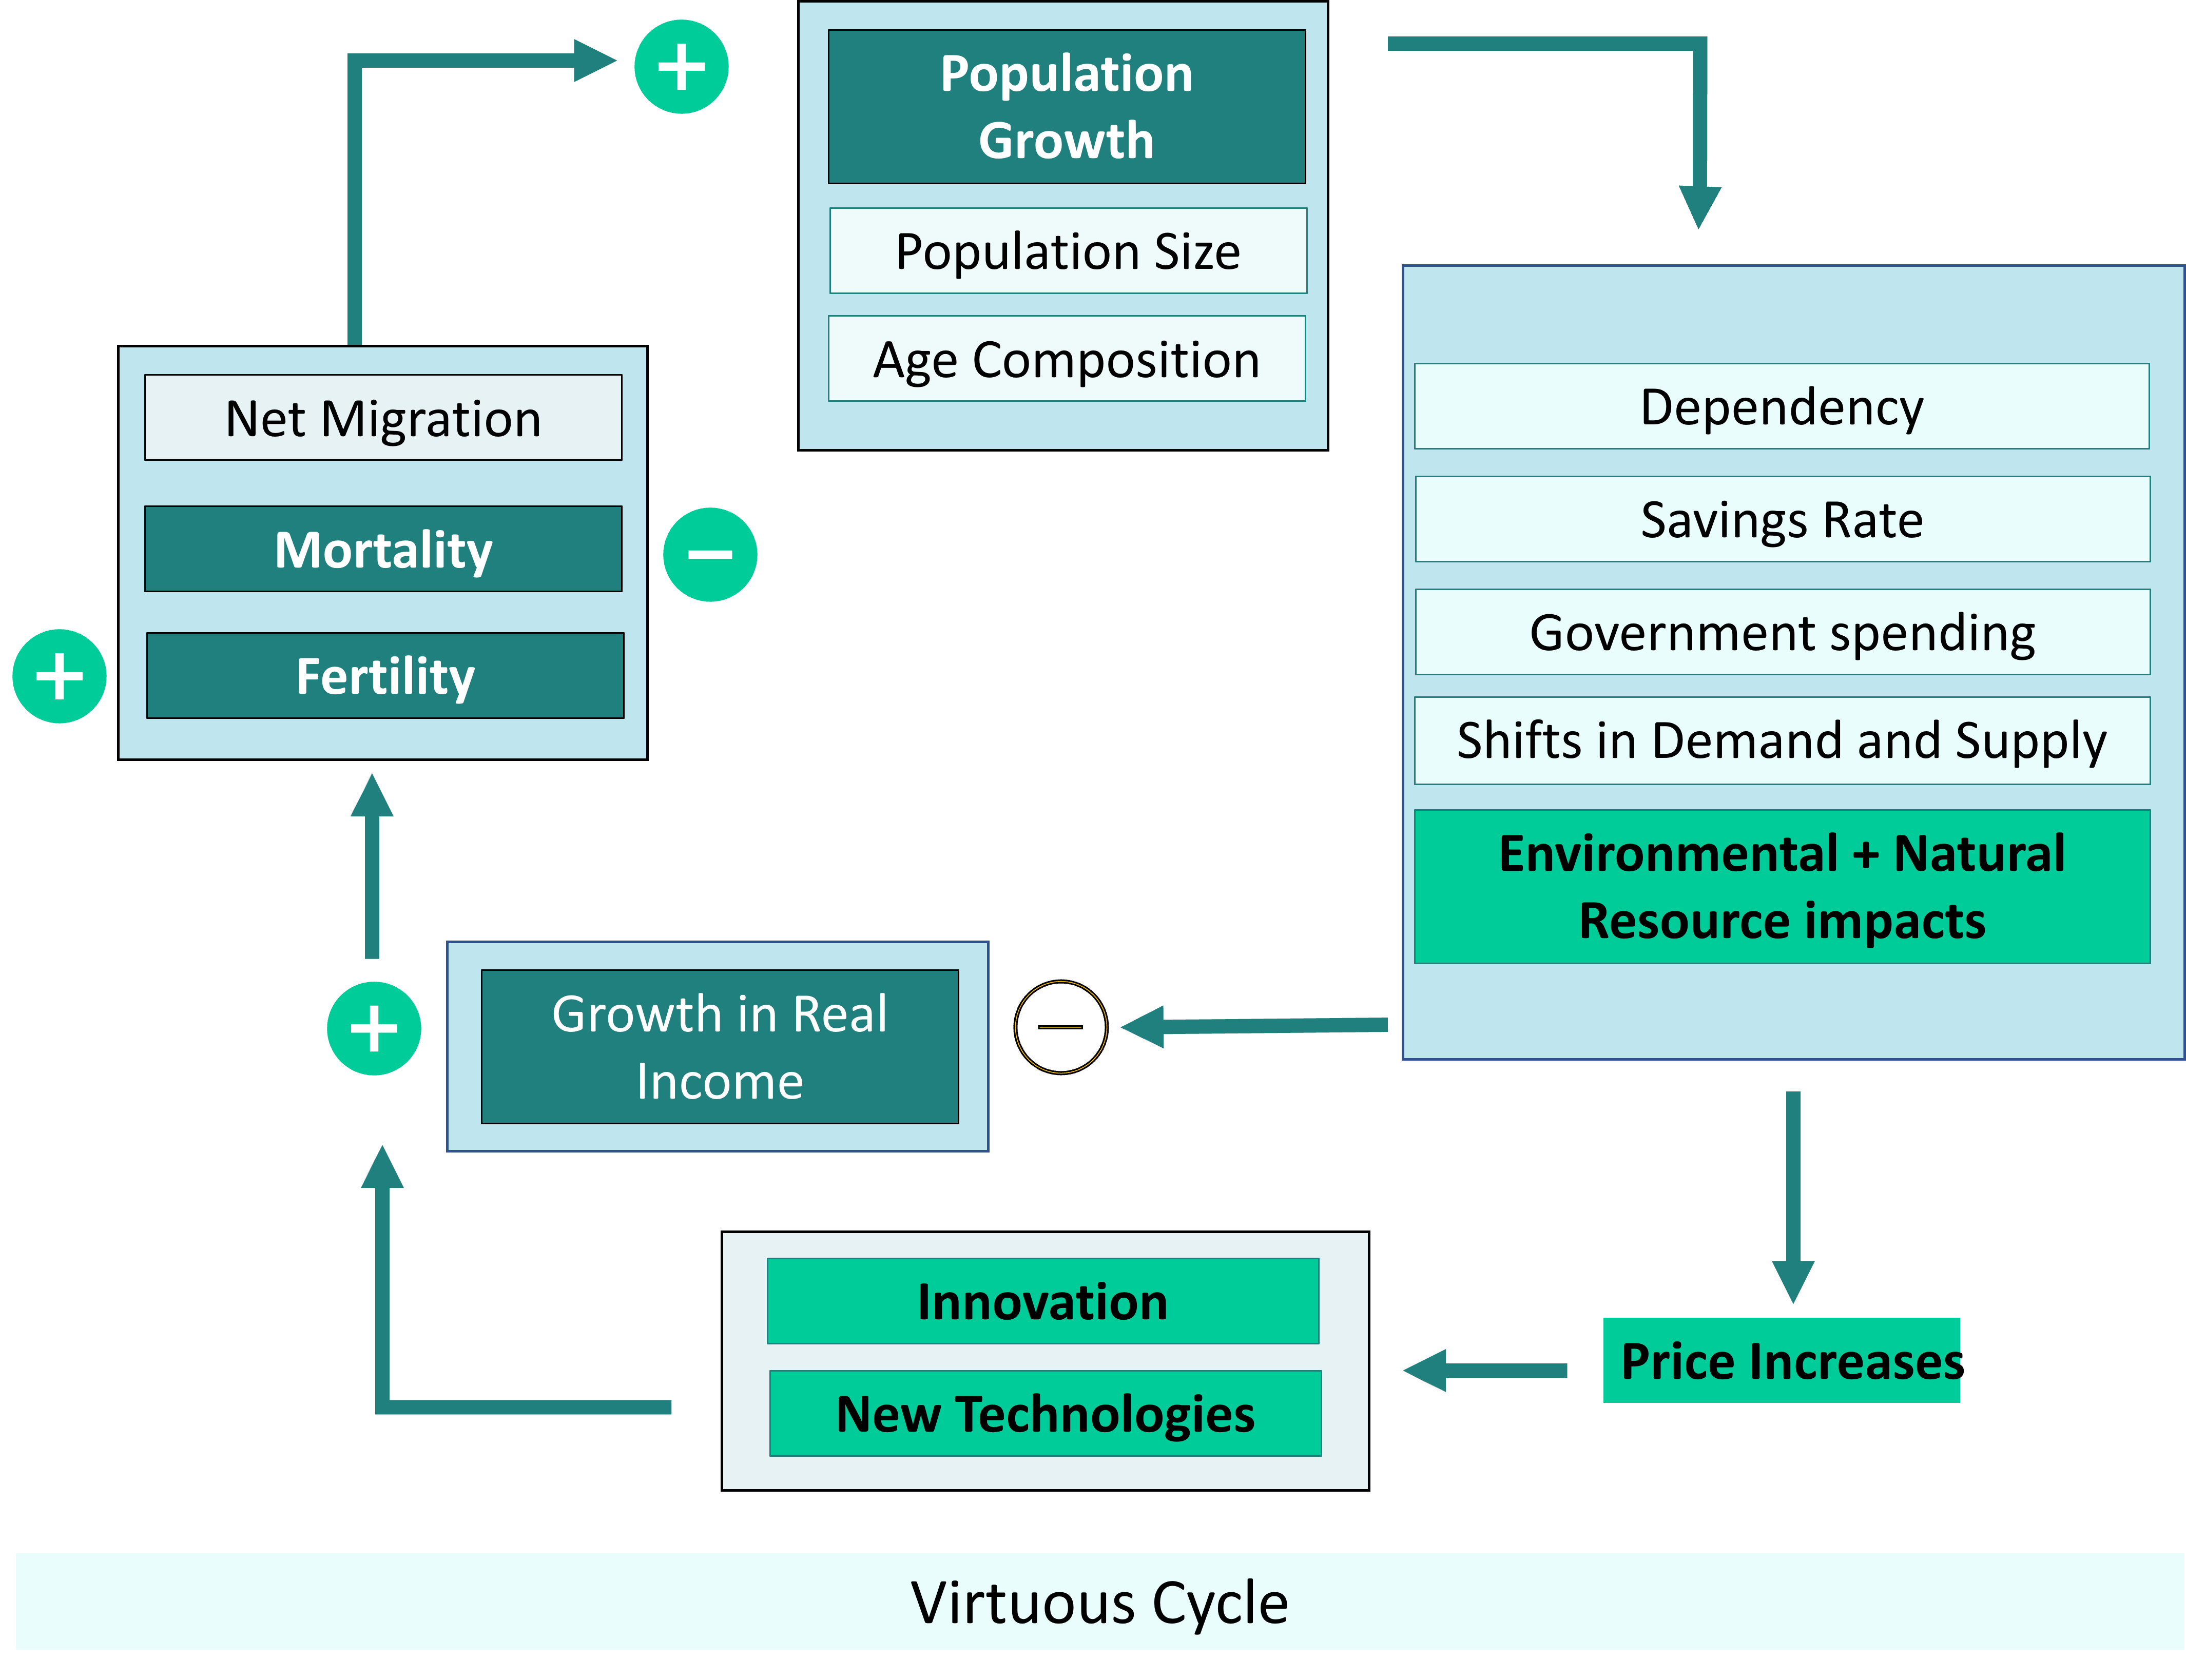
In this model, the standard of living is rescued again and again by technological change. For that to happen, there must be a political and intellectual climate conducive to innovation. Governments help by pursuing peace, upholding civil and commercial law, protecting personal and intellectual property, and funding education and research. A well-functioning market is needed to provide innovators with investment funds and inputs, and to help them find customers for their inventions.
New technology disrupts old technology, and existing companies may want to stamp it out, fearing their own obsolescence. The market must be open to new ideas, and free from artificial barriers.
In some countries these preconditions for innovation are not well established, so the economy must acquire new technologies from other countries.
Modern societies are more and more dependent on technologies that most people don’t understand, with health and environmental implications we don’t realize until damage has been done. We have to keep innovating to clean up the mess we make. This could be what Jane Jacobs (1969) had in mind when she wrote:
Once we stopped living like the other animals, on what nature provided us ready-made, we began riding a tiger we dare not dismount[1]…
Boserup and Simon’s model presumes that all relevant resources are marketed, so that resource scarcity will be registered by an increase in the price of those resources. In real life, population growth threatens resources such as watersheds, pollinators, and climate. Watersheds, pollinators, and climate provide ecosystem services which are not bought and sold in the market. These services will be unpriced unless regulators attach restrictions or taxes to their use. If unpriced, there is no clear incentive to preserve them or provide more of them. If there is no regulation of watersheds, pollinators, climate, etc. these “open-access resources” are likely to be overexploited, and the rosy view of Boserup and Simon must be tempered with warnings from Ehrlich.

Traditional knowledge-keepers of the Indigenous peoples of Turtle Island (North America) would likely begin any discussion of population and its economic consequences by explaining their understanding of the Land. According to traditional Indigenous thought, the Land is comprised of spiritual beings who take shape or have taken shape in physical form. It includes beings that are often taken to be inanimate – rocks, trees, and winds for example. The Land does not so much belong to human beings as human beings belong to the Land.
All beings on the Land exist in relationship together. These many intersecting relationships are what life is about. People have obligations to gratefully tend the resources they harvest, and to share with one another. There are also obligations to ancestors who have crossed over to the spirit world, and obligations to descendants who will walk the Land seven generations from now.
Ronald Trosper, in his book Indigenous Economics (2022, pp.5-6), states:
“Living well consists of pursuing actions that strengthen humanity’s relational goods created by relationships with nature and with each other. The added value of improved relationships can include additional material goods and services, so long as the additional material income is shared with all beings in the relationships. The aim of good living is to increase the value of all relationships without harming them.”
How can we model an understanding of progress that emphasizes relationships among all beings?
The Medicine Wheel is often used by Indigenous knowledge-keepers to illustrate balanced progress that respects relationships. The Medicine Wheel is a made up of concentric circles, divided into four quadrants. Progress is represented by moving outward in all four directions simultaneously.

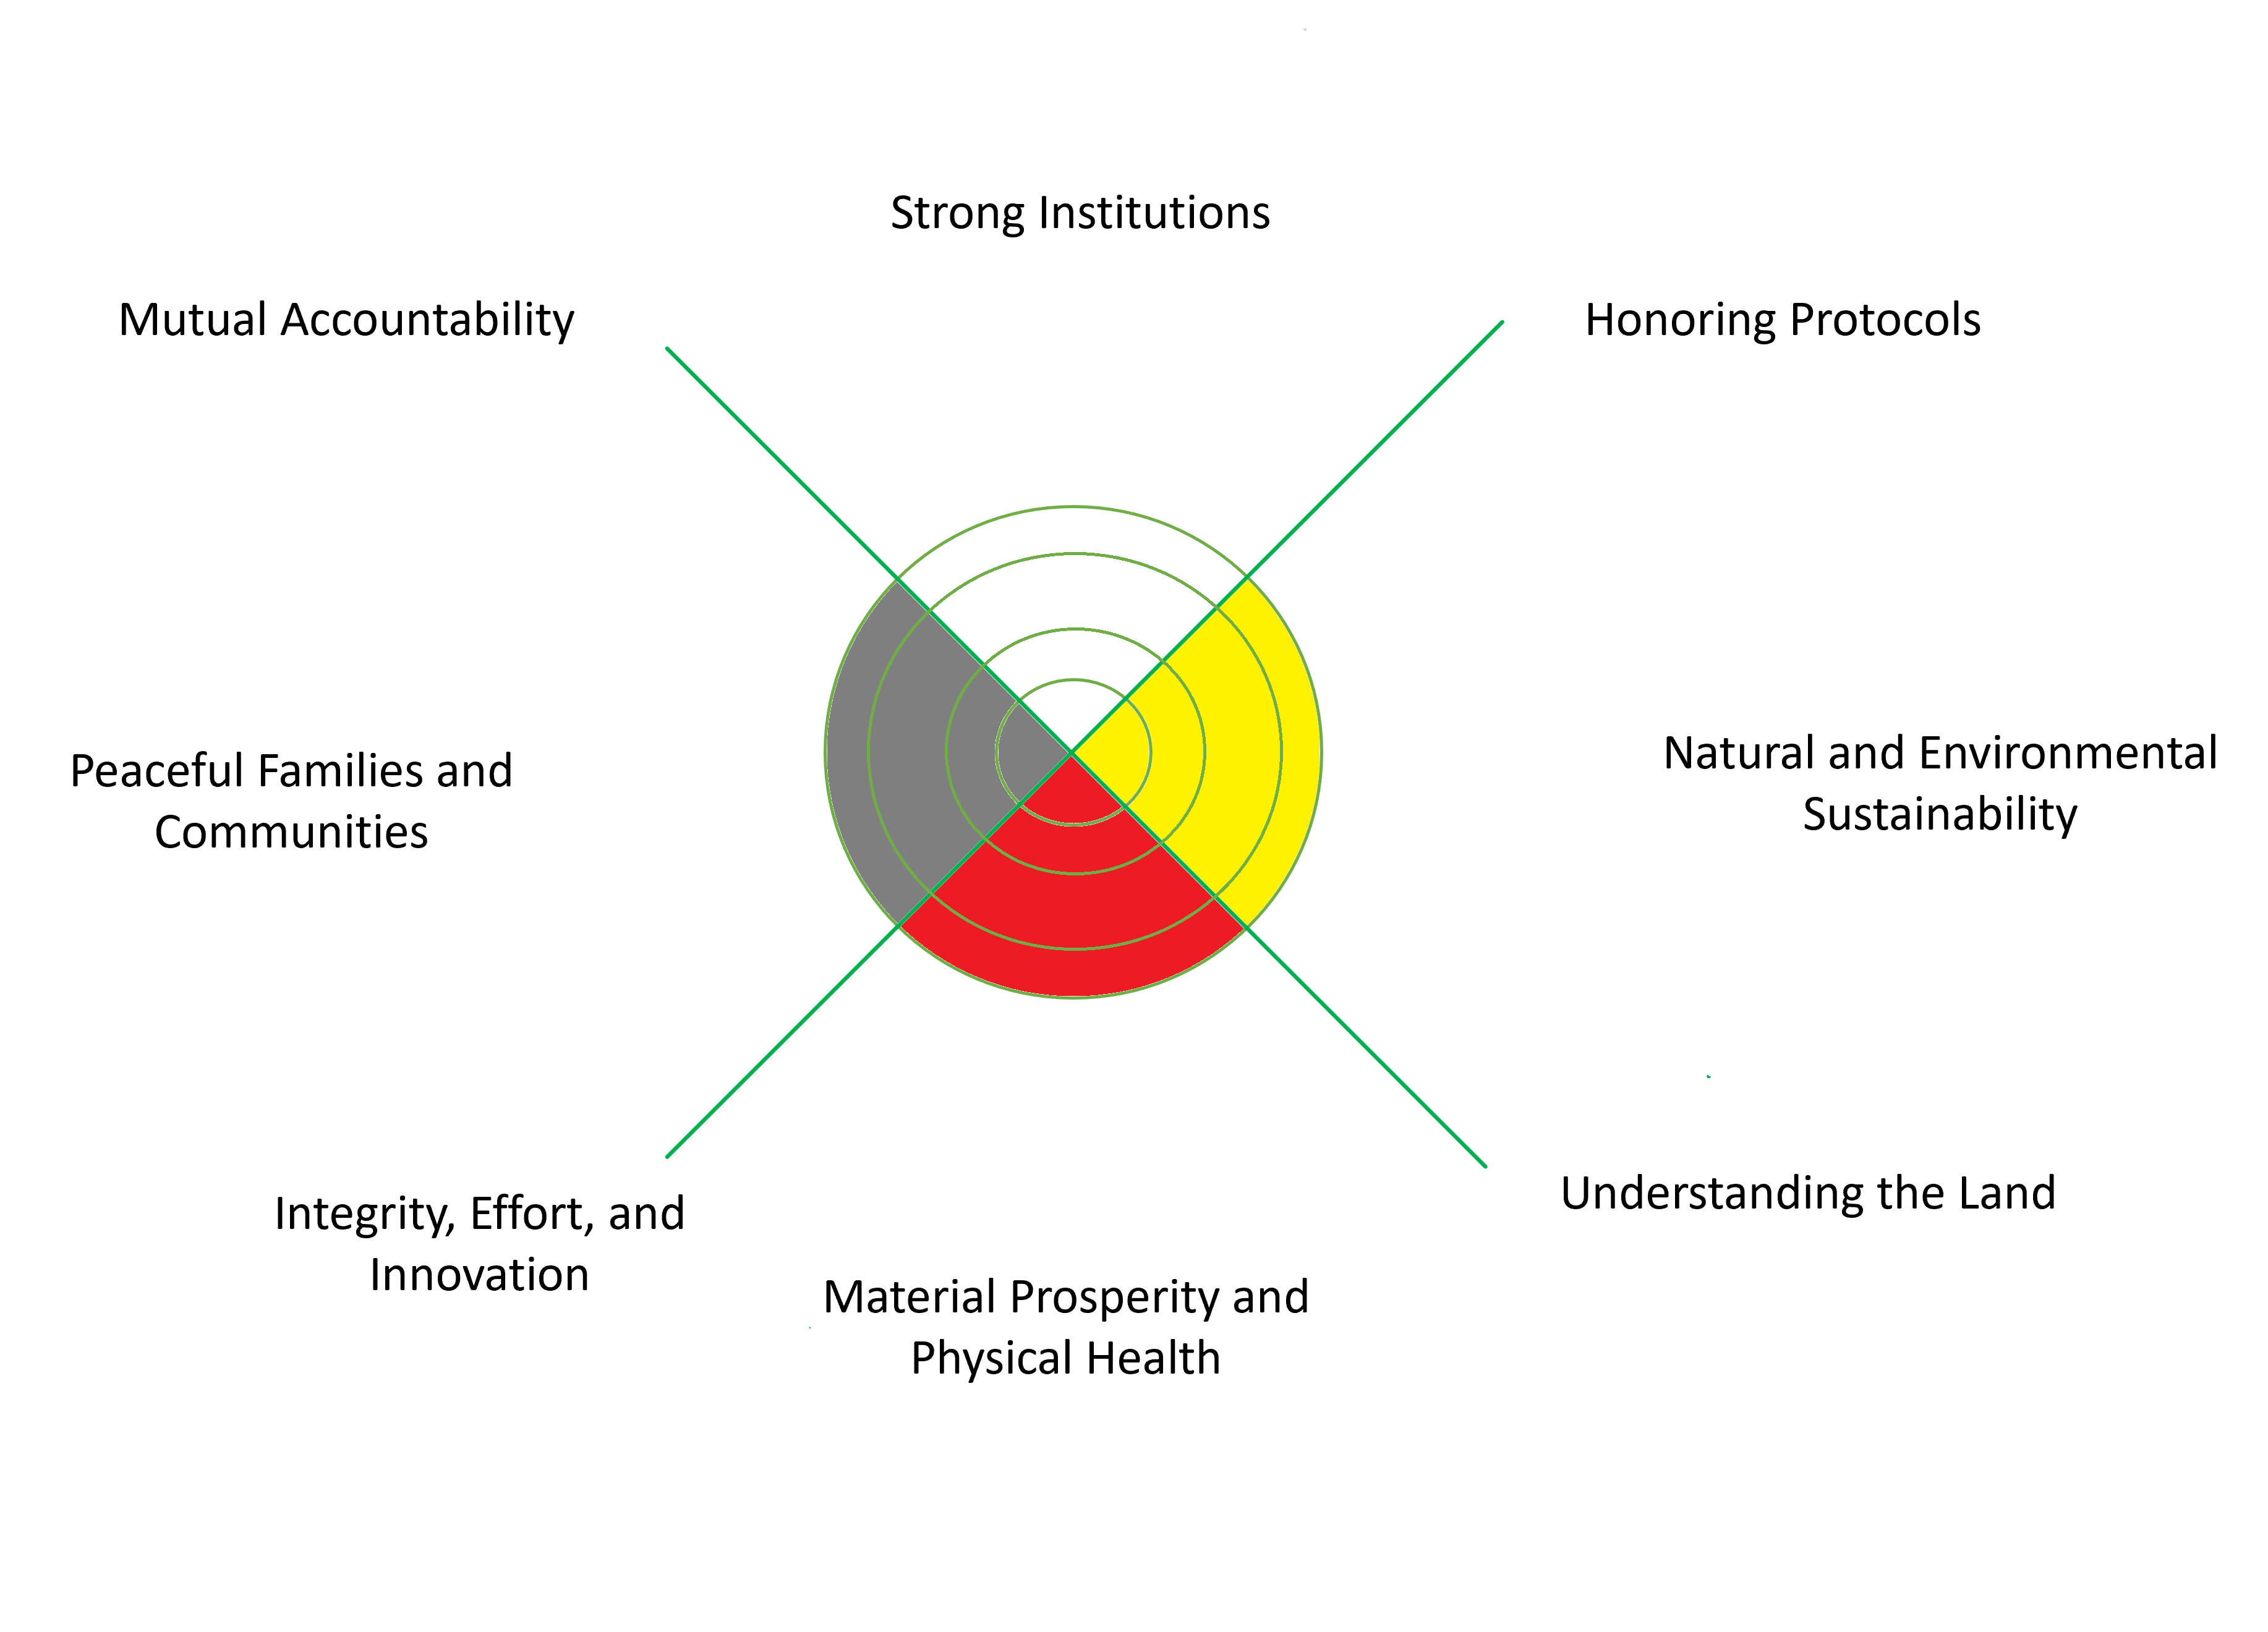
Figure 25-1 is adapted by Anya Hageman from Sherry Salway Black (1994) and other sources.
In the Medicine Wheel illustrated above, progress in material prosperity and physical health is directly related to “Integrity, Effort, and Innovation” as well as “Understanding the Land”.

Imagine that the medicine wheel is three-dimensional, shaped like a bowl. For the medicine bowl to hold more water, its sides must be built up everywhere. Water will spill from the lowest point along its edge. The bowl will not hold more water if only one quadrant of the bowl gets built higher.
A three-dimensional medicine wheel illustrates that true and lasting gains in well-being can only be made when we progress along all four quadrants of the medicine wheel at the same time. With reference to Figure 25-1, this means that the well-being of a society does not depend on work effort and innovation alone; concomitant improvements in family life, community life, institutions, and natural landscapes must be secured.
Jody Wilson-Raybould, a former Minister of Justice and Attorney General of Canada, writes
“…at the core of my Kwakwaka-wakw worldview is the belief that all things are in their greatest state of well-being when there is balance. This includes balance between humans and the natural world, between genders, between groups of peoples, within a family or community, or in how we live and organize our lives. Balance is viewed as the proper state of things, where conditions of harmony and justice flourish, while imbalance is what gives rise to conflict, contention, and harm….A society imbalanced…is like a bird with an injured wing. It cannot fly, its purpose and potential cannot be met, and all are held back.”[2]
Indigenous knowledge-keepers would appreciate the warnings of Malthus and Ehrlich that human beings cannot multiply on the earth without a matching increase in the capacity of the Land. They agree that a growing population must be balanced with, or inevitably will be limited by, the capacity of the Land. If a population is too large to observe the correct protocols and caregiving practices on the Land, its relationship with the Land will be hurt and the population will suffer as the Land withholds its bounty. They may also teach that the full potential of the Land cannot be realized if the population is too small to interact with and care for the Land. [3].
With respect to this three-dimensional medicine bowl, what is the third dimension that fills the bowl in each of the four material directions? Wisdom might be the answer, and Grace. Each generation inherits existing relationships, protocols, institutions, material wealth, and natural environments, but whether the level of water in the bowl will rise or fall depends on how the generation moves forward in wisdom and with grace.
Now that we have explored a holistic understanding of population and economic change, we return to models that focus mostly on innovation and work effort.
Gregory Clark has proposed that, when population growth leads to food scarcity and rising economic pressures, people who are literate, numerate, hard-working, and thrifty are more likely to adapt. If these people have more children than people who are less literate, numerate, hard-working, and inclined to save, the productive capacity of the economy will improve.

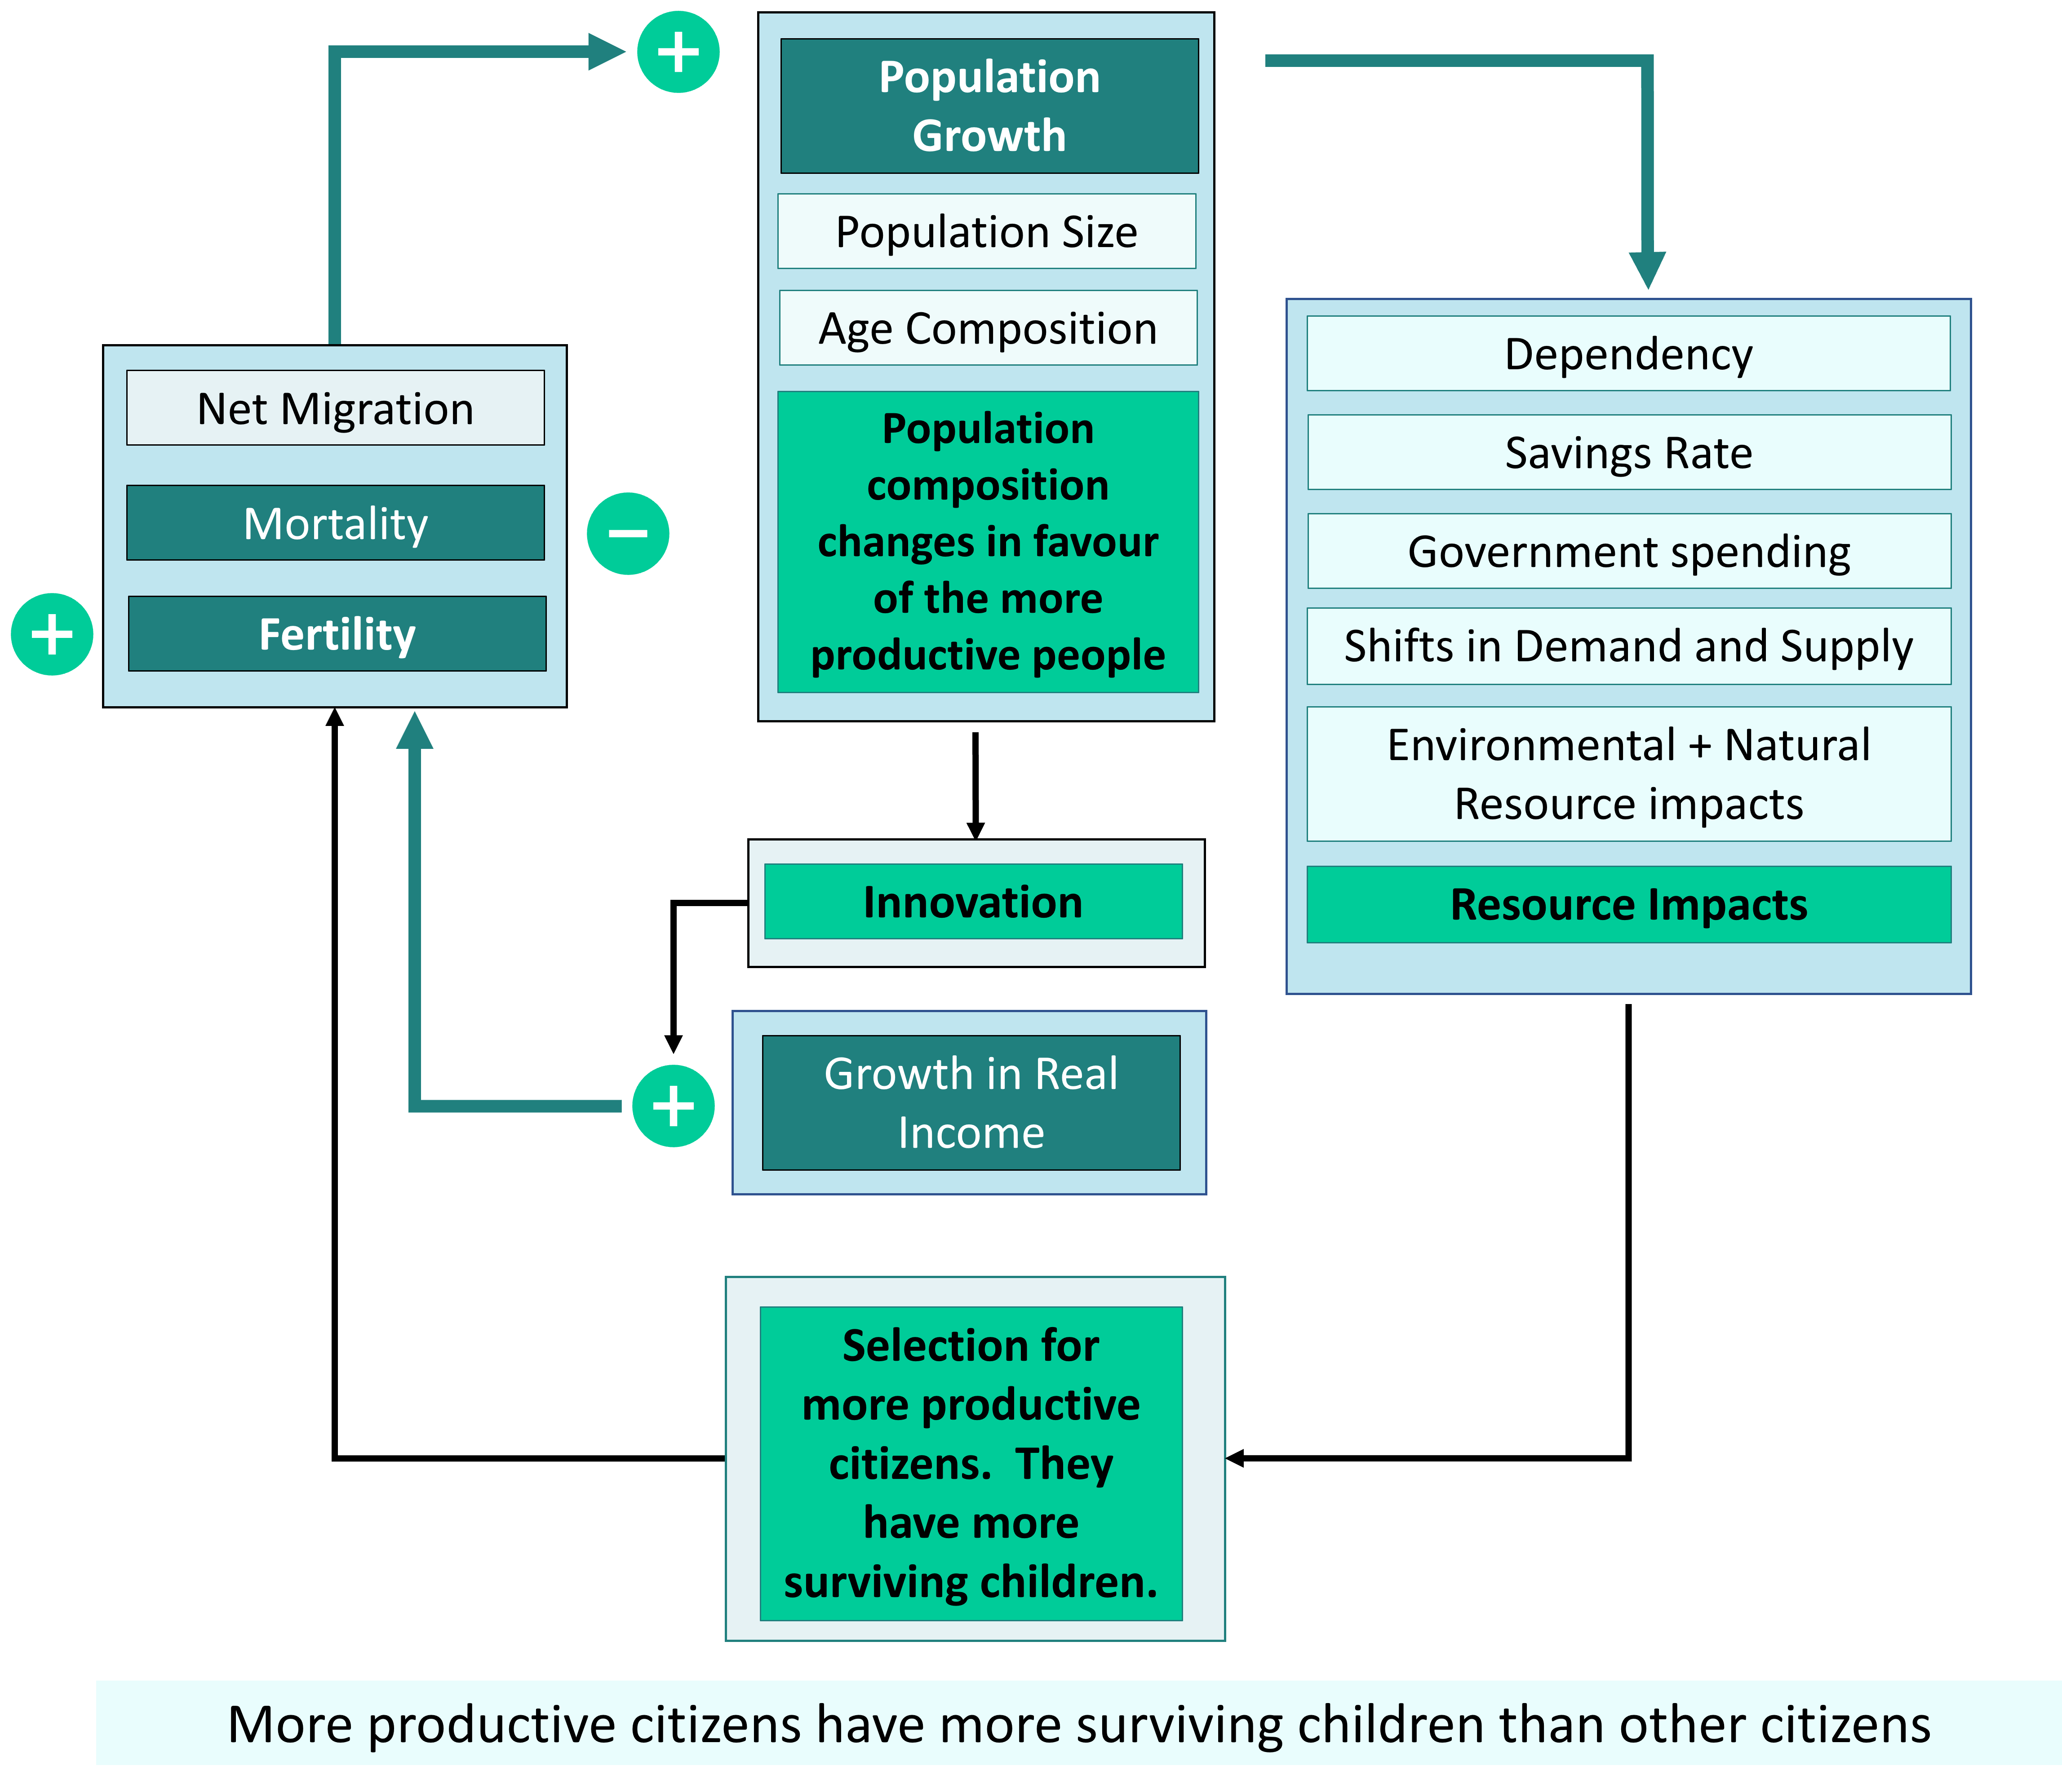
Clark argues that literacy, numeracy, thrift etc. spread through the British population at the time of the Industrial Revolution because people with these attributes, whom he identifies as the upper economic classes, had more children than other people. In a sort of “downward mobility”, these useful attributes spread through the population of Britain from the upper classes to the lower classes, enabling Britain to continue growing in population and income per person. Today, families of higher education, wealth or income typically have fewer surviving children than other families.
It is always dangerous to generalize about classes of people. Certainly to call the upper classes of England thrifty and hard-working seems a bit of a stretch. Many of these people were idle landowners whose parents and grandparents became wealthy by investing in slavery-based sugarcane plantations.
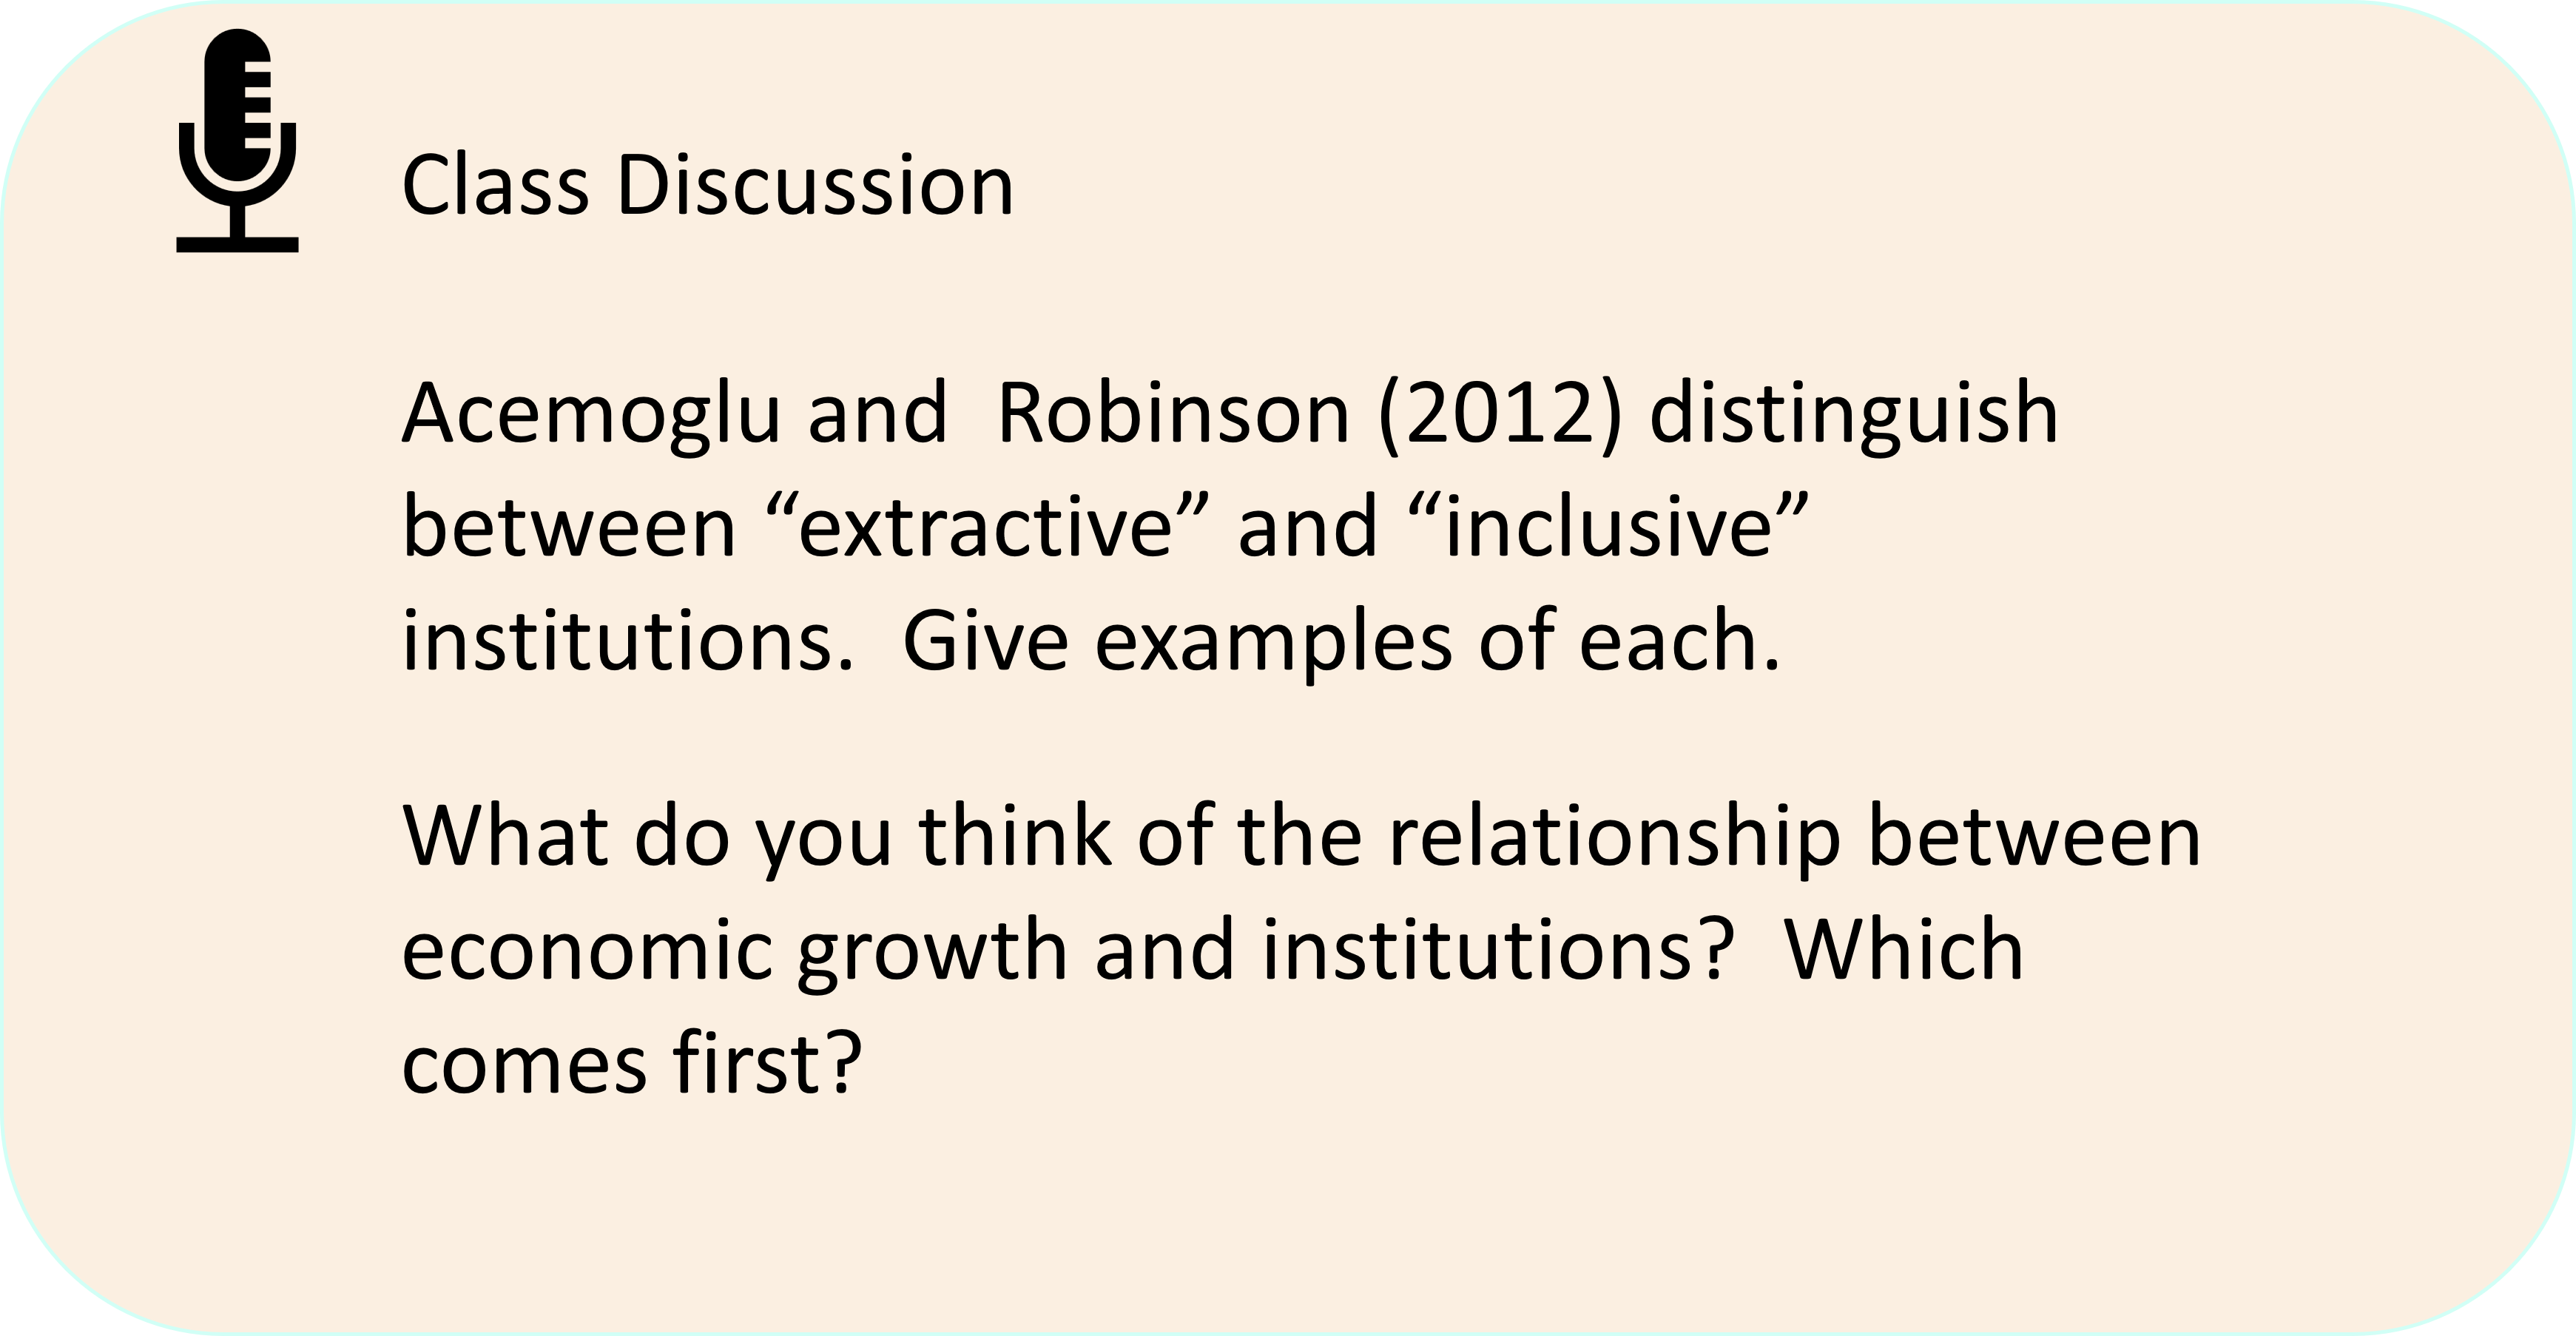
Clark ignores the fact that innovating activity will not be successful unless society’s institutional arrangements reward innovation; in particular, he ignores the fact that educational institutions spread the attributes of literacy and numeracy. In his book, Farewell to Alms (2007), Clark disagrees with the idea that good institutions precede good economies. He believes that governments and other institutions reflect economic conditions rather than shape economic conditions.
Clark’s position that institutions and beliefs are determined by the economy recalls the views of Karl Marx, who believed that the most important social fact is who owns the capital. This is ironic since, according to Marx, labour is the only source of material value, and the price of something should reflect only the labour which goes into making it. With their intellectual commitment to the primacy of labour, early Marxists did not speak of any disadvantages to population growth. They focused on distributing capital to workers so as to reduce poverty.
Clark’s model reminds us that the composition of population, not just its size or growth rate, can make a difference to the economy.
Jane Jacobs (The Economy of Cities, 1969) wrote eloquently on the importance of cities to economic development. For Jane Jacobs, a growing population can promote innovation if population density and settlement are the result. Population growth leads not only to rising prices but also to urbanization, and urbanization leads to innovation and better institutions.
Our remote ancestors did not expand their economies much by simply doing more of what they had already been doing: piling up more wild seeds and nuts, slaughtering more wild cattle and geese, making more spearheads, necklaces, [engraving tools], and fires. They expanded their economies by adding new kinds of work. Economies that do not add new kinds of goods and services, but continue only to repeat old work, do not expand much nor do they, by definition, develop.
In conjecturing how animal husbandry could have begun in an imaginary prehistoric settlement, I proposed that this new work was logically added to the older work of managing wild animals before slaughter. That work, in its turn, had also been added to older work: trading obsidian to many people who came to [the settlement] seeking to bargain for it. And that trading service, it turn, had been added to the settlement’s own way of getting obsidian: bargaining for it with the neighbouring tribe whose people mined it at the volcano. And the volcano people had doubtless added that work to their own still older work of preparing flints and other stones for weapons.
In short, I was presuming that each kind of new work, as it appeared in this prehistoric economy, was added logically and “naturally” to a specific bit of older work. That is how innovations are made in our own time. It is also how work has diversified and expanded during historical times.
This process is of the essence in understanding cities because cities are places where adding new work to older work proceeds vigorously. Indeed, any settlement where this happens is a city. Because of this process city economies are more complicated and diverse than the economies of villages, towns and farms, as well as being larger. This is why I have also argued that cities are the primary necessity for economic development and expansion, including rural development.[4]
Jacobs also celebrates the largeness, disorder, crowdedness, and danger of cities, believing that these features stimulate even more innovation. In her view, nothing must be done to squelch the vitality of the economic organism that is the city.

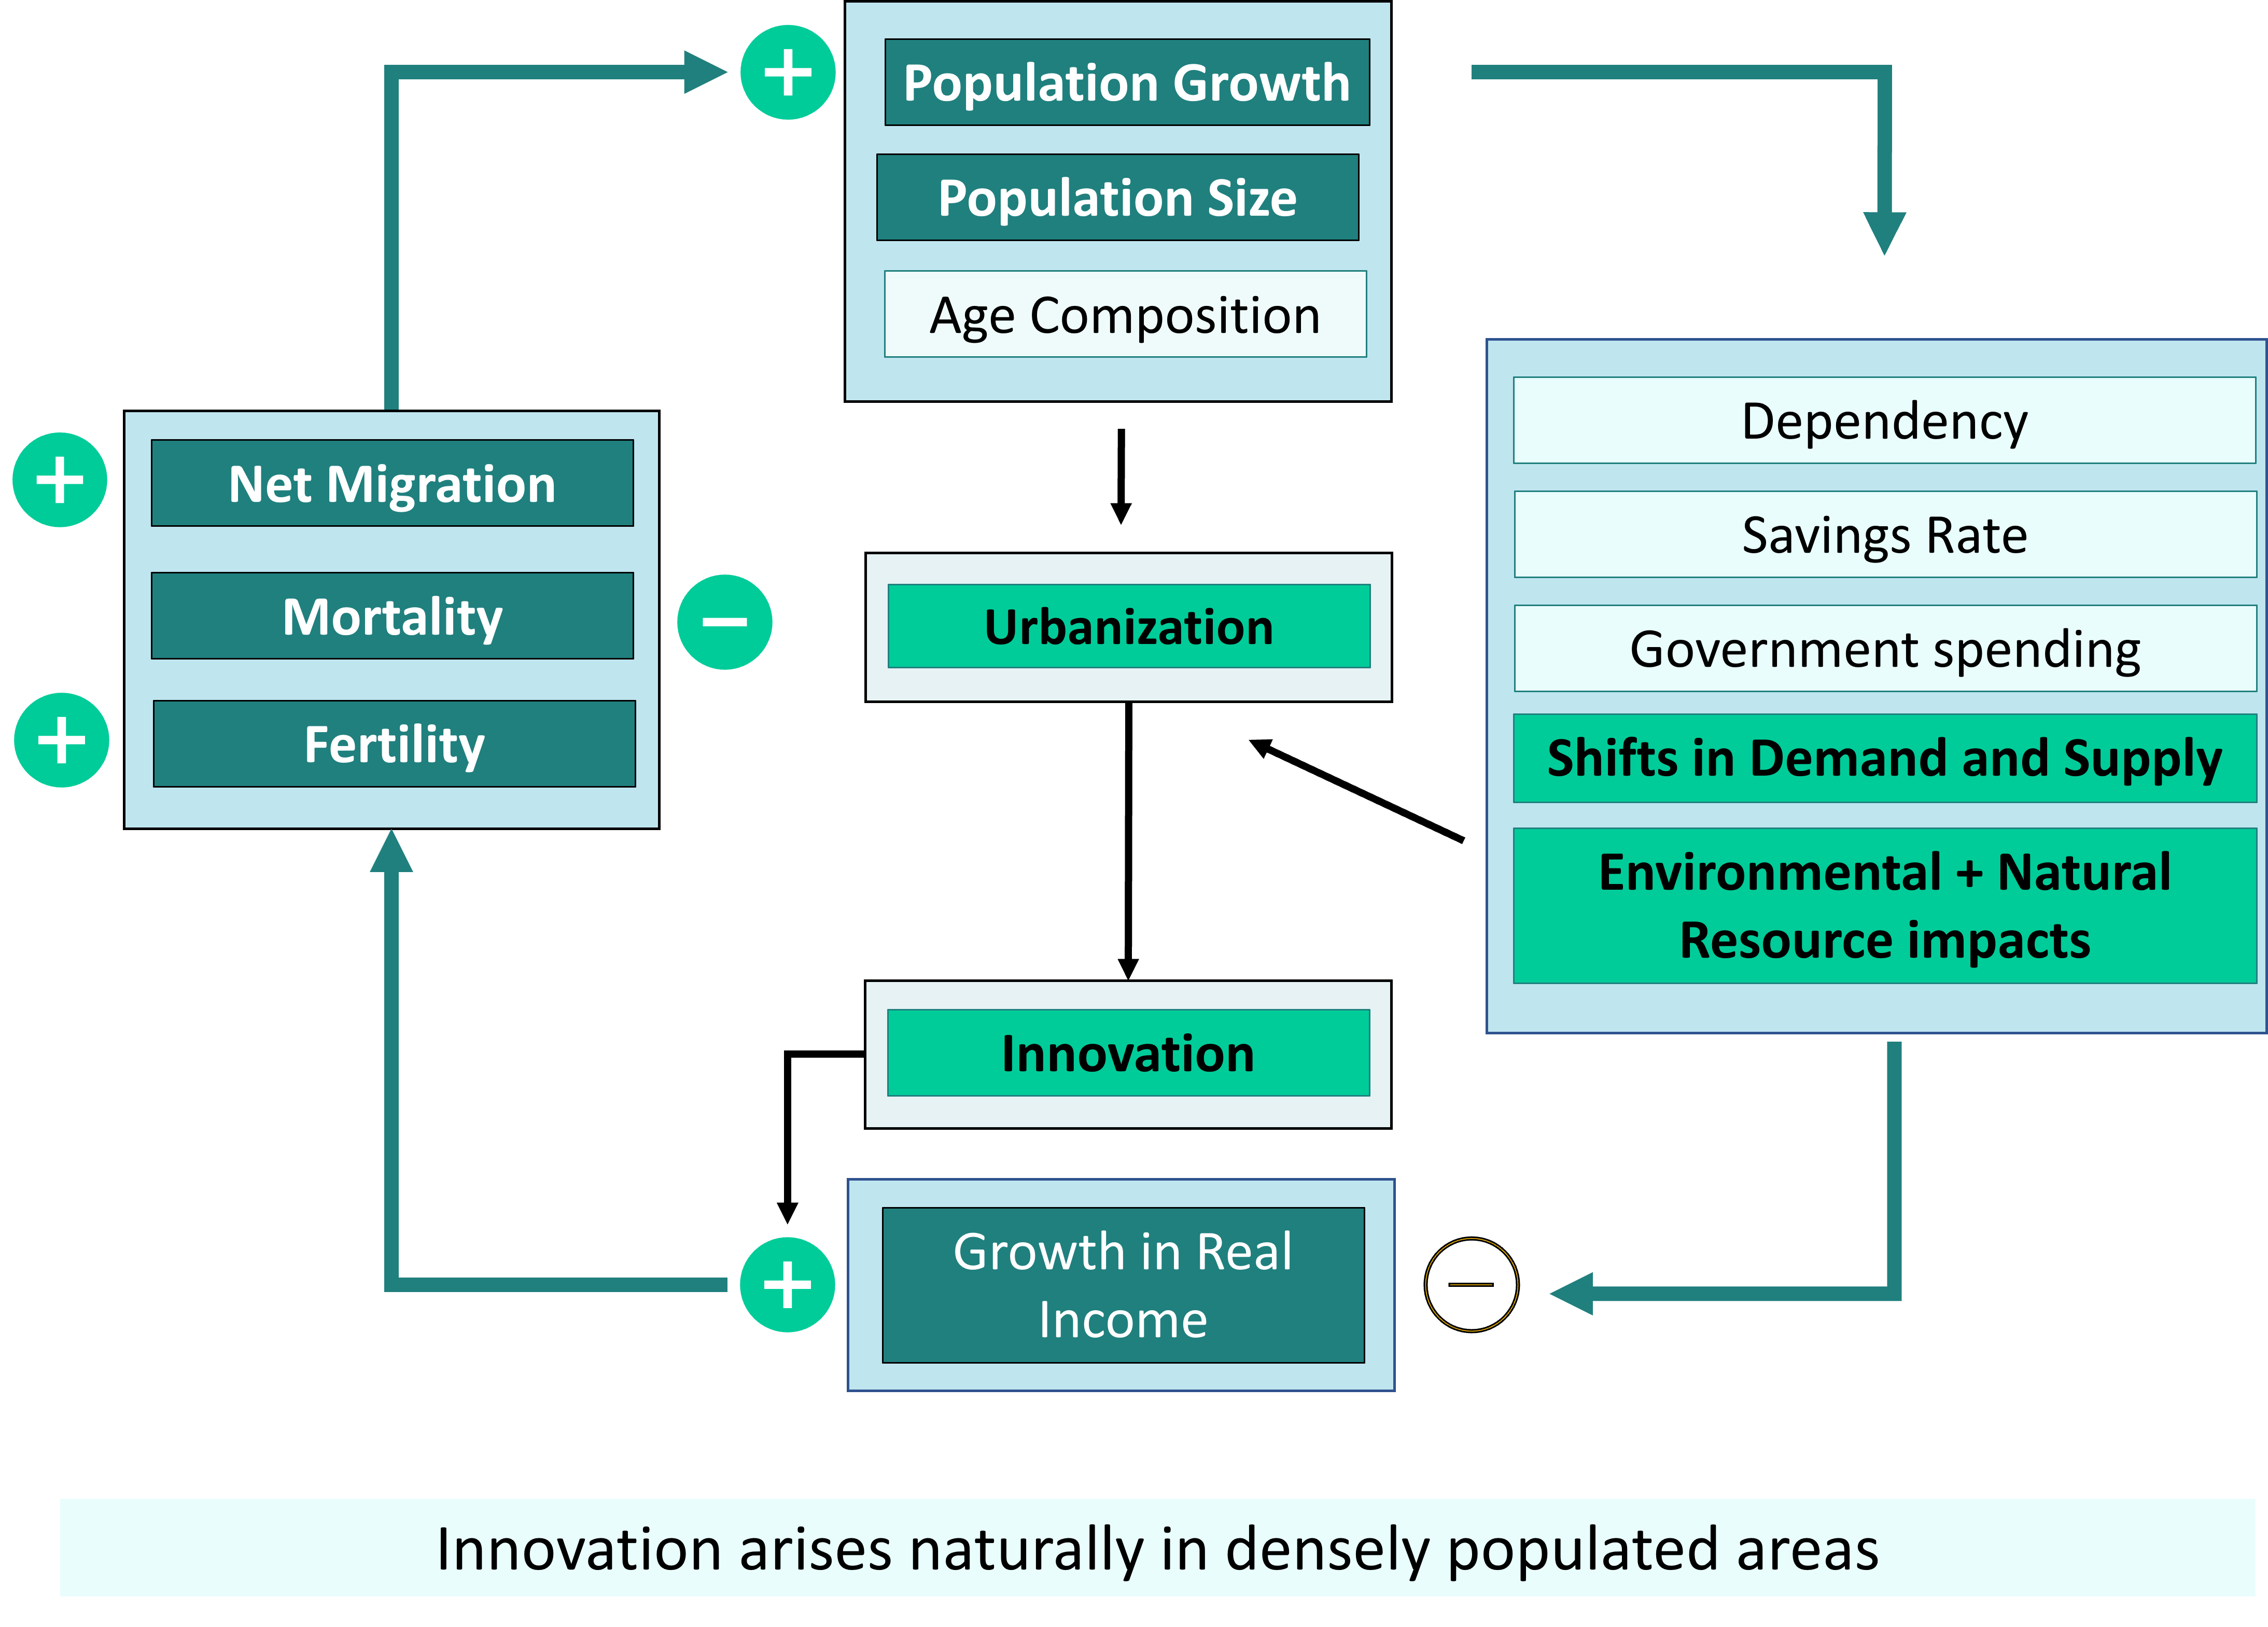
Jared Diamond (Guns, Germs and Steel (1999)) agrees that innovations emerge as small populations become larger. In very small populations, everyone knows everyone else’s family, and intermediation can happen spontaneously if conflicts arise. In larger societies, however, stranger-to-stranger conflicts are more common, and an independent legal system is needed to resolve disputes. Once the town is so large that most people are strangers to one another, a system of taxation and spending is needed if public goods like bridges and canals are to be built, and if the poor are to be fed. Normally, small populations must grow to a critical mass before they adopt more sophisticated legal and governmental institutions. The new institutions foster innovation and trade.
Diamond, unlike Clark, believes in the importance of institutions.
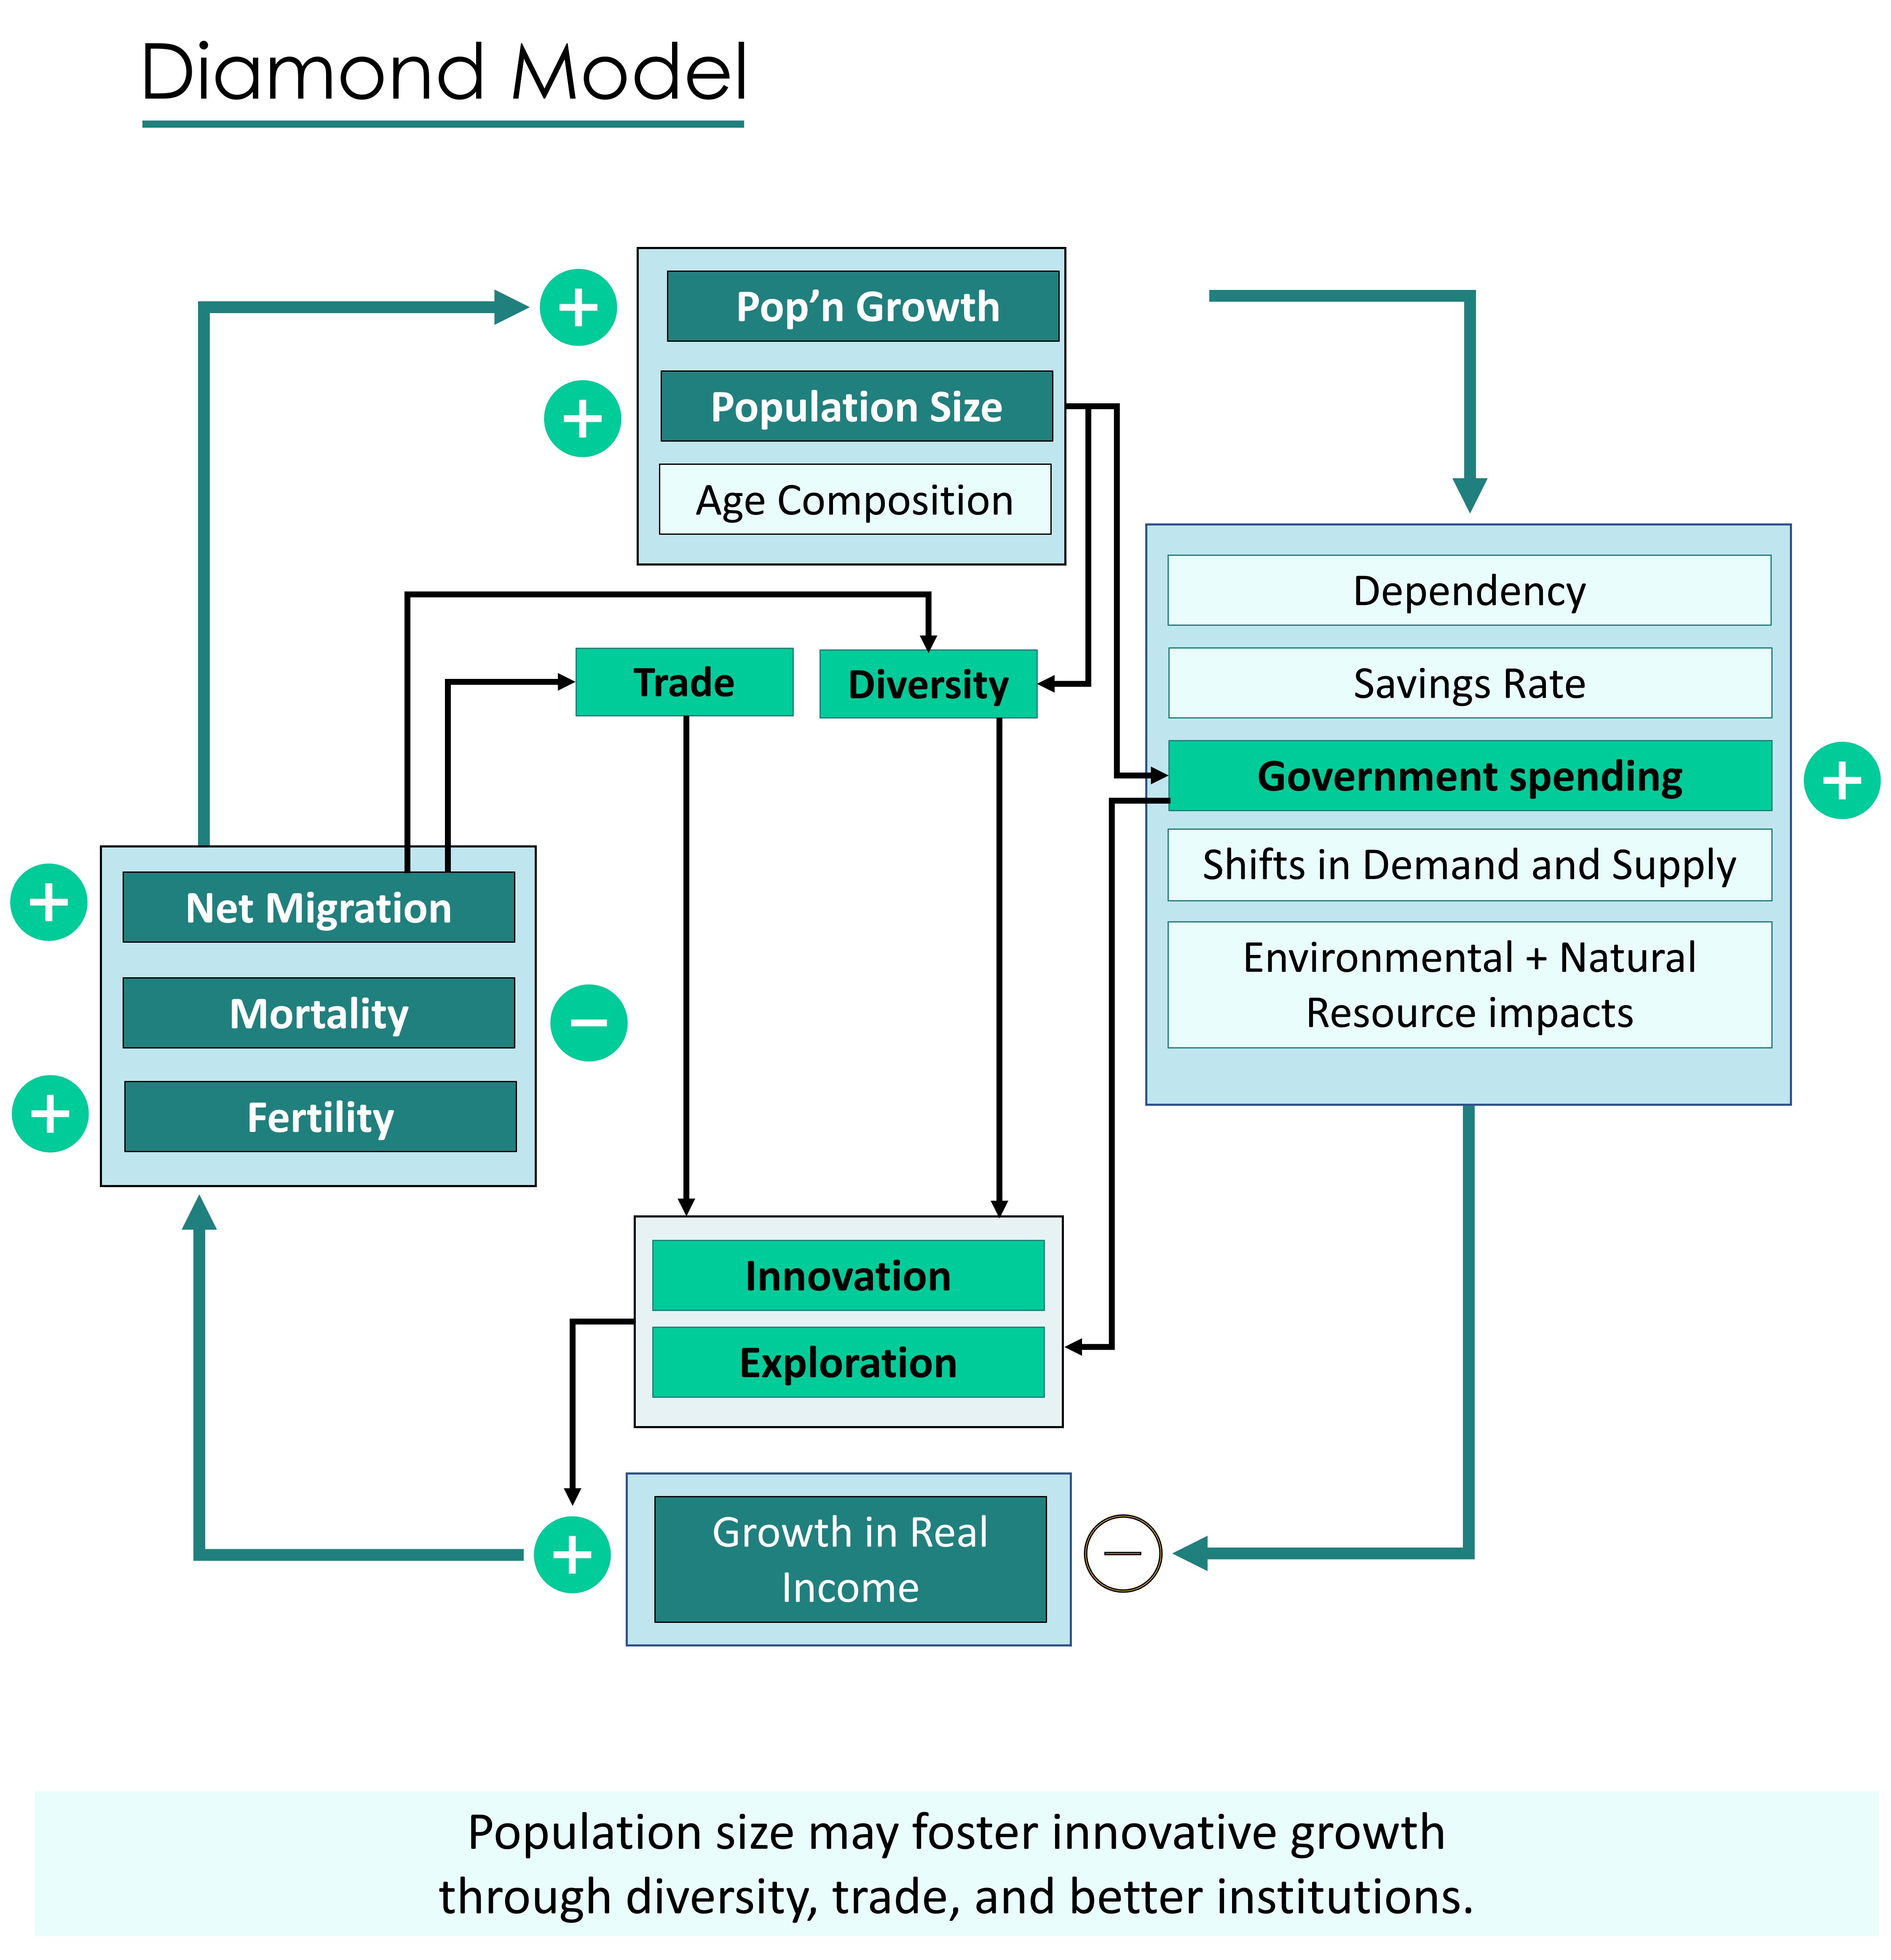
To Diamond, large populations have several advantages over small populations. Not only do they acquire more sophisticated institutions, they also have more military might. They develop resistance to pandemic diseases. They benefit from a greater diversity of abilities, aptitudes, and ideas within the population.
Diamond, once again in contrast to Clark, explains economic development in terms of diversity rather than selection. Regions with more diverse plant and animal life were able to develop richer agriculture. Regions with more diverse trading partners were able to develop richer technology and intellectual life. And regions with larger populations had more ability to attract trading partners, develop new ideas, and develop resistance to contagious disease. Diamond writes about New Guinea and Australia that
Human populations of only a few hundred people were unable to survive indefinitely in complete isolation. A population of 4,000 (Tasmania) was able to survive for 10,000 years, but with significant cultural losses and significant failures to invent, leaving it with a uniquely simplified material culture.[5]

Which of these is the best model? We do not have to choose among the ones presented in this chapter. The reader can develop their own, blended model using whatever insights have been offered above, plus additional insights.
We have also to remember that a variety of powerful forces, such as secularization, social and religious movements, natural disasters, and war are not entirely determined by economics and demography. They are, to a significant extent, exogenous to any model of population and economic change, and can set it spinning in new directions. They are the “bath” in which our model of economics and demography sits. The “bath” of knowledge, politics, inspiration, social norms, and access to resources was very different before and after the Industrial Revolution, and consequently the Malthusian model has become less and less descriptive of the relationship between economics and demography.
We want to be wary of oversimplifying life.
Jared Diamond puts it this way: “We tend to seek easy, single-factor explanations of success. For most important things, though, success actually requires avoiding many separate causes of failure.”
Allen Kelley (1988) has said
What is clear is that an assessment of the impact of population growth on economic development is highly complex, that problems like unemployment, famine, and malnutrition are caused by many factors (including rapid population growth), and that an emphasis on policies of slowing population growth without simultaneously confronting the other fundamental causes may well lead to disappointing results.
Perhaps the best thing about this chapter is that we have learned to identify major patterns of thought around population and economic change, and we now know well enough to not put too much stock in any one of them.

Within the natural, cultural, political, and institutional environment we live in, economic pressures and opportunities are mediated through the family and other relationships. These economic pressures and opportunities consequently affect our health, life expectancy, and fertility. They also affect our relationships themselves: our decisions about when to marry or cohabit, whether to break up, how many children to have, and where to live. Ultimately they affect the size, growth rate, and age-sex composition of the population in each particular region.
In turn, the size, growth rate, and age-sex composition in a region make a difference to its economy. Mediated by institutions, markets, beliefs, and traditions, or the lack of institutions and markets, the region’s demographics affect prices, sustainability, wages, the standard of living, and well-being.
We have closely examined all these pathways. Our study does not provide us with answers about right and wrong ways to live, or about right and wrong policies to implement. But we know a fair amount about the material consequences set in motion by changes to population or the standard of living, or by policies to affect the population. Let’s use this knowledge to calm panic, build a healthy, inclusive, and sustainable future, and enjoy life.

- Where might “institutions” be added to the Malthusian flowchart?
- Where might “institutions” be placed in the Boserup-Simon flowchart?
- Contrast the role of family in the Indigenous model and the Clark model.
- What might a complete breakdown of family do to any of these models?
The following questions do not have answers provided.
- Which of the models presented in this chapter do you find most compelling, and why?
- Design your own model of population and economic change drawing on what you feel are the best features of any of the models in this chapter.

