22.4 Financial Statement Reporting and Analysis
Financial statement analysis is the process of reviewing and interpreting a company’s core financial statements to make better business decisions. While it sounds simple, it isn’t. Many tools have been developed in the financial community to assess a business’s financial performance. In simple terms, the process usually starts with a high-level liquidity, activity, profitability, and coverage ratio analysis of the core financial statements and of the various supplementary financial reports such as interim and segmented financial reports. The analyses of these financial reports can also incorporate other types of ratio analysis such as common size analysis and trend analysis. These analytical techniques have been covered in detail in previous chapters of this text and in the previous intermediate financial accounting text. A summary of the commonly used ratios is presented at the end of this chapter for review purposes.
22.4.1. Interim Reporting
In basic terms, interim reports cover periods that are less than one year. As previously stated, interim financial statements are often prepared on a monthly or quarterly basis. They are increasingly popular as more frequent disclosures are becoming the new norm in today’s economy. While ASPE does not provide standards regarding interim reporting, IFRS does provide guidance that IFRS compliant companies are encouraged to follow and to disclose.
In many cases, the same headings, subheadings, and subtotals would be employed for both the interim and the annual financial statements. If segmented financial statements are employed by a business, reportable segments would also be applied to the interim financial statements.
IFRS supports the idea that each interim period is to be reported as separate and distinct. Also, the same policies that are used for annual financial statements are to be used for interim financial statements as well. This means that deferrals and accruals used in the interim statements would follow the same principles and tests as those that are used in the annual financial statements. Simply put, revenues would be recognized and reported when earned (revenue recognition) and expenses incurred to earn those revenues would be reported when goods and services were received (matching principle). Accounting policies such as depreciation, inventory cost formulas, and required disclosures, such as earnings per share from the annual financial statements, would also be applied equally for interim statements. IFRS requires the same five core financial statements for interim reporting as required for the annual reports. Interim reports can be condensed as long as they include the same headings, subtotals, and comparative columns as in the annual reports.
Review Suncor Energy Inc.’s 2015 Annual Report[1] and financial statements. The quarterly financial summary for each interim quarter can be found starting on page 120.
The financial data in the current Quarterly Financial Summary is comparative on a quarterly basis with the previous year, 2014, and is highly condensed. Note that the interim report also breaks down the interim reporting periods into four product line segments, namely oil sands, exploration and production, refining and marketing, and corporate (Suncor Energy Inc., n.d.). Segmented reporting will be discussed in the next section.
Interim reporting has several challenges. For example, what happens when there is a change in accounting principle? If this change were to occur in the second or third quarter, how would this affect the first quarter interim financial statements? The consensus is that, even if the change of a specific accounting policy, such as a depreciation method, is prospective, the annual change should be prorated to each of the interim accounting periods so as not to over- or understate any specific quarter. This would lessen any tendency for management to manipulate accounting policies within a specific quarter to influence bonuses or operational results targets. As such, even though the change in policy is applied prospectively for the fiscal year, if interim statements are prepared, the change in policy would be applied proportionally between each quarterly period to smooth the results over each quarter of that fiscal year.
Further challenges to interim reporting are the cyclical and seasonal swings experienced by businesses within a fiscal year. While revenue intake can be concentrated over a limited number of months, expenses may continue to be incurred throughout the year. If IFRS guidelines are followed, the principles of revenue recognition and matching will continue to be applied within each of the interim periods and the same tests used for annual financial statements would be applied to interim reports. With seasonal swings, this can result in volatile earnings comparisons between quarters, which can be seen in the wide fluctuations of Suncor Energy Inc.’s quarterly earnings per share amounts as shown in the quarterly financial summary report referenced above.
Additionally, difficulties exist regarding certain allocations such as for income taxes and earnings per share. Under IFRS, each interim period is to be independent of each other and interim allocations are to be determined by applying all the same tests as those used for the annual reports.
Note that interim financial reports are unaudited, as evidenced by the “unaudited” notation under the title of Suncor Energy Inc.’s quarterly financial summary report. While some stakeholders continue to push for an examination of the interim reports to provide some assurance, auditors remain reluctant to express an opinion on interim financial statements. As a result, there will always be a trade-off between the need for assurance and the need to produce the interim report on a timely and cost-effective basis.
22.4.2. Segmented Reporting
Structural analysis is the study of relationships between resources, people, activities, and products. Segmented, or disaggregated, financial reporting is an example of how structural analysis can be used for financial analysis purposes. As mentioned in the opening comments of this chapter, more and more businesses are diversifying their business lines. This creates the need for additional reporting about those business lines—how each contributes to the overall entity in terms of profits, growth, and risk.
Segmented reporting enhances decision making and analysis as it highlights business components that have strong financial performances over those that are weak, or even losing, performers. Management can subsequently make decisions about which components to keep and which components to discontinue as part of their overall business strategy. Keep in mind, however, that not all business components that experience chronic losses should be automatically discontinued. There can be strategic reasons for keeping a losing component. For example, a company may retain a specific marginal, or losing component, that produces a particular part needed for the entity’s manufacturing process. Keeping this business line guarantees a steady supply of these critical parts, thus ensuring a smooth and uninterrupted production process with resulting sales and profits.
As different components within a company can have different gross margins, profitability, and risk, segmented reporting can also assist in forecasting future sales, profits, and cash flows. With segmented reporting comes a better understanding of the company’s performance and future prospects, resulting in better decision making overall.
Although there are many, the two most common segmented activities are by products (or by business lines) and by geography. Either the physical location of the company’s assets or the location of its customers can be the geographic basis for segmentation.
For ASPE, there is currently no guidance regarding segmented reporting. As such, privately held corporations tend not to report segmented information. For IFRS companies, however, a segment must meet several characteristics and quantitative thresholds in order to be considered a reportable segment for the purposes of the published financial statements.
Reportable Segments
Reportable segments possess certain characteristics, such as having separate and distinct financial information that is regularly monitored by the senior operations management. These are then tested for materiality and are identified as a reportable segment if at least one of the following conditions is met:
- Its reportable revenue, including inter-company sales and transfers, is 10% or greater than the company’s combined revenue of all the segments.
- Its reported profits or losses, in absolute amounts, are 10% or greater than the greater of:
- the combined reported profits
- the combined reported losses.
- Its assets are 10% or greater than the company’s combined assets of all the segments.
Below is some sample data from a fictitious company:
| Possible Reporting Segments Data in $ millions |
10% Revenue Threshold |
10% Profit/loss Threshold |
10% Assets Threshold | |||
|---|---|---|---|---|---|---|
| Segment | Total Revenue | Reported Profit/loss |
Assets | #1 | #2 | #3 |
| Canada | $500 | $50 | $300 | Y | Y | Y |
| US | 800 | 16 | 100 | Y | Y | Y |
| Central America | 300 | (5) | 35 | |||
| South America | 600 | (6) | 40 | Y | ||
| Europe | 400 | 10 | 70 | |||
| Asia | 900 | 36 | 200 | Y | Y | Y |
| Middle East | 700 | 25 | 150 | Y | Y | Y |
| $4,200 | $126 | $895 | ||||
Tests:
- Its reportable revenue is 10% or greater than company combined revenue of all segments (10% × 4,200) = $420 threshold
- Its reported profits/losses (in absolute amounts) are 10% or greater than the
greater sum of:- the combined reported profits = $137
- the combined reported losses = $11
Profits are greater, so (10% × $137) = $13.7 threshold in absolute terms (ignoring + and – math signs)
- Its assets are 10% or greater than the company’s combined assets of all the segments (10% × $895) = $89.5 threshold
Based on the three threshold tests above, Canada, the US, South America, Asia, and the Middle East all meet at least one or more of the tests.
Once these segments are identified, IFRS recommends that reportable segments comprise 75% or more of a company’s overall combined sales to unrelated customers. They also recommend that the number of reporting segments be limited to ten in order to lessen the possibility of information overload. In the example above, the 75% threshold is $3,150 ($4,200 × 75%), and all five segments meeting at least one of the three test criteria above total $3,500 ($500 + 800 + 600 + 900 + 700). As such, this test has been met. It is important to note that management can override these tests and report a segment if they consider the segmented information to be useful to the stakeholders.
There are several issues, however, with segmented reporting. For instance, accounting processes such as allocation of common costs and elimination of inter-segment sales can be quite challenging. For this reason, allocation of common costs is not required. As such, thorough knowledge of the business and of the industry in which the company operates is essential when utilizing segmented reports, otherwise investors may find segmentation meaningless or, at worst, they may draw incorrect conclusions about the performance of the business components. For example, a business line may repeatedly report segment losses causing shareholders to put pressure on management prematurely to discontinue that line even if the better long-term strategy is to keep it. Additionally, the company may be reluctant to publish segmented information because of the risk it poses to them by way of competitors, suppliers, government agencies, and unions potentially using this information to their advantage and to the detriment of the company.
Review Suncor Energy Inc.’s 2015 Annual Report[2] and financial statements. The information in the notes to the financial statements regarding segmented information can be found on pages 85 to 87.
In the segmented reports, note that Suncor Energy Inc. provides general information about each of its reportable segments and policies regarding inter-segment sales and profit. The segmented financial report is condensed, but provided that senior management regularly reviews them, the line items identified are the minimum required disclosures according to IFRS. The segmented reports must also be reconciled to the core financial statements for revenues and operating profits/losses. While IFRS also states that assets and liabilities are to be reconciled, the segmented report only shows a reconciliation of non-current assets to the core statement of financial position. Other IFRS disclosures identified for segmented reporting include revenues from external customers as well as Canada versus foreign revenue and capital assets. While this is not an exhaustive list of all IFRS required segmented reporting disclosures, it provides a sense that these disclosures are extensive.
22.4.3. Proforma Financial Statements
A pro forma financial statement is forward-looking, based on certain assumptions and projections. A corporation might want to see the effects on net income resulting from adding or dropping a reportable segment, increasing money spent on a marketing campaign, implementation of certain research or development plans, or from adoption of a different accounting policy.
The projected financial statements are prepared on the basis of estimates with these assumptions included, so that management can see the impact these assumptions might have on profits or net assets. The proforma statements can include any of the core financial statements and can be for a single year, or multiple years. In other words, it results in a set of any financial statements that looks into the future, rather than looking at the past as is the case with conventional financial statements.
If the projected assumptions predict a decrease in net income or net assets, the company can respond by making operational changes much more proactively, such as increasing sales prices or decreasing expenses, before these projections become reality. The company can incorporate certain assumptions to see their impacts, such as whether sales or expenses are predicted to run higher in the first quarter of the year than in the second. They can determine whether a marketing campaign need an extra boost during a particular time of the year. In other words, they provide the company with invaluable information to help management make the best decisions.
Once the impacts of proposed decisions are quantified, pro forma income statements can be incorporated into the company strategic plan (another futuristic document), and provide important benchmarks with which to measure performance going forward, or they can be used as the basis for the work plan or budget documents for the next fiscal year.
Sounds too good to be true? Consider that the development of proforma statements is a bit like trying to read the stock market. This is because proforma income statements that report net income and net assets are based on estimates of unknown future events. Also, they do not need to follow GAAP and management can manipulate the financial results to provide a picture to investors that is rosier than reality.
Proforma statements can be a powerful predictive tool for decision-making, but they will only be as good as the estimates and assumptions put into them, and the intentions of management, especially if suspected of trying to deceive investors in the pro-forma modification of GAAP net income or net assets.
22.4.4. Analysis Techniques
Many different types of ratios are used in the analysis of financial statements. For instance, ratios applied to the financial statements include liquidity ratios, profitability ratios, activity ratios, and coverage ratios. While other types of ratios exist, including vertical/common size analysis and horizontal/trend analysis, they have been covered in detail in previous chapters of this text and in the previous financial accounting text. However, a summary of the commonly used ratios, and a brief overview of common size and horizontal analysis, are presented below for review purposes:
| Ratio | Formula | Purpose |
|---|---|---|
| Liquidity ratios – ability to pay short term obligations | ||
| Current ratio |
Current assets |
ability to pay short term debt |
| Quick ratio (or acid test ratio) |
Cash, marketable securities and net receivables |
ability to pay short term debt using near-cash assets |
| Current cash debt coverage ratio |
Net cash provided by operating activities |
ability to pay short term debt from cash generated from its current fiscal year operations (statement of cash flows) |
| Ratio | Formula | Purpose |
|---|---|---|
| Profitability ratios – ability to generate profits | ||
| Profit margin | net income for each dollar of sales | |
| Return on total assets | overall profitability of assets | |
| Return on common shareholders’ equity |
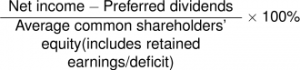 |
overall profitability of common shareholders’ investment |
| Earnings per share | 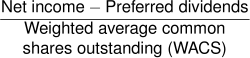 |
net income for each common share |
| Payout ratio | percentage of earnings distributed as dividends | |
| Ratio | Formula | Purpose |
|---|---|---|
| Activity ratios – ability to effectively use assets | ||
| Accounts receivable turnover | how quickly accounts receivable is collected | |
| Days’ sales uncollected | average # of days that sales are uncollected (this can be compared to the credit terms of the company) |
|
| Inventory turnover | how quickly inventory is sold | |
| Days’ sales in inventory | average # of days to sell inventory. | |
| Accounts payable turnover | how quickly accounts payable is paid | |
| Asset turnover | the ability of assets to generate sales | |
| Ratio | Formula | Purpose |
|---|---|---|
| Coverage – ability to pay long-term obligations | ||
| Debt ratio | percentage of assets provided by creditors* | |
| Equity ratio | 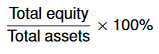 |
percentage of assets provided by investors* |
| Cash debt coverage ratio | 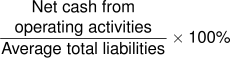 |
the ability to pay current and long-term debt from net cash from operating activities (statement of cash flows) |
| Book value per common share | the amount per common share if company liquidated at reported amounts. | |
* These two ratios can also be expressed as a single debt-to-equity ratio; Total liabilities ÷ Total equity.
A low debt-to-equity ratio indicates that creditors have less claim on the company’s assets resulting in less financing risk.
A higher debt-to-equity ratio can mean a higher risk for financial difficulty if the debt and interest cannot be paid when due.
Common Size Analysis
Common size, or vertical, analysis takes each line item on a financial statement and expresses it as a percentage of a base amount. The base figure used in a balance sheet is usually total assets, while for the income statement, it is usually net sales.
Below is an example of common size analysis of an income statement:
| Common Size Income Statement As at December 31 |
||||
|---|---|---|---|---|
| 2020 | 2019 | |||
| Revenue | 100.00% | 100.00% | ||
| Cost of goods sold | 60.00% | 58.00% | ||
| Gross profit | 40.00% | 42.00% | ||
| Operating expenses | ||||
| Rent | 2.00% | 2.00% | ||
| Salaries and benefits expense | 6.00% | 5.80% | ||
| Depreciation and amortization expense | 2.00% | 2.00% | ||
| Office supplies expense | 0.50% | 0.40% | ||
| Travel | 1.00% | 1.10% | ||
| Utilities expense | 1.00% | 1.00% | ||
| Other operating expenses | 0.20% | 0.20% | ||
| 12.70% | 12.50% | |||
| Income from operations | ||||
| Other revenues and expenses | ||||
| Interest expense | 0.40% | 0.35% | ||
| Income before income taxes | 26.90% | 29.15% | ||
| Income tax expense | 4.00% | 3.80% | ||
| Net income | 22.90% | 25.35% | ||
These percentages can be compared to the previous years’ data, competitors’ financials, or industry benchmarks. An example of a typical common size ratio that is compared in this way is the gross margin percentage. A downside of ratio analysis, however, is its potential to foster an environment where management chooses accounting policies, such as inventory costing, to influence a favourable gross profit for personal reasons such as bonuses or positive performance evaluations. In the example above, the gross margin decreased from 42% to 40% over a two-year period. While this decline could be a realistic reflection of operations, it could also be the result of a change in estimates or of accounting policy to avoid income taxes. For this reason, any change in ratios should always be investigated further.
Horizontal Analysis
Horizontal, or trend, analysis examines each line item on a financial statement in order to see how it has changed over time. The line items that are of most interest tend to be the changes in sales, gross profit, and net income. If the company’s operations are relatively stable each year, this analysis can prove to be quite useful.
Below is an example of common size analysis of an income statement:
| Horizontal Analysis Income Statement As at December 31 |
||||||
|---|---|---|---|---|---|---|
| 2020 | 2019 | 2018 | ||||
| Revenue | 105.20% | 101.40% | 100.00% | |||
| Cost of goods sold | 102.80% | 101.30% | 100.00% | |||
| Gross profit | 110.00% | 101.50% | 100.00% | |||
| Operating expenses | ||||||
| Rent | 110.00% | 100.00% | 100.00% | |||
| Salaries and benefits expense | 106.00% | 103.00% | 100.00% | |||
| Depreciation and amortization expense | 100.00% | 100.00% | 100.00% | |||
| Office supplies expense | 96.00% | 98.00% | 100.00% | |||
| Travel | 102.00% | 101.00% | 100.00% | |||
| Utilities expense | 105.00% | 103.00% | 100.00% | |||
| Other operating expenses | 81.00% | 80.00% | 100.00% | |||
| 102.00% | 101.00% | 100.00% | ||||
| Income from operations | ||||||
| Other revenues and expenses | ||||||
| Interest expense | 103.00% | 101.00% | 100.00% | |||
| Income before income taxes | 102.00% | 101.00% | 100.00% | |||
| Income tax expense | 100.00% | 100.00% | 100.00% | |||
| Net income | 102.00% | 98.00% | 100.00% | |||
Note that the percentages do not add up vertically as was the case with vertical analysis. Looking at sales, gross profit, and net income, we notice that all three have all increased, with gross profit increasing the most. This could be due to a change in the pricing policy as evidenced by the 5% increase in revenue over two years. However, more investigation would be necessary to determine if the increase is due to true economic events or if it was influenced by changes in policies made by management.
In summary, remember that when working with ratios analysis, ratios are only as good as the data reported in the financial statements. For instance, if quality of earnings is high, ratio analysis can be useful, otherwise it may do more harm than good. Additionally, it is important to focus on a few key ratios for each category to avoid the risk of information overload. Those key ratios can subsequently be investigated and tracked over time. It is also important to understand that industry benchmarks make no assurances about how one company compares to its competitors, as the basis for the industry ratio may differ from the basis used for the company. While ratios provide good indicators for further investigation, they are not the end-point if an evaluation is to be conducted properly.
