Week 11
Monitoring, Evaluation, Reporting
In the previous lecture we learned about achieving the SDGs through planning and implementation at all levels of government with collaboration from civil societies, business, and partnerships. This week we will be looking at how the indicators and their targets form the basis of monitoring SDG implementation. We will look at how countries are doing this including evaluation indices and progress reporting.
You will recall the sustainable development goals include a list of 169 targets. In 2017, the UN General Assembly also approved the global indicator framework, a list of 232 indicators which are divided across the 17 goals and relate to their corresponding targets. Working together, the indicators and their targets form the foundation for monitoring the success of the SDGs.
The indicators are tools to help governments and institutions create implementation and monitoring strategies. They are appropriate for the local, regional, and national level to help establish priorities for governments and others working towards the SDGs. They function as a report card to evaluate programmes and policy progress and success. They are essential for showing Member State progress on achieving 2030 Agenda commitments, as individual countries are encouraged to adapt the global targets and indicators to national conditions, reflecting the priorities in their National Development Plans.
Let’s look at an example of how targets and indicators measure the success of an SDG
Remember – targets are something to be achieved that is measurable, while indicators show the measurement by which those targets can be judged or assessed.
We will use SDG #1 – End Poverty in all its forms everywhere, as our example.
SDG # 1 is supported by 7 targets and 12 indicators.
Target 1: By 2030, eradicate extreme poverty for all people everywhere, currently measured as people living on less than US$1.90 a day.
Indicator 1: Proportion of population below the international poverty line, by sex, age, employment status and geographical location (urban/rural).
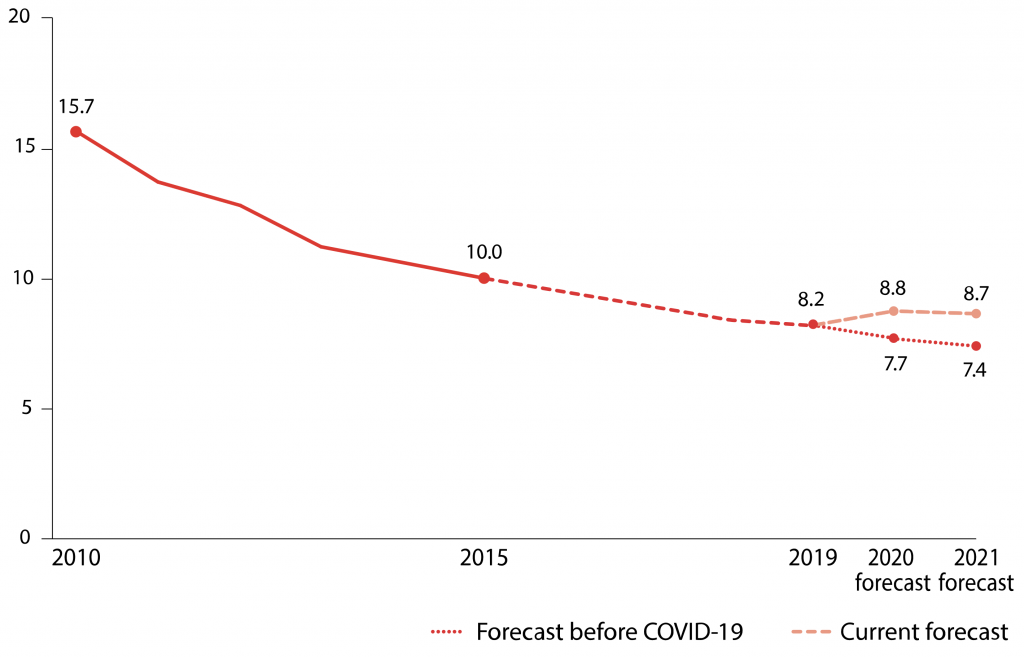
The first target is to eradicate extreme poverty for all people everywhere by 2030. The indicator for this target is to assess the proportion of the population below the international poverty line (less than US$1.90 a day), by sex, age, employment status and geographical location (urban/rural).
Using this example, we can track the percentage of the global population living below the international poverty line. This data can be tracked over time and allows progress towards this goal to be reportable.[1]
In the example above, the target and corresponding indicator are for a global measurement, using the international poverty line. We mentioned SDG #1 has 7 targets. Target #2 measures poverty at the national level, see below.
SDG #1 Target 2:
-
- by 2030, reduce at least by half the proportion of men, women and children of all ages living in poverty in all its dimensions according to national definitions.
SDG #1 Indicator 2:
-
- Proportion of population living below the national poverty line, by sex and age
- Proportion of men, women and children of all ages living in poverty in all its dimensions according to national definitions
SDG target 2 and indicator 2 allows for differences between countries. Although target 1 refers to extreme poverty, currently measured as the international poverty line at US $1.90 a day, target 2 focuses on “national definitions” and encourages all countries to half the proportion of people affected. As you will recall from the week three lecture, Canada’s official poverty line is defined based on the Market Basket Measure (MBM), which is the number of people who do not have enough income to purchase a specific basket of goods and services in their community.
Measuring progress
There are many challenges regarding measuring SDG progress, with data collection proving to be a difficult task. This is especially true for measuring change at the local community level, nationally, and globally. For some indicators, data is relatively easy to acquire because of well-established methodologies and already existing collection practices. For other indicators, there are no clear established methodologies, or the data is not widely collected internationally.
To tackle this issue an expert group created the global indicator framework, where the SDG indicators were divided into three categories:
Tier 1: Indicators with easy to find data and clear and established methodologies
Tier 2: Indicators with clear and established methodologies but the data might be difficult to find as it is not regularly produced by all countries
Tier 3: Internationally established methodologies or standards are not yet available for the indicator, but the methodology/standards are being (or will be) developed or tested
This was an important step for generating internationally-comparable data. National statistical collectors (i.e. Statistics Canada) have the central responsibility of compiling credible data. They then make this data available for regional, national, and global evaluation and reporting.
Despite national and international cooperation, there remain challenges for SDG monitoring and evaluation. There are indicators that lack agreed-upon methodologies or available official data. Some countries national statistical offices lack the capacity to produce relevant data. There are issues related to the use of unofficial sources of data, such as data produced by private companies, which provide opportunities for measuring crucial SDG indicators, but lack a role in the formal reporting system.
To fully understand progress on the SDGs, policy-makers and stakeholders at all levels need access to data that is reliable, relevant, and user-friendly to make meaningful, and measurable progress on the SDGs.
Video
In this 10-minute video made available from the SDG Academy, Dr. Guido Schmidt-Traub (Executive Director of the Sustainable Development Solutions Network) introduces the SDG Index and Dashboards, reviewing its history and development since 2015, and the unique role it plays in measuring progress toward achieving the SDGs.
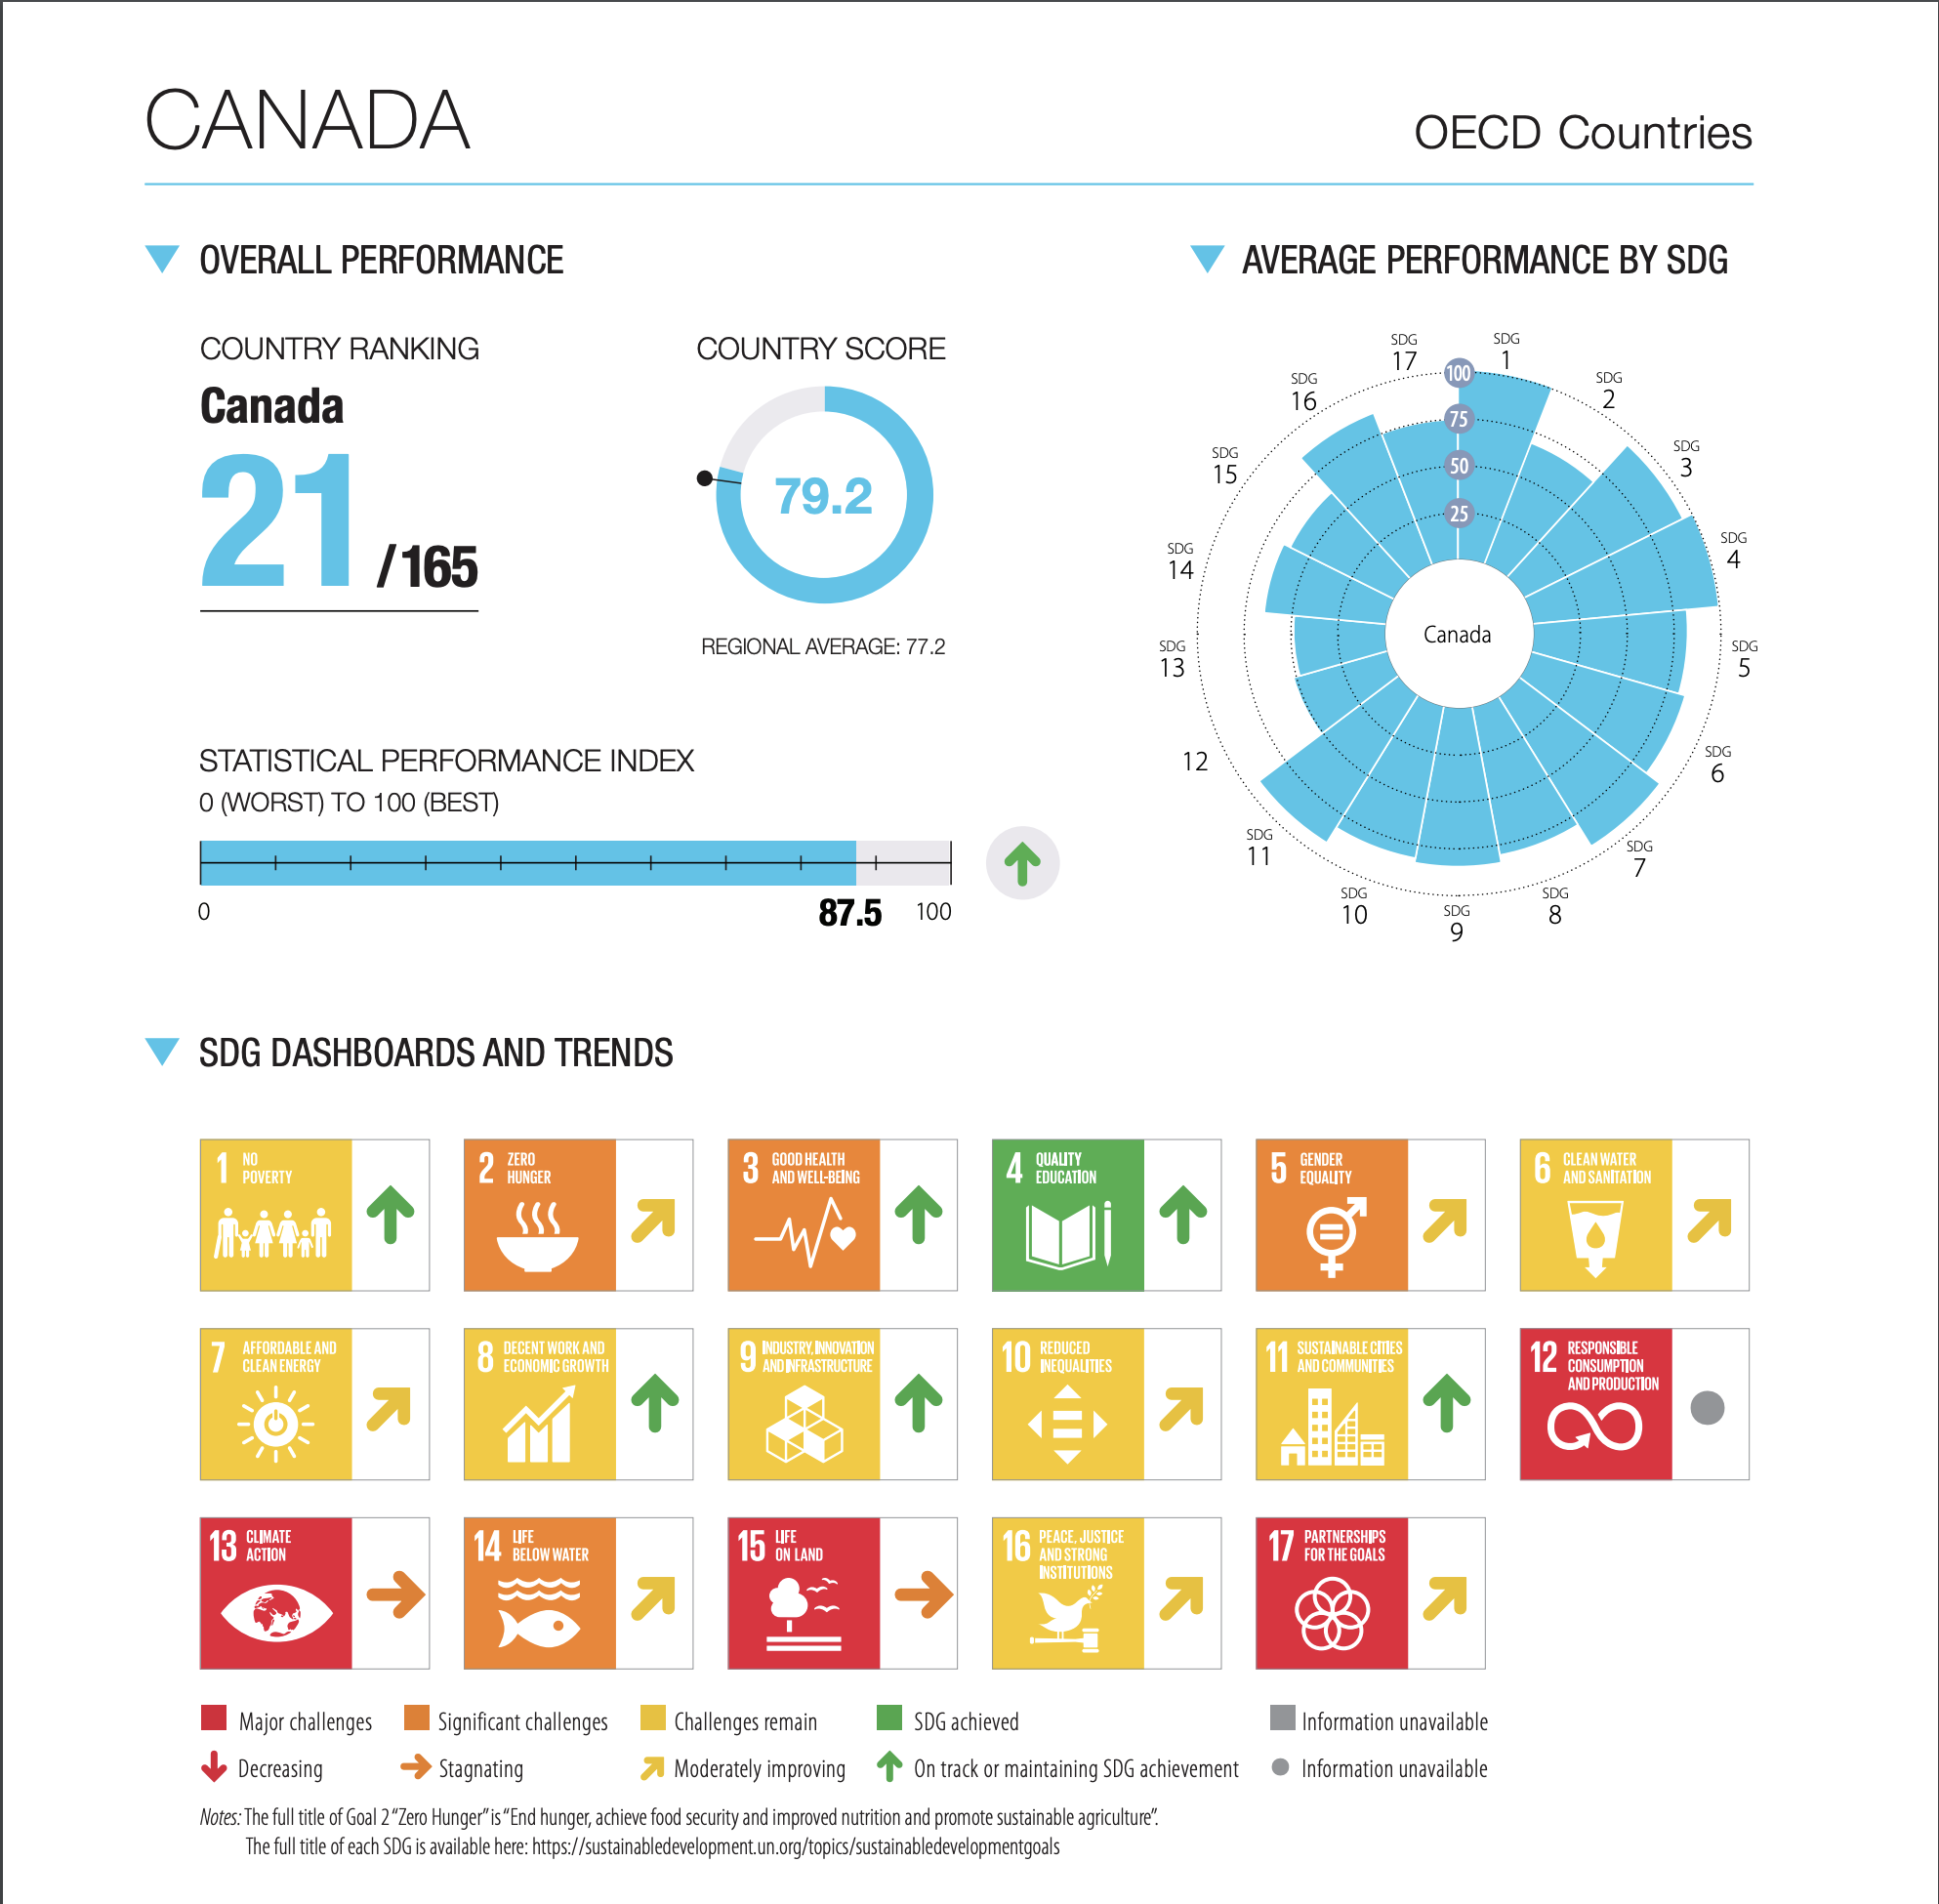
SDG Index and Dashboard for Canada
Exercise
Discussion Question
- Share your reflections from above with another learner. Compare and contrast your discoveries.
Comprehension Questions
Recommended Reading
- The Sustainable Development Report is a global assessment of each countries progress towards achieving the SDGs. It is a complement to the official SDG indicators and the voluntary national reviews.
- United Nations. (2021). The Sustainable Development Goal Report, 2020. ↵
- United Nations. (2021). The 2021 Sustainable Development Goal Report: The Decade of Action for the Sustainable Development Goals. ↵
