16 4.3. Quantifying the Gut Microbiome
Learning Objectives
- Explore the most common methods researchers use to quantify the gut microbiota in microbiome studies
- Understand the difference between next-generation sequencing technologies – namely, 16S rRNA gene sequencing and Shotgun Metagenomic sequencing
- Learn about the different biodiversity measures used to characterize gut microbiome composition
- Learn about the different CSF biomarkers used to explore the relationship between Alzheimer’s disease pathology and gut microbial composition
Next-Generation Sequencing Technologies
16S rRNA Gene Sequencing
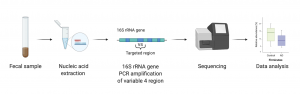
16S ribosomal RNA (rRNA) gene sequencing is a rapid and cost-effective next-generation sequencing technology used for identification, classification, and quantification of the gut microbiome. This method requires the sequencing of the 16S rRNA gene, a widely conserved gene present in all bacterial species. This rRNA gene consists of hypervariable regions interspersed between conserved regions along the sequence. The variable regions represent species-specific sequences and allow for microbial identification. Most commonly, the variable 4 region (V4) of the gene is specifically targeted by sequencing due to its higher accuracy in characterizing different species.
How does it work?
Before gut microbiota sequencing and analysis can begin, a sample is needed. Typically, fecal samples are collected. The samples are immediately chilled and assessed using the Bristol Stool Scale which classifies stools into one of seven categories each representing a different stool state (including constipation, normal, and diarrhea).
Following the fecal sample collection, a buffered solution of the sample is made by mixing in compounds such as phenol, chloroform, and isoamyl alcohol which enable the isolation of DNA and RNA. After extracting the nucleic acid from the solution, the V4 region of the 16S rRNA gene is amplified using Polymerase Chain Reaction (PCR) and is sequenced (Figure 4.3.1). The resulting sequences are then matched to a 16S reference database produced by the Human Microbiome Project (HMP). In this way, a microbial profile can later be generated, and relative abundances of bacterial species found in the collected sample are determined.
Shotgun Metagenomic Sequencing
Another next-generation sequencing technology that also quantifies the gut microbiome involves shotgun metagenomic sequencing which instead targets the entire genome, including the 16S rRNA gene. Unlike 16S rRNA gene sequencing, this technique determines microbial function in addition to microbial composition. However, this method is costly making 16S rRNA gene sequencing the primary method used in microbiome research.
Gut Microbiome Composition
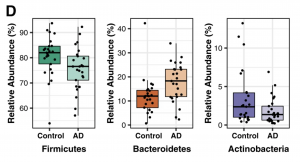
Once gene sequencing is complete, sequences are grouped into operational taxonomic units (OTUs). Based on sequence similarities, OTUs are then classified into taxonomies (phylum, family, genus) allowing for the relative abundance of each to be determined. This is done using Metastats, a statistical method that identifies differences in taxonomic composition (Figure 4.3.2).
Furthermore, three biodiversity measures are used to characterize microbial communities: alpha diversity, beta diversity, and richness. Alpha diversity examines existing variances within a single sample. Beta diversity, instead, compares the difference in microbial communities between two samples. Richness is simply a measure of unique OTUs found in a single sample. Different statistical metrics are used to measure each one of the three. Alpha diversity is typically calculated using Inverse Simpson and Shannon Indexes, as well as Faith’s Phylogenetic Diversity, while beta diversity is measured using Bray-Curtis dissimilarity and UniFrac analysis. Richness is measured using Abundance-based coverage estimator (ACE) and Chao1 metrics.
Functional Profiling
Following 16S rRNA gene sequencing, a computational technique known as Phylogenetic Investigation of Communities by Reconstruction of Unobserved States (PICRUSt) is used by researchers. This method determines any functional differences that may exist among the bacterial communities found in the sample. This step is especially useful when comparing functional profiles of samples from healthy individuals with samples from Alzheimer’s disease patients, for example.
Observational Methods
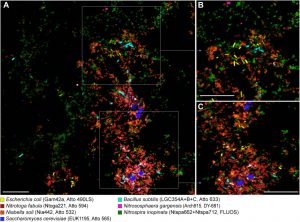
Traditional observational methods such as Fluorescence in situ Hybridization (FISH) can also be employed to explore microbial communities. FISH allows for a detailed examination of the different taxonomies that exist in the fixed sample. It also aids researchers in understanding how the microorganisms are organized within their microbial niche. As the name suggests, visualization is detected with the use of DNA probes that are attached to a fluorescent molecule and are able to recognize specific sequences within the microbes present in the sample (Figure 4.3.3).
Cerebrospinal Fluid Biomarkers
Along with studying the composition of the gut microbiota, Cerebrospinal Fluid (CSF) biomarkers also play an important role in characterizing neurodegenerative diseases like Alzheimer’s disease. In fact, measuring CSF biomarker levels in Alzheimer’s disease patients can be done as a way to study the relationship between microbial abundance and disease pathology. Currently, there are two major CSF biomarkers that have been found to be associated with Alzheimer’s disease: Aβ42/Aβ40 and phosphorylated tau (p-tau). Lower levels of the first biomarker, Aβ42/Aβ40, indicate greater amyloid deposition in the brain. In contrast, higher levels of p-tau reveal greater neurofibrillary tangle pathology in the brain, which, along with the amyloid depositions, represent the major clinical manifestations of the disease. In general, higher levels of the ratio of p-tau/Aβ42 reflect higher Alzheimer’s disease pathology. Another biomarker used as a marker of Alzheimer’s disease is chitinase-3-like protein 1 (YKL-40) which measures astrocytes and microglia cells activation and has also been shown to be elevated in the CSF of individuals with Alzheimer’s disease.
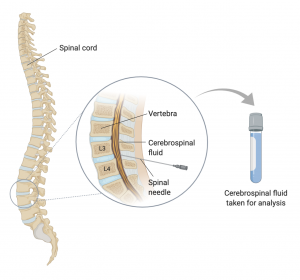
CSF samples are collected from patients via a lumbar puncture (also called a spinal tap). In this relatively invasive procedure, a sample is taken from the area between the third and fourth vertebrae of the spinal cord using a spinal needle that goes through the patient’s skin (Figure 4.3.4).
A laboratory method that rapidly generates (or amplifies) a large number of specific DNA fragments in vitro. This enables researchers to have enough copies of this small DNA segment to work with.
A research initiative created in 2007 with the goal of understanding the role of the microbiota in human health and disease. The project also assembles a growing reference database available to the public using 16S rRNA gene sequencing.
OTUs allow for the categorization of closely related species into different groups based on sequence similarity.
A fluid found surrounding the brain and spinal cord that protects them from injury.