PASSPORT,A GLOBAL MARKET INFORMATION DATABASE BY EUROMONITOR
BY: ALINA MARIA EINETTER, SAJIDA NOOR, LUANYS VILLATE & ANDREA CAMPOS
INTRODUCTION
Euromonitor International has been recognized as the world’s leading independent source of strategic market research that creates data and analysis on thousands of the products and services in the world. Passport, which is delivered by Euromonitor, is a database for insight on industries, economies, and consumers worldwide. Euromonitor is also known as GMID, Global Information database.
Passport is a global research database providing shared access to internationally comparable market research quickly and cost-effectively (Euromonitor International., 2019). It covers 210 markets and 207 countries to help clients analyze market context and to identify future trends.
The world’s top academic institutions use Passport for teaching and research across a wide range of disciplines. It helps the faculty to design teaching materials and projects with real-world relevance, such as strategic planning, economic analysis, industry benchmarking, competitive threats and market entry studies. Passport provides data set in a range of formats such as Excel tables, charts, graphs, visual figures known as dashboards to provide quick access to information about selected areas.
Retail market sizes can be determined by passport which further provides a breakdown of expenditure the population of a country has. Consumer lifestyles such as a full-text country report with specific lifestyle factors such as eating, shopping, family, travel, work, leisure and shopping habits in each country can also be obtained by it. Brands and companies, cities report, and statistical database of economic, demographic and marketing parameters of countries are also provided to the users. Passport has broad applications and utility for the users to understand the thousands of data points analytically by shifting the focus from ‘what is happening’ to ‘why is this happening.’ Experts clarify published data support if need be.
Students from the University of Guelph can access it at the university website:
https://guides.lib.uoguelph.ca/az.php?q=passport
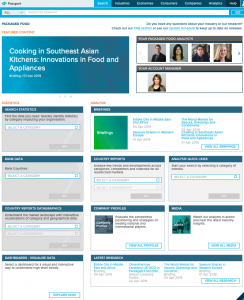
NAVEGATING THE “PASSPORT” WEBSITE
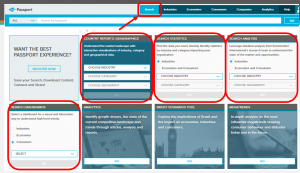
SEARCHING TOOLS
The website of passport offers a lot of searching tools to obtain the desired information. Each button can be used to retrieve different types of information.
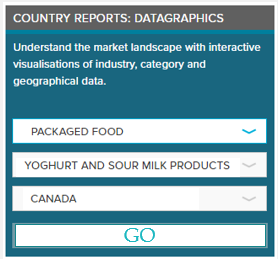
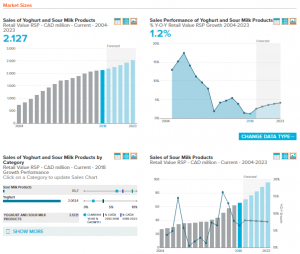
* First, there is the tool called DATAGRAPHICS which can be used to get various graphics showing the information. For the example of Yoghurt in Canada, the following parameters were chosen. One example of the output is found in the figure on the right.
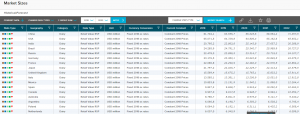
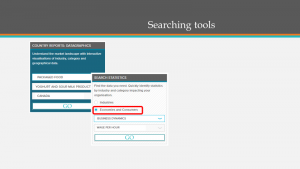
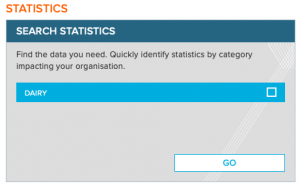
* The second searching box is called SEARCH STATISTICS which can be utilized to find statistics over the past few years and a forecast of the next years with an overview of countries related to industries.

* For example, one can look for the comparison of the market size for dairy products of the whole world. Then the results would look like the following:
* As an example of Search Statistics for Economies and Consumers -a search f Hourly wages under the Business Dynamics category can be obtained for the category of “Packaged Foods/ Yoghurt and Sour Milk Products/Canada – Select and chose from the drop- down then hit “GO”
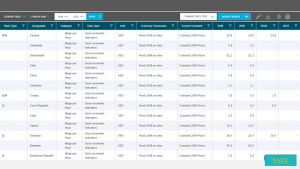
* The results are shown below. Information on hourly wages for the industry and category for Canada will be presented and compared to other country information.
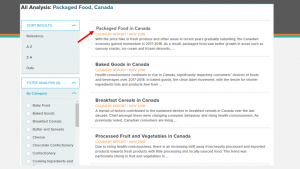
* Selecting Search Statistics for Industries and the drop-down category “Packaged Foods” in Canada and hit “GO” :
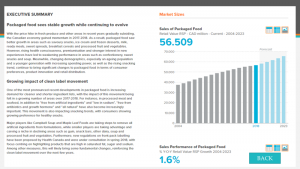
* Presents a list of reports for the Packaged Food industry in Canada. To view details, click on any of the sub-categories.
* Complete display of the Package Foods Country Report. The top right allows a view in different buttons formats
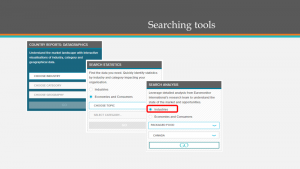
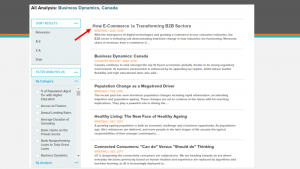
* A Search Analysis for Economies and Consumers for the category of Business Dynamics in Canada can be done by choosing from the drop down and hitting “GO”
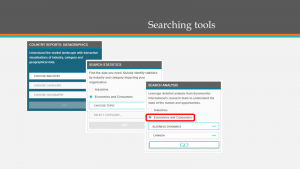
* The resulting is a screen with information on Business Dynamics in Canada and each category can be expanded for further detail by clicking on it
OTHER TABS
If you don’t know exactly what kind of information you are looking for, or you just want to see what they have about a broad topic, you can use the tabs next to “SEARCH”:
![]()
“INDUSTRIES” TAB
Here you will find statistics and analysis reports organized by trade. Select the product category where the article you are interested in falls in
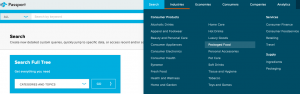
The opening screen will offer the following options, divided in to major areas:
“STATISTICS”:
- “SEARCH STATISTICS”: General search by sub-category within the chosen product category (which will give you additional options that are discussed below)
- “RANK DATA”: Top rank of countries for the selected sub-category within the chosen product category
- “COUNTRY REPORTS DATAGRAPHICS”: Analytical report by country for the selected sub-category within the chosen product category
- “DASHBOARDS – VISUALISE DATA”: A global dashboard for the chosen product category
“ANALYSIS”:
- “BRIEFINGS”: Available reports for areas related to the chosen product category
- “COUNTRY REPORTS”: Same as above, Analytical report by country for the selected sub-category within the chosen product category
- “ANALYSIS QUICK LINKS”: Listing of all types of analysis reports available (including Country reports, Briefings, Company Profiles, etc.), related to the selected sub-category within the chosen product category
- “COMPANY PROFILES”: Profile on a limited number of companies, usually the ones recognized internationally
- ”MEDIA”: List of podcasts and videos produced by Euromonitor and associated to the chosen product category, usually related to market trends or industry movements
- “LATEST RESEARCH”: Lists the most recent publications, no matter what type, related to the selected sub-category within the chosen product category, produced by Euromonitor.
“INDUSTRIES” TAB > “STATISTICS” > “SEARCH STATISTICS”:
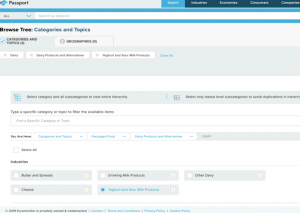
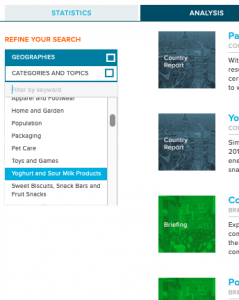
Once you have selected a product sub-category:
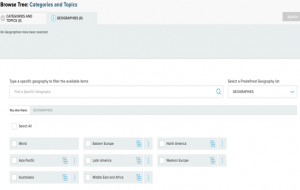
you will find some further options to narrow your search by “Categories and Topics” and “Geographies”:
Then, you will get results for both “STATISTICS” and “ANALYSIS” areas:
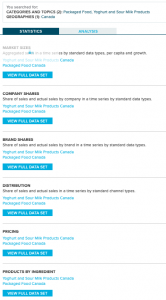
In the “STATISTICS” area you will get some of the options reviewed earlier, like:
- “MARKET SIZES”
- ” COMPANY SHARES”
- “BRAND SHARES”
- “DISTRIBUTION”
- “PRICING”
- “PRODUCT BY INGREDIENT”
when clicking on any of them, the corresponding full data set will be displayed.
In the “ANALYSIS” area, you will be given the option to narrow down your search by:
-
- “GEOGRAPHY”:
-
- “CATEGORY AND TOPICS”:
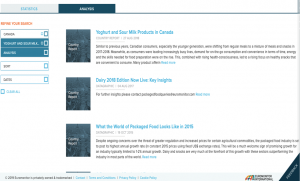
limiting the region and product sub-category for the results.
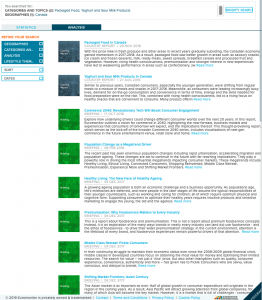
Following the format previously explained, requested report will be then displayed, :
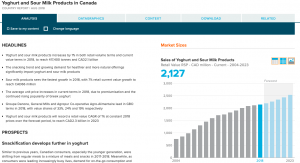
These reports often include information like:
- Industry headlines, prospects & Competitive Landscape analysis
- Market sizes, Sales Retail values, and Year over year sales performance statistics
- Company and brand shares, distribution and Competition analysis
- Economic indicators and trends for the industry
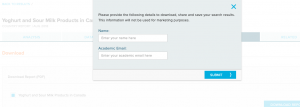
Last but not least, keep in mind you will be able to download the generated report:

“ECONOMIES” TAB
Here you will find general info about:
- Business Dynamics
- Access to finance
- Advertising & Media access
- Communications
- Corruption
- Crime
- Facilitation for business
- Economic freedom
- Education & skills
- Competitiveness
- Government stability and safety risks
- Health Care services
- Socio-economic development
- New businesses
- Infrastructure
- Economy, Finance & Trade
- Payment & confidence indicators
- Exchange & Interest rates
- External debt
- GDP, GNI & FDI indicators
- Productivity, Industrial production, price and inflation indicators
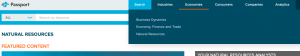
- Natural resources
- Agriculture
- Biodiversity & Climate
- Metals & Minerals mining
- Natural disasters
- Energy and water resources
- Pollution and waste
As previously seen in other tabs, here you will be able to filter results by country and by the subcategory options, pre-set by Euromonitor.
“CONSUMER” TAB

Includes the following options (among others not included in this report):
- Digital Consumer: Digital landscape & Commerce, e.g., Internet access, cellphone use, Electronics possession rates
- Households: Average size, price, composition, types, members info, buildings
- Income & Expenditure: By type, gender and age, consumer indicators savings, poverty, saving practices, tax contribution, social-economic segmentation
- Lifestyles: Dietary preferences, exercise, ethics, leisure
- Population: Marital status, fertility, migrations, density
“COMPANIES” TAB
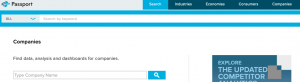
This option provides a complete report on a limited selection of companies. Most likely only the ones recognized as global players. Some of the aspects included are:
- Strategic Direction
- Key facts
- Competitive positioning
- Related Statistic & analysis reports
- Related Industry reports & company profiles