Exercises: Slope of a Line (3.10)
Exercises: Use [latex]{\color{White}{m=\frac{\text{rise}}{\text{run}}}}[/latex] to find the Slope of a Line from its Graph
1.
Solution
[latex]\frac{2}{5}[/latex]
2.
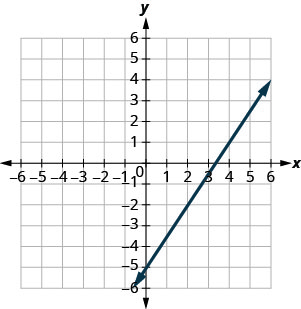
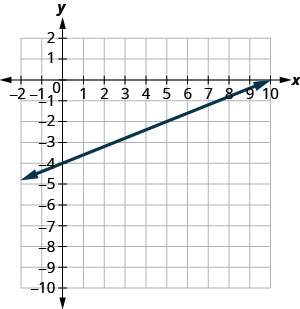
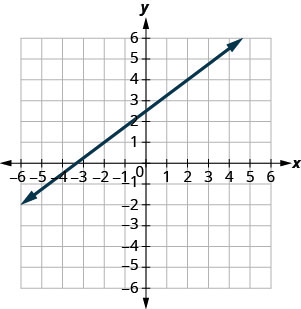
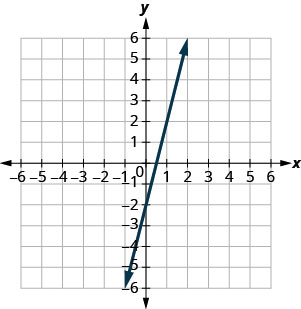
3.
Solution
[latex]\frac{5}{4}[/latex]
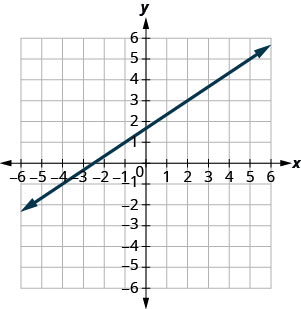
4.
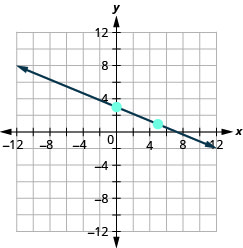
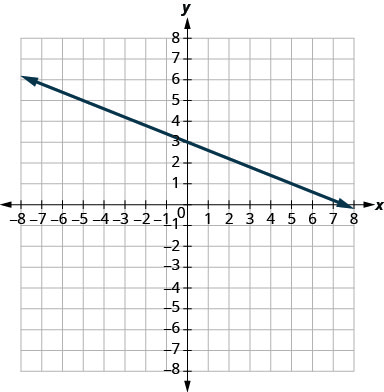
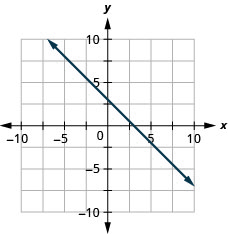
5.
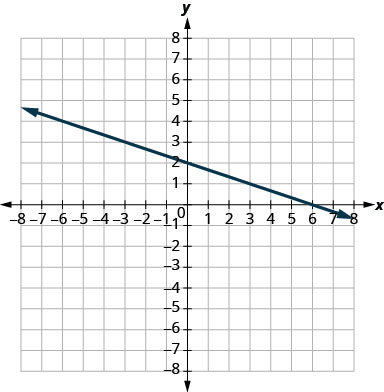
Solution
[latex]-\frac{1}{3}[/latex]
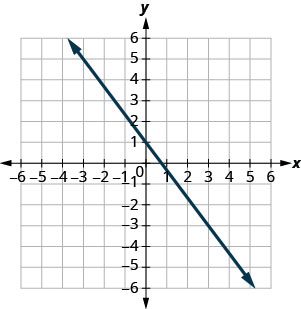
6.
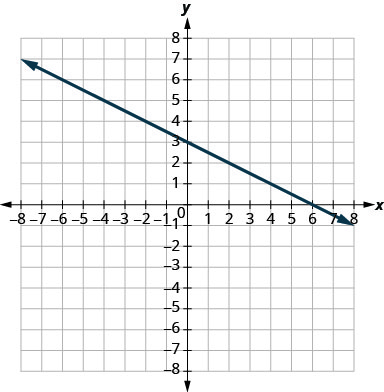
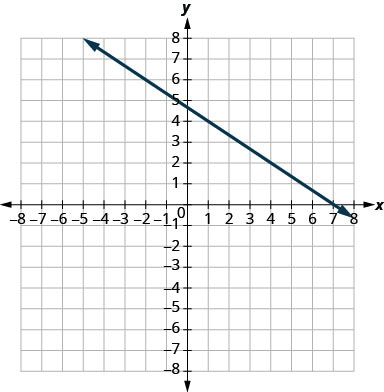
7.
Solution
[latex]-\frac{3}{4}[/latex]
8.
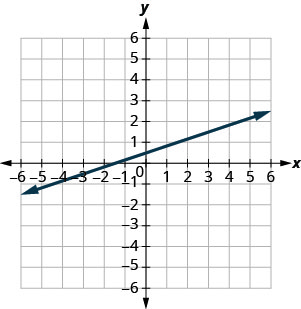
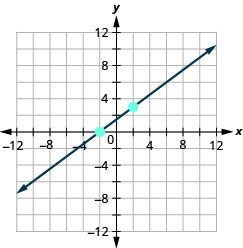
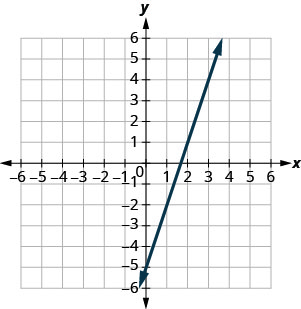
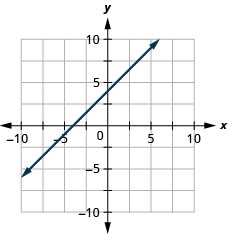
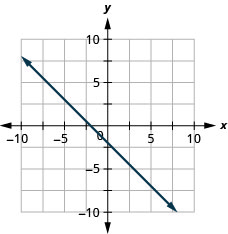
9.
Solution
[latex]\frac{3}{4}[/latex]
10.
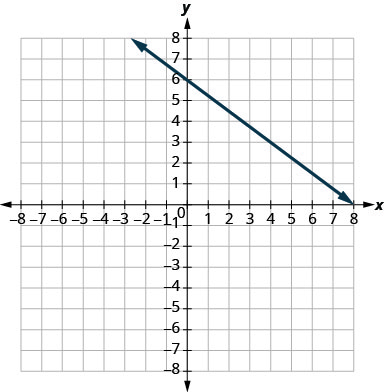
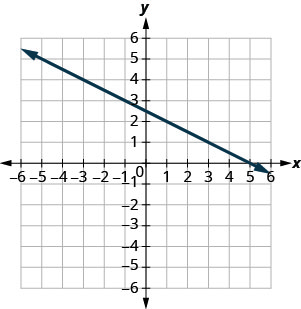
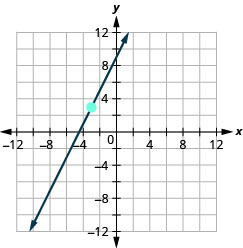
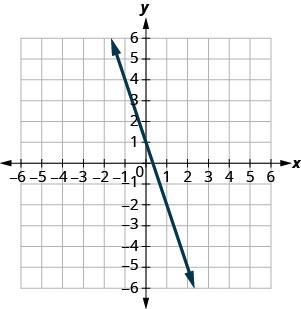
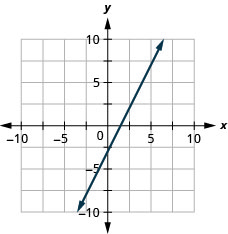
11.
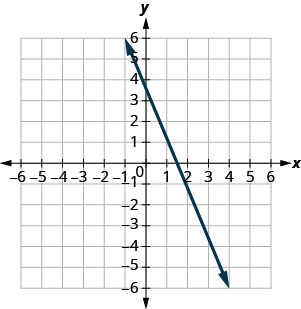
Solution
[latex]-\frac{5}{2}[/latex]
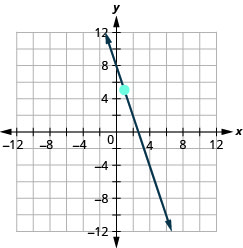
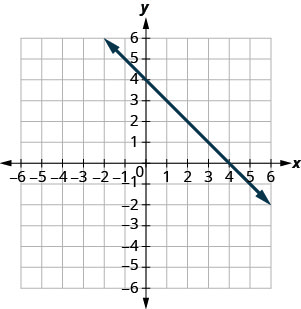
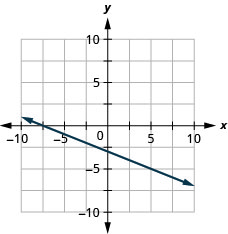
12.
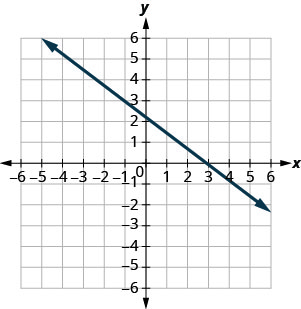
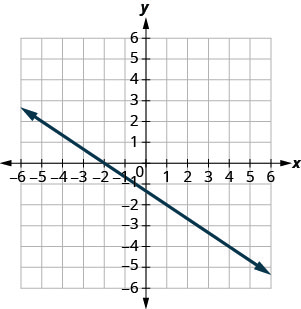
13.
Solution
[latex]-\frac{2}{3}[/latex]
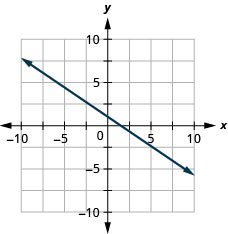
14.
15.
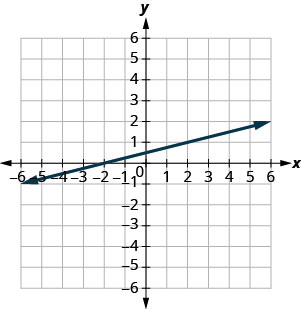
Solution
[latex]\frac{1}{4}[/latex]
16.
Exercises: Find the Slope of Horizontal and Vertical Lines
Instructions: For questions 17-24, find the slope of each line.
Solution
[latex]0[/latex]
Solution
undefined
Solution
[latex]0[/latex]
Solution
undefined
Exercises: Use the Slope Formula to find the Slope of a Line between Two Points
Instructions: For questions 25-36, use the slope formula to find the slope of the line between each pair of points.
Solution
[latex]\frac{5}{2}[/latex]
Solution
[latex]\frac{3}{4}[/latex]
Solution
[latex]-\frac{5}{2}[/latex]
Solution
[latex]-\frac{8}{7}[/latex]
Solution
[latex]\frac{7}{3}[/latex]
Solution
[latex]-1[/latex]
Exercises: Graph a Line Given a Point and the Slope
Instructions: For questions 37-52, graph each line with the given point and slope.
Solution
Solution
Solution
Solution
Solution
Solution
Solution
50. [latex]\left(-4,2\right)[/latex]; [latex]m=4[/latex]
Solution
52. [latex]\left(2,3\right)[/latex]; [latex]m=-1[/latex]
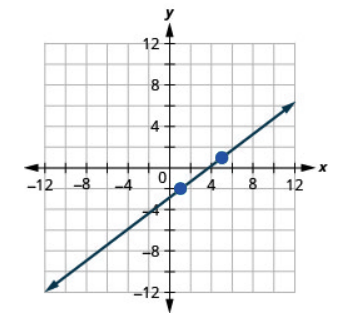
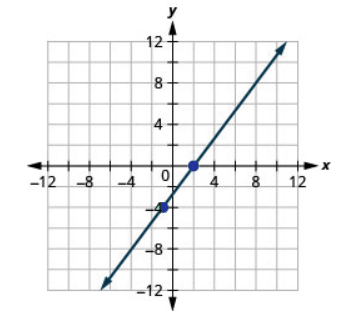
Exercises: Recognize the Relation Between the Graph and the Slope–Intercept Form of an Equation of a Line
Instructions: For questions 53-58, use the graph to find the slope and y-intercept of each line. Compare the values to the equation [latex]y=mx+b[/latex].
Solution
slope [latex]m=4[/latex] and [latex]y[/latex]-intercept [latex]\left(0,-2\right)[/latex]
54. [latex]y=3x-5[/latex]
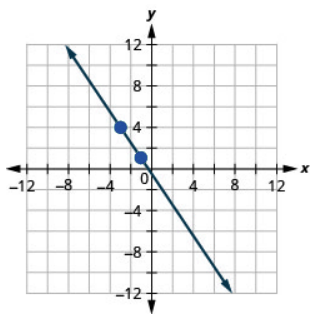
55. [latex]y=-3x+1[/latex]
Solution
slope [latex]m=-3[/latex] and [latex]y[/latex]-intercept [latex]\left(0,1\right)[/latex]
56. [latex]y=-x+4[/latex]
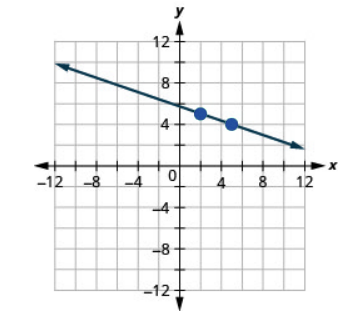
57. [latex]y=-\frac{2}{5}x+3[/latex]
Solution
slope [latex]m=-\frac{2}{5}[/latex] and [latex]y[/latex]-intercept [latex]\left(0,3\right)[/latex]
58. [latex]y=-\frac{4}{3}x+1[/latex]
Exercises: Identify the Slope and [latex]{\color{White}{y}}[/latex]-Intercept From an Equation of a Line
Instructions: For questions 59-68, identify the slope and [latex]y[/latex]-intercept of each line.
Solution
[latex]-9;(0,7)[/latex]
Solution
[latex]4;(0,-10)[/latex]
Solution
[latex]-4;(0,8)[/latex]
Solution
[latex]-\frac{8}{3};(0,4)[/latex]
Solution
[latex]\frac{7}{3};(0,-3)[/latex]
Exercises: Graph a Line Using Its Slope and Intercept
Instructions: For questions 69-84, graph the line of each equation using its slope and y-intercept.
Solution
Solution
Solution
Solution
Solution
78. [latex]y=-\frac{3}{4}x-1[/latex]
Solution
Solution
Solution
Exercises: Choose the Most Convenient Method to Graph a Line
Instructions: For questions 85-100, determine the most convenient method to graph each line.
Solution
horizontal line
Solution
vertical line
Solution
slope–intercept
Solution
intercepts
Solution
slope–intercept
Solution
horizontal line
Solution
intercepts
Solution
slope–intercept
Exercises: Graph and Interpret Applications of Slope–Intercept
101. The equation [latex]P=28+2.54w[/latex] models the relation between the amount of Randy’s monthly water bill payment, [latex]P[/latex], in dollars, and the number of units of water, [latex]w[/latex], used.
a. Find the payment for a month when Randy used [latex]0[/latex] units of water.
b. Find the payment for a month when Randy used [latex]15[/latex] units of water.
c. Interpret the slope and [latex]P[/latex]-intercept of the equation.
d. Graph the equation.
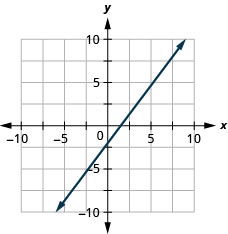
Solution
a. [latex]$28[/latex]
b. [latex]$66.10[/latex]
c. The slope, [latex]2.54[/latex], means that Randy’s payment, [latex]P[/latex], increases by [latex]$2.54[/latex] when the number of units of water he used, [latex]w[/latex], increases by [latex]1[/latex]. The [latex]P[/latex]–intercept means that if the number units of water Randy used was [latex]0[/latex], the payment would be [latex]$28[/latex].
d.
102. The equation [latex]P=31+1.75w[/latex] models the relation between the amount of Tuyet’s monthly water bill payment, [latex]P[/latex], in dollars, and the number of units of water, [latex]w[/latex], used.
a. Find Tuyet’s payment for a month when [latex]0[/latex] units of water are used.
b. Find Tuyet’s payment for a month when [latex]12[/latex] units of water are used.
c. Interpret the slope and [latex]P[/latex]-intercept of the equation.
d. Graph the equation.
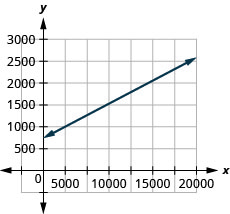
103. Janelle is planning to rent a car while on vacation. The equation [latex]C=0.32m+15[/latex] models the relation between the cost in dollars, [latex]C[/latex], per day and the number of miles, [latex]m[/latex], she drives in one day.
a. Find the cost if Janelle drives the car [latex]0[/latex] miles one day.
b. Find the cost on a day when Janelle drives the car [latex]400[/latex] miles.
c. Interpret the slope and [latex]C[/latex]–intercept of the equation.
d. Graph the equation.
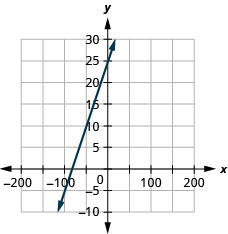
Solution
a. [latex]$15[/latex]
b. [latex]$143[/latex]
c. The slope, [latex]0.32[/latex], means that the cost, [latex]C[/latex], increases by [latex]$0.32[/latex] when the number of miles driven, [latex]m[/latex], increases by [latex]1[/latex]. The [latex]C[/latex]-intercept means that if Janelle drives [latex]0[/latex]miles one day, the cost would be [latex]$15[/latex].
d.
104. Bruce drives his car for his job. The equation [latex]R=0.575m+42[/latex] models the relation between the amount in dollars, [latex]R[/latex], that he is reimbursed and the number of miles, [latex]m[/latex], he drives in one day.
a. Find the amount Bruce is reimbursed on a day when he drives [latex]0[/latex] miles.
b. Find the amount Bruce is reimbursed on a day when he drives [latex]220[/latex] miles.
c. Interpret the slope and [latex]R[/latex]-intercept of the equation.
d. Graph the equation.
105. Patel’s weekly salary includes a base pay plus commission on his sales. The equation [latex]S=750+0.09c[/latex] models the relation between his weekly salary, [latex]S[/latex], in dollars and the amount of his sales, [latex]c[/latex], in dollars.
a. Find Patel’s salary for a week when his sales were [latex]$0[/latex].
b. Find Patel’s salary for a week when his sales were [latex]$18\text{,}540[/latex].
c. Interpret the slope and [latex]S[/latex]-intercept of the equation.
d. Graph the equation.
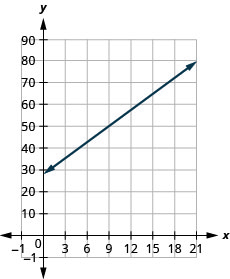
Solution
a. [latex]$750[/latex]
b. [latex]$2418.60[/latex]
c. The slope, [latex]0.09[/latex], means that Patel’s salary, [latex]S[/latex], increases by [latex]$0.09[/latex] for every [;atex]$1[/latex] increase in his sales. The [latex]S[/latex]-intercept means that when his sales are [latex]$0[/latex], his salary is [latex]$750[/latex].
d.
106. Cherie works in retail and her weekly salary includes commission for the amount she sells. The equation [latex]S=400+0.15c[/latex] models the relation between her weekly salary, [latex]S[/latex], in dollars and the amount of her sales, [latex]c[/latex], in dollars.
a. Find Cherie’s salary for a week when her sales were [latex]$0[/latex].
b. Find Cherie’s salary for a week when her sales were [latex]$3600[/latex].
c. Interpret the slope and [latex]S[/latex]–intercept of the equation.
d. Graph the equation.
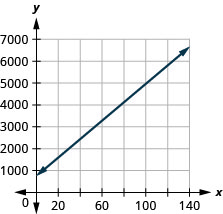
107. Margie is planning a dinner banquet. The equation [latex]C=750+42g[/latex] models the relation between the cost in dollars, [latex]C[/latex] of the banquet and the number of guests, [latex]g[/latex].
a. Find the cost if the number of guests is [latex]50[/latex].
b. Find the cost if the number of guests is [latex]100[/latex].
c. Interpret the slope and [latex]C[/latex]–intercept of the equation.
d. Graph the equation.
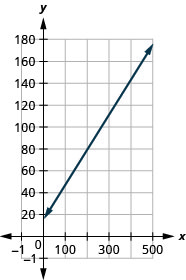
Solution
a. [latex]$2850[/latex]
b. [latex]$4950[/latex]
c. The slope, [latex]42[/latex], means that the cost, [latex]C[/latex], increases by [latex]$42[/latex] for when the number of guests increases by [latex]1[/latex]. The [latex]C[/latex]-intercept means that when the number of guests is [latex]0[/latex], the cost would be [latex]$750[/latex].
d.
108. Costa is planning a lunch banquet. The equation [latex]C=450+28g[/latex] models the relation between the cost in dollars, [latex]C[/latex], of the banquet and the number of guests,[latex]g[/latex].
a. Find the cost if the number of guests is [latex]40[/latex].
b. Find the cost if the number of guests is [latex]80[/latex].
c. Interpret the slope and [latex]C[/latex]-intercept of the equation.
d. Graph the equation.
Exercises: Use Slopes to Identify Parallel Lines
Instructions: For questions 109-134, use slopes and [latex]y[/latex]-intercepts to determine if the lines are parallel.
Solution
parallel
Solution
parallel
Solution
not parallel
Solution
parallel
Solution
parallel
Solution
parallel
Solution
parallel
Solution
parallel
Solution
not parallel
Solution
not parallel
Solution
not parallel
Solution
not parallel
Solution
not parallel
Exercises: Use Slopes to Identify Perpendicular Lines
Instructions: For questions 135-146, use slopes and [latex]y[/latex]-intercepts to determine if the lines are perpendicular.
Solution
perpendicular
Solution
perpendicular
Solution
not perpendicular
Solution
not perpendicular
Solution
perpendicular
Solution
perpendicular
Exercises: Everyday Math
147. Slope of a roof. An easy way to determine the slope of a roof is to set one end of a [latex]12[/latex] inch level on the roof surface and hold it level. Then take a tape measure or ruler and measure from the other end of the level down to the roof surface. This will give you the slope of the roof. Builders, sometimes, refer to this as pitch and state it as an “[latex]x\;12[/latex] pitch” meaning [latex]\frac{x}{12}[/latex], where [latex]x[/latex] is the measurement from the roof to the level—the rise. It is also sometimes stated as an “[latex]x[/latex]-in-[latex]12[/latex] pitch”.
a. What is the slope of the roof in this picture?
b. What is the pitch in construction terms?
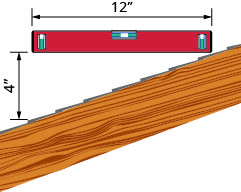
Solution
a.[latex]\frac{1}{3}[/latex]
b. [latex]\text{4 12 pitch}[/latex] or [latex]\text{4-in-12 pitch}[/latex]
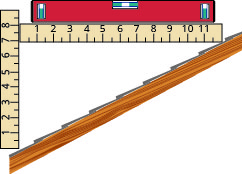
Solution
[latex]\frac{3}{50}[/latex]; [latex]\text{rise}=3[/latex], [latex]\text{run}=50[/latex]
150. Highway grade. A local road rises [latex]2[/latex] feet for every [latex]50[/latex] feet of highway.
a. What is the slope of the highway?
b. The grade of a highway is its slope expressed as a percent. What is the grade of this highway?
151. Wheelchair ramp. The rules for wheelchair ramps require a maximum [latex]1[/latex]-inch rise for a [latex]12[/latex]-inch run.
a. How long must the ramp be to accommodate a [latex]24[/latex]-inch rise to the door?
b. Create a model of this ramp.
Solution
a. [latex]288[/latex] inches ([latex]24[/latex] feet)
b. Models will vary.
152. Wheelchair ramp. A 1-inch rise for a 16-inch run makes it easier for the wheelchair rider to ascend a ramp.
a. How long must a ramp be to easily accommodate a 24-inch rise to the door?
b. Create a model of this ramp.
153. The equation [latex]n=4T-160[/latex] is used to estimate the number of cricket chirps, [latex]n[/latex], in one minute based on the temperature in degrees Fahrenheit, [latex]T[/latex].
a. Explain what the slope of the equation means.
b. Explain what the [latex]n[/latex]–intercept of the equation means. Is this a realistic situation?
Solution
a. For every increase of one degree Fahrenheit, the number of chirps increases by four.
b. There would be [latex]-160[/latex] chirps when the Fahrenheit temperature is [latex]0^\circ[/latex]. (Notice that this does not make sense; this model cannot be used for all possible temperatures.)
154. The equation [latex]C=\frac{5}{9}F-17.8[/latex] can be used to convert temperatures [latex]F[/latex], on the Fahrenheit scale to temperatures, [latex]C[/latex], on the Celsius scale.
a. Explain what the slope of the equation means.
b. Explain what the [latex]C[/latex]–intercept of the equation means.
Exercises: Writing Exercises
Solution
When the slope is a positive number the line goes up from left to right. When the slope is a negative number the line goes down from left to right.
Solution
A vertical line has [latex]0[/latex] run and since division by [latex]0[/latex] is undefined the slope is undefined.
Solution
Answers will vary.
