Exercises: Linear Functions and Applications of Linear Functions (3.12)
Exercises: Verbal Problems
Solution
Terry starts at an elevation of [latex]3000[/latex] feet and descends [latex]70[/latex] feet per second.
Solution
[latex]d(t)=100-10t[/latex]
Solution
Determine the independent variable. This is the variable upon which the output depends.
Solution
To determine the initial value, find the output when the input is equal to zero.
Exercises: Algebraic Problems
Instructions: For questions 8-9, consider this scenario: A town’s population has been decreasing at a constant rate. In 2010 the population was [latex]5\text{,}900[/latex]. By 2012 the population had dropped [latex]4\text{,}700[/latex]. Assume this trend continues.
8. Predict the population in 2016.
Solution
[latex]2\text{,}300[/latex]
Exercises: Algebraic Problems
Instructions: For questions 10-11, consider this scenario: A town’s population has been increasing at a constant rate. In 2010 the population was [latex]46\text{,}020[/latex]. By 2012 the population had increased to [latex]52\text{,}070[/latex]. Assume this trend continues.
Solution
[latex]64\text{,}170[/latex]
Exercises: Algebraic Problems
Instructions: For questions 12-17, consider this scenario: A town has an initial population of [latex]75\text{,}000[/latex]. It grows at a constant rate of [latex]2\text{,}500[/latex] per year for [latex]5[/latex] years.
12. Find the linear function that models the town’s population [latex]P[/latex]as a function of the year, [latex]t[/latex], where[latex]t[/latex]is the number of years since the model began.
Solution
[latex]P(t)=75,000+2500t[/latex]
Solution
[latex](–30,0)[/latex] Thirty years before the start of this model, the town had no citizens.
[latex](0,75\text{,}000)[/latex] Initially, the town had a population of [latex]75\text{,}000[/latex].
Solution
Ten years after the model began
Exercises: Algebraic Problems
Instructions: For questions 18-23, consider this scenario: The weight of a newborn is [latex]7.5[/latex] pounds. The baby gained one-half pound a month for its first year.
Solution
[latex]W(t)=0.5t+7.5[/latex]
Solution
[latex](-15,0)[/latex]: The [latex]x[/latex]-intercept is not a plausible set of data for this model because it means the baby weighed [latex]0[/latex] pounds 15 months prior to birth. [latex](0,7.5)[/latex]: The baby weighed [latex]7.5[/latex] pounds at birth.
Solution
At age [latex]5.8[/latex] months
Exercises: Algebraic Problems
Instructions: For questions 24-29, consider this scenario: The number of people afflicted with the common cold in the winter months steadily decreased by [latex]205[/latex] each year from 2005 until 2010. In 2005, [latex]12\text{,}025[/latex] people were inflicted.
24. Find the linear function that models the number of people inflicted with the common cold [latex]C[/latex] as a function of the year, [latex]t[/latex].
Solution
[latex]C(t)=12\text{,}025-205t[/latex]
Solution
[latex](58.7,0)[/latex]: In roughly [latex]59[/latex] years, the number of people inflicted with the common cold would be [latex]0[/latex].
[latex](0,12\text{,}025)[/latex]: Initially there were [latex]12\text{,}025[/latex] people afflicted by the common cold.
Solution
2063
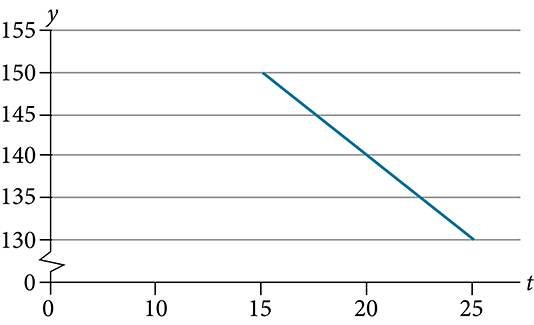
Exercises: Graphical Problems
Instructions: For questions 30-33, use the graph in Figure 3P.12.1, which shows the profit, [latex]y[/latex], in thousands of dollars, of a company in a given year, [latex]t[/latex], where [latex]t[/latex] represents the number of years since 1980.
Solution
[latex]y=-2t+180[/latex]
Solution
In 2070, the company’s profit will be zero.
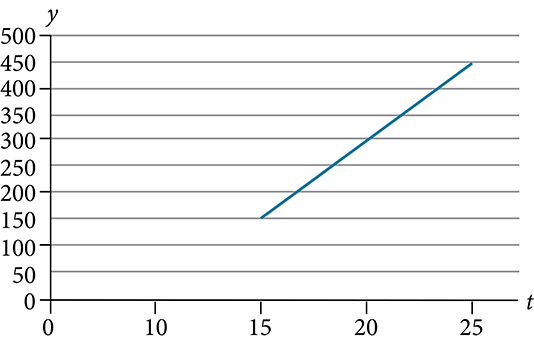
Exercises: Graphical Problems
Instructions: For questions 34-37, use the graph in Figure 3P.12.2, which shows the profit, [latex]y[/latex],in thousands of dollars, of a company in a given year, [latex]t[/latex],where[latex]t[/latex]represents the number of years since 1980.
Solution
[latex]y=30t-300[/latex]
Solution
[latex](0,-300)[/latex] In 1980, the company lost [latex]$300\text{,}000[/latex].
Solution
[latex]y=30t-300[/latex] of form [latex]y=mx+b,m=30[/latex]. For each year after 1980, the company’s profits increased [latex]$30\text{,}000[/latex] per year
Exercises: Numeric Problems
Instructions: For questions 38-40, use the median home values in Mississippi and Hawaii (adjusted for inflation) shown in Table 3P.12.1. Assume that the house values are changing linearly.
| Year | Mississippi | Hawaii |
|---|---|---|
| 1950 | [latex]$25\text{,}200[/latex] | [latex]$74\text{,}400[/latex] |
| 2000 | [latex]$71\text{,}400[/latex] | [latex]$272\text{,}700[/latex] |
Solution
[latex]$80\text{,}640[/latex]
Exercises: Numeric
Instructions: For questions 41-43, use the median home values in Indiana and Alabama (adjusted for inflation) shown in (Figure). Assume that the house values are changing linearly.
| Year | Indiana | Alabama |
|---|---|---|
| 1950 | $37,700 | $27,100 |
| 2000 | $94,300 | $85,100 |
Solution
Alabama
Solution
2328
Exercises: Real-World Applications
Solution
[latex]20+0.5n[/latex]
Solution
[latex]p(n)=-0.004n+34[/latex]
Solution
[latex]y=-0.5n+45[/latex]
Solution
[latex]P(t)=1700t+45,000[/latex]
a. As of 1990, average annual income was [latex]$23\text{,}286[/latex].
b. In the ten-year period from 1990–1999, average annual income increased by a total of [latex]$1\text{,}054[/latex].
c. Each year in the decade of the 1990s, average annual income increased by [latex]$1\text{,}054[/latex].
d. Average annual income rose to a level of [latex]$23\text{,}286[/latex] by the end of 1999.
a. Find the rate of change of Fahrenheit temperature for each unit change temperature of Celsius.
b. Find and interpret [latex]F(28)[/latex].
c. Find and interpret [latex]F(–40)[/latex].
Solution
a. [latex]\text{Rate of change =}\frac{\Delta F}{\Delta C}=\frac{212-32}{100-0}=1.8\text{ degrees F for one degree change in C}[/latex]
b. [latex]F(28)=1.8(28)+32=82.4\text{ degrees F is 28 degrees C}[/latex]
c. [latex]F(-40)=1.8(-40)+32=-40\text{ degrees F is -40 degrees C}[/latex]
a. How much did the population grow between the year 2004 and 2008?
b. How long did it take the population to grow from [latex]1001[/latex] students to [latex]1697[/latex] students?
c. What is the average population growth per year?
d. What was the population in the year 2000?
e. Find an equation for the population, [latex]P[/latex], of the school [latex]t[/latex] years after 2000.
f. Using your equation, predict the population of the school in 2011.
a. How much did the population grow between the year 2003 and 2007?
b. How long did it take the population to grow from [latex]1431[/latex] people to [latex]2134[/latex] people?
c. What is the average population growth per year?
d. What was the population in the year 2000?
e. Find an equation for the population, [latex]P[/latex], of the town [latex]t[/latex] years after 2000.
f. Using your equation, predict the population of the town in 2014.
Solution
a. [latex]2134-1431=703[/latex] people
b. [latex]2007-2003=4[/latex] years
c. Average rate of growth [latex]=\frac{703}{4}=175.75[/latex] people per year. So, using [latex]y=mx+b[/latex], we have [latex]y=175.75x+1431[/latex].
d. The year 2000 corresponds to [latex]t=-3[/latex].
So, [latex]y=175.75(-3)+1431=903.75[/latex] or roughly [latex]904[/latex] people in year 2000
e. If the year 2000 corresponds to [latex]t=0[/latex], then we have ordered pair [latex](0,903.75)[/latex].
[latex]y=175.75x+903.75[/latex] corresponds to [latex]P(t)=175.75t+903.75[/latex].
f. The year 2014 corresponds to [latex]t=14[/latex]. Therefore, [latex]P(14)=175.75(14)+903.75=3364.25[/latex].
So, a population of 3364.
a. Find a linear equation for the monthly cost of the cell plan as a function of [latex]x[/latex], the number of monthly minutes used.
b. Interpret the slope and [latex]y[/latex]-intercept of the equation.
c. Use your equation to find the total monthly cost if [latex]687[/latex] minutes are used.
a. Find a linear equation for the monthly cost of the data plan as a function of [latex]x[/latex], the number of MB used.
b. Interpret the slope and [latex]y[/latex]-intercept of the equation.
c. Use your equation to find the total monthly cost if [latex]250[/latex] MB are used.
Solution
a.
[latex]\begin{array}{l}\text{Ordered pairs are }(20,11.20)\text{ and }(130,17.80)\\\begin{array}{rcl}m&=&\frac{17.80-11.20}{130-20}=0.06\text{ and }b\text{ is at the point }(0,10)\\y&=&mx+b\\y&=& 0.06x+10\\\text{or }C(x)&=&0.06x+10 \end{array}\end{array}[/latex]
b.
[latex]0.06[/latex] – For every MB, the client is charged [latex]6[/latex] cents.
[latex](0,10)[/latex] – If no usage occurs, the client is charged [latex]$10[/latex].
c.
[latex]\begin{array}{rcl}C(250)&=& 0.06(250)+10\\&=&$25\end{array}[/latex]
a. Find a formula for the moose population, [latex]P[/latex] since 1990.
b. What does your model predict the moose population to be in 2003?
a. Find a formula for the owl population, [latex]P[/latex]. Let the input be years since 2003.
b. What does your model predict the owl population to be in 2012?
Solution
a.
[latex]\begin{array}{l}\text{Ordered pairs are }(0,340)\text{ and }(4,285)\\\begin{array}{rcl}m&=&\frac{285-340}{4-0}=-13.75\text{ and }b\text{ is at the point }(0,340)\\y&=&mx+b\\y&=&-13.75x+340 \\ \text{or }P(t)&=&-13.75t+340\hfill \end{array}\end{array}[/latex]
b.
[latex]\begin{array}{l}\text{The year 2012 corresponds to }t=9\\\begin{array}{rcl}P(9)&=&-13.75(9)+340\\&=&216.25\text{ or }216\text{ owls}\end{array}\end{array}[/latex]
a. Give a linear equation for the remaining federal helium reserves, [latex]R[/latex], in terms of [latex]t[/latex], the number of years since 2010.
b. In 2015, what will the helium reserves be?
c. If the rate of depletion doesn’t change, in what year will the Federal Helium Reserve be depleted?
a. Give a linear equation for the remaining oil reserves, [latex]R[/latex], in terms of [latex]t[/latex], the number of years since now.
b. Seven years from now, what will the oil reserves be?
c. If the rate at which the reserves are decreasing is constant, when will the world’s oil reserves be depleted?
Solution
a.
[latex]\begin{array}{l}\text{The year 2014 corresponds to }t=0.\\ \text{We have }m=-25\text{ and }b\text{ at the point }(0,1820)\\ \begin{array}{rcl}y&=&mx+b\\y&=&-25x+1820\\\text{or }R(t)&=&-25t+1820\end{array}\end{array}[/latex]
b.
[latex]\begin{array}{rcl}R(7)&=&-25(7)+1820\\ &=& 645\text{ billion cubic feet}\end{array}[/latex]
c.
[latex]\begin{array}{rcl}0&=&-25t+1820\\-1820&=&-25t\\72.8&=&t\;⇒\;2014+72.8=2086.8\text{. So, in the year 2086}\end{array}[/latex]
Solution
[latex]\begin{array}{l}\text{Plan 1: }y=5x\text{ where }x\text{ is number of windows}\\ \text{Plan 2: }y=3x+40\text{ where }x\text{ is number of windows}\\ \begin{array}{rcl}3x+40&\le&5x\\40&\le&2x\\20&\le&x\end{array}\\ \text{So, more than 20 windows}\end{array}[/latex]
Option A: Base salary of [latex]$17\text{,}000[/latex] a year with a commission of [latex]12\%[/latex] of your sales
Option B: Base salary of [latex]$20\text{,}000[/latex] a year with a commission of [latex]5\%[/latex] of your sales
How much jewelry would you need to sell for option A to produce a larger income?
Option A: Base salary of [latex]$14\text{,}000[/latex] a year with a commission of [latex]10\%[/latex] of your sales
Option B: Base salary of [latex]$19\text{,}000[/latex] a year with a commission of [latex]4\%[/latex] of your sales
How many electronics would you need to sell for option A to produce a larger income?
Solution
[latex]\begin{array}{l}\text{Option A: }y=0.10x+14\text{,}000\text{ where }x\text{ is dollars of sales.}\\\text{Option B: }y=0.04x+19\text{,}000\text{ where }x\text{ is dollars of sales.}\\ \begin{array}{rcl}0.10x+14\text{,}000&\ge&0.04x+19\text{,}000\\0.06x+14\text{,}000&\ge&19\text{,}000\\0.06x&\ge&5\text{,}000\\x&\ge&83\text{,}333.33\end{array}\\\text{So, more than }$83\text{,}333.33\text{ in sales.}\end{array}[/latex]
Option A: Base salary of [latex]$20\text{,}000[/latex] a year with a commission of [latex]12\%[/latex] of your sales
Option B: Base salary of [latex]$26\text{,}000[/latex] a year with a commission of [latex]3\%[/latex] of your sales
How many electronics would you need to sell for option A to produce a larger income?
Option A: Base salary of [latex]$10\text{,}000[/latex] a year with a commission of [latex]9\%[/latex] of your sales
Option B: Base salary of [latex]$20\text{,}000[/latex] a year with a commission of [latex]4\%[/latex] of your sales
How much electronics would you need to sell for option A to produce a larger income?
Solution
[latex]\begin{array}{l}\text{Option A: }y=0.09x+10\text{,}000\text{ where }x\text{ is dollars of sales.}\\ \text{Option B: }y=0.04x+20\text{,}000\text{ where }x\text{ is dollars of sales.}\\ \begin{array}{rcl}0.09x+10\text{,}000&\ge&0.04x+20\text{,}000\\0.05x+10\text{,}000&\ge&20\text{,}000\\0.05x&\ge&10\text{,}000\\x&\ge& 200\text{,}000\end{array}\\ \text{So, more than }$200\text{,}000\text{ in sales.}\end{array}[/latex]
