3.9 Graph Linear Equations in Two Variables
Learning Objectives
By the end of this section, you will be able to:
- Plot points in a rectangular coordinate system
- Verify solutions to an equation in two variables
- Complete a table of solutions to a linear equation
- Find solutions to a linear equation in two variables
- Recognize the relationship between the solutions of an equation and its graph.
- Graph a linear equation by plotting points.
- Graph vertical and horizontal lines.
- Identify the [latex]x[/latex]-intercept and [latex]y[/latex]-intercept on a graph
- Find the [latex]x[/latex]-intercept and [latex]y[/latex]-intercept from an equation of a line
- Graph a line using the intercepts
Try It
Before you get started, take this readiness quiz:
1) Evaluate [latex]x+3[/latex] when [latex]x=-1[/latex].
2) Evaluate [latex]2x-5y[/latex] when [latex]x=3[/latex] and [latex]y=-2[/latex].
3) Solve for [latex]y[/latex]: [latex]40-4y=20[/latex].
4) Evaluate [latex]3x+2[/latex] when [latex]x=-1[/latex].
5) Solve [latex]3x+2y=12[/latex] for [latex]y[/latex] in general.
6) Solve: [latex]3\cdot 0+4y=-2[/latex].
Plot Points on a Rectangular Coordinate System
Just like maps use a grid system to identify locations, a grid system is used in algebra to show a relationship between two variables in a rectangular coordinate system. The rectangular coordinate system is also called the [latex]xy[/latex]-plane or the ‘coordinate plane’.
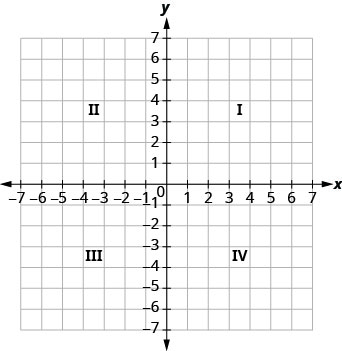
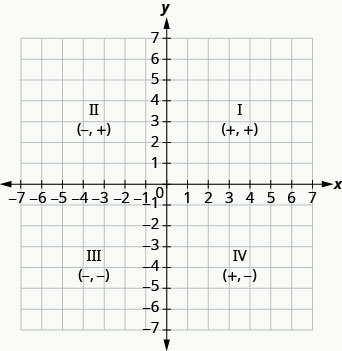
The horizontal number line is called the [latex]x[/latex]-axis. The vertical number line is called the [latex]y[/latex]-axis. The [latex]x[/latex]-axis and the [latex]y[/latex]-axis together form the rectangular coordinate system. These axes divide a plane into four regions, called quadrants. The quadrants are identified by Roman numerals, beginning on the upper right and proceeding counterclockwise. See Figure 3.9.1.
‘Quadrant’ has the root ‘quad,’ which means ‘four.’
In the rectangular coordinate system, every point is represented by an ordered pair. The first number in the ordered pair is the [latex]x[/latex]-coordinate of the point, and the second number is the [latex]y[/latex]-coordinate of the point.
Ordered Pair
An ordered pair, [latex](x,y)[/latex], gives the coordinates of a point in a rectangular coordinate system.
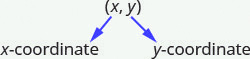
The first number is the [latex]x[/latex]-coordinate.
The second number is the [latex]y[/latex]-coordinate.
The phrase ‘ordered pair’ means the order is important. What is the ordered pair of the point where the axes cross? At that point both coordinates are zero, so its ordered pair is [latex](0,0)[/latex]. The point [latex](0,0)[/latex] has a special name. It is called the origin.
The Origin
The point [latex](0,0)[/latex] is called the origin. It is the point where the [latex]x[/latex]-axis and [latex]y[/latex]-axis intersect.
We use the coordinates to locate a point on the [latex]xy[/latex]-plane. Let’s plot the point [latex](1,3)[/latex] as an example. First, locate [latex]1[/latex] on the [latex]x[/latex]-axis and lightly sketch a vertical line through [latex]x=1[/latex]. Then, locate [latex]3[/latex] on the [latex]y[/latex]-axis and sketch a horizontal line through [latex]y=3[/latex]. Now, find the point where these two lines meet—that is the point with coordinates [latex](1,3)[/latex].
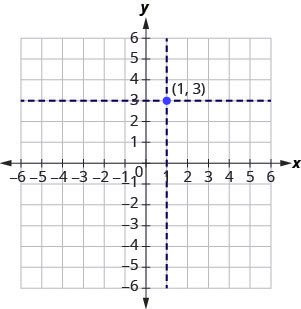
Notice that the vertical line through [latex]x=1[/latex] and the horizontal line through [latex]y=3[/latex] are not part of the graph. We just used them to help us locate the point [latex](1,3)[/latex].
Example 3.9.1
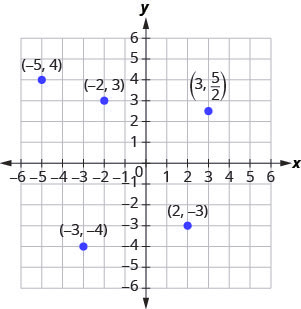
Plot each point in the rectangular coordinate system and identify the quadrant in which the point is located:
a. [latex](-5,4)[/latex]
b. [latex](-3,-4)[/latex]
c. [latex](2,-3)[/latex]
d. [latex](-2,3)[/latex]
e. [latex](3,\frac{5}{2})[/latex]
Solution
The first number of the coordinate pair is the [latex]x[/latex]-coordinate, and the second number is the [latex]y[/latex]-coordinate.
a. Since [latex]x=-5[/latex], the point is to the left of the [latex]y[/latex]-axis. Also, since [latex]y=4[/latex], the point is above the [latex]x[/latex]-axis. The point [latex](-5,4)[/latex] is in Quadrant II.
b. Since [latex]x=-3[/latex], the point is to the left of the [latex]y[/latex]-axis. Also, since [latex]y=-4[/latex], the point is below the [latex]x[/latex]-axis. The point [latex](-3,-4)[/latex] is in Quadrant III.
c. Since [latex]x=2[/latex], the point is to the right of the [latex]y[/latex]-axis. Since [latex]y=-3[/latex], the point is below the [latex]x[/latex]-axis. The point [latex](2,-3)[/latex] is in Quadrant lV.
d. Since [latex]x=-2[/latex], the point is to the left of the [latex]y[/latex]-axis. Since [latex]y=3[/latex], the point is above the [latex]x[/latex]-axis. The point [latex](-2,3)[/latex] is in Quadrant II.
e. Since [latex]x=3[/latex], the point is to the right of the [latex]y[/latex]-axis. Since [latex]y=\frac{5}{2}[/latex], the point is above the [latex]x[/latex]-axis. (It may be helpful to write [latex]\frac{5}{2}[/latex]) as a mixed number or decimal.) The point [latex](3,\frac{5}{2})[/latex] is in Quadrant I.
Try It
7) Plot each point in a rectangular coordinate system and identify the quadrant in which the point is located:
a. [latex](-2,1)[/latex]
b. [latex](-3,-1)[/latex]
c. [latex](4,-4)[/latex]
d. [latex](-4,4)[/latex]
e. [latex](-4,\frac{3}{2})[/latex]
Solution
8) Plot each point in a rectangular coordinate system and identify the quadrant in which the point is located:
a. [latex](-4,1)[/latex]
b. [latex](-2,3)[/latex]
c. [latex](2,-5)[/latex]
d. [latex](-2,5)[/latex]
e. [latex](-3,\frac{5}{2})[/latex]
Solution
How do the signs affect the location of the points? You may have noticed some patterns as you graphed the points in the previous example.
For the point in Figure 3.9.4 in Quadrant IV, what do you notice about the signs of the coordinates? What about the signs of the coordinates of points in the third quadrant? The second quadrant? The first quadrant?
Can you tell just by looking at the coordinates in which quadrant the point [latex](-2,5)[/latex] is located? In which quadrant is [latex](2,-5)[/latex] located?
Quadrants
We can summarize sign patterns of the quadrants in this way.
| Quadrant I | Quadrant II | Quadrant III | Quadrant IV |
|---|---|---|---|
| [latex](x,y)[/latex] | [latex](x,y)[/latex] | [latex](x,y)[/latex] | [latex](x,y)[/latex] |
| [latex](+,+)[/latex] | [latex](-,+)[/latex] | [latex](-,-)[/latex] | [latex](+,-)[/latex] |
What if one coordinate is zero as shown in Figure 3.9.8? Where is the point [latex](0,4)[/latex] located? Where is the point [latex](-2,0)[/latex] located?
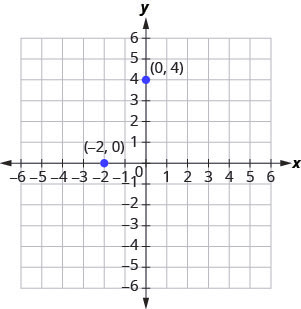
The point [latex](0,4)[/latex] is on the y-axis and the point [latex](-2,0)[/latex] is on the x-axis.
Points on the Axes
Points with a [latex]y[/latex]-coordinate equal to [latex]0[/latex] are on the [latex]x[/latex]-axis, and have coordinates [latex](a,0)[/latex].
Points with an [latex]x[/latex]-coordinate equal to [latex]0[/latex] are on the [latex]y[/latex]-axis, and have coordinates [latex](0,b)[/latex].
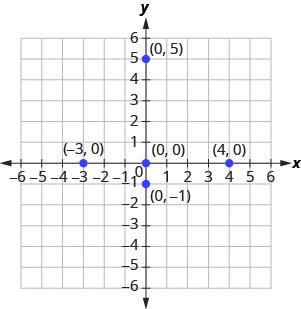
Example 3.9.2
Plot each point:
a. [latex](0,5)[/latex]
b. [latex](4,0)[/latex]
c. [latex](-3,0)[/latex]
d. [latex](0,0)[/latex]
e. [latex](0,-1)[/latex]
Solution
a. Since [latex]x=0[/latex], the point whose coordinates are [latex](0,5)[/latex] is on the [latex]y[/latex]-axis.
b. Since [latex]y=0[/latex], the point whose coordinates are [latex](4,0)[/latex] is on the [latex]x[/latex]-axis.
c. Since [latex]y=0[/latex], the point whose coordinates are [latex](-3,0)[/latex] is on the [latex]x[/latex]-axis.
d. Since [latex]x=0[/latex] and [latex]y=0[/latex], the point whose coordinates are [latex](0,0)[/latex] is the origin.
e. Since [latex]x=0[/latex], the point whose coordinates are [latex](0,-1)[/latex] is on the [latex]y[/latex]-axis.
Try It
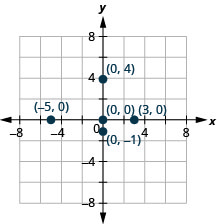
9) Plot each point:
a. [latex](4,0)[/latex]
b. [latex](-2,0)[/latex]
c. [latex](0,0)[/latex]
d. [latex](0,2)[/latex]
e. [latex](0,-3)[/latex]
Solution
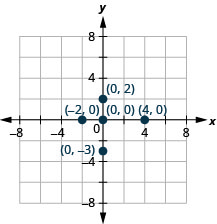
10) Plot each point:
a. [latex](-5,0)[/latex]
b. [latex](3,0)[/latex]
c. [latex](0,0)[/latex]
d. [latex](0,-1)[/latex]
e. [latex](0,4)[/latex]
Solution
In algebra, being able to identify the coordinates of a point shown on a graph is just as important as being able to plot points. To identify the [latex]x[/latex]-coordinate of a point on a graph, read the number on the [latex]x[/latex]-axis directly above or below the point. To identify the [latex]y[/latex]-coordinate of a point, read the number on the [latex]y[/latex]-axis directly to the left or right of the point. Remember, when you write the ordered pair use the correct order, [latex](x,y)[/latex].
Example 3.9.3
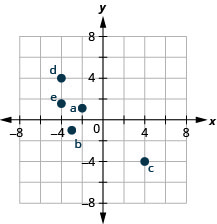
Name the ordered pair of each point shown in the rectangular coordinate system.
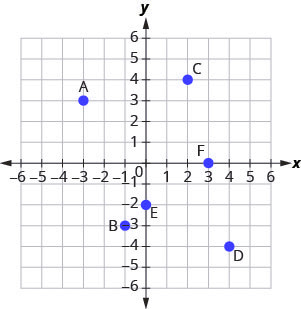
Solution
Point A is above [latex]-3[/latex] on the [latex]x[/latex]-axis, so the [latex]x[/latex]-coordinate of the point is [latex]-3[/latex].
- The point is to the left of [latex]3[/latex] on the [latex]y[/latex]-axis, so the [latex]y[/latex]-coordinate of the point is [latex]3[/latex].
- The coordinates of the point are [latex](-3,3)[/latex].
Point B is below [latex]-1[/latex] on the [latex]x[/latex]-axis, so the [latex]x[/latex]-coordinate of the point is [latex]-1[/latex].
- The point is to the left of [latex]-3[/latex] on the [latex]y[/latex]-axis, so the [latex]y[/latex]-coordinate of the point is [latex]-3[/latex].
- The coordinates of the point are [latex](-1,-3)[/latex].
Point C is above [latex]2[/latex] on the [latex]x[/latex]-axis, so the [latex]x[/latex]-coordinate of the point is [latex]2[/latex].
- The point is to the right of [latex]4[/latex] on the [latex]y[/latex]-axis, so the [latex]y[/latex]-coordinate of the point is [latex]4[/latex].
- The coordinates of the point are [latex](2,4)[/latex].
Point D is below [latex]4[/latex] on the [latex]x[/latex]-axis, so the [latex]x[/latex]-coordinate of the point is [latex]4[/latex].
- The point is to the right of [latex]-4[/latex] on the [latex]y[/latex]-axis, so the [latex]y[/latex]-coordinate of the point is [latex]-4[/latex].
- The coordinates of the point are [latex](4,-4)[/latex].
Point E is on the [latex]y[/latex]-axis at [latex]y=-2[/latex]. The coordinates of point E are [latex](0,-2)[/latex].
Point F is on the [latex]x[/latex]-axis at [latex]x=3[/latex]. The coordinates of point F are [latex](3,0)[/latex].
Try It
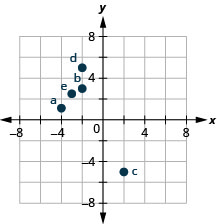
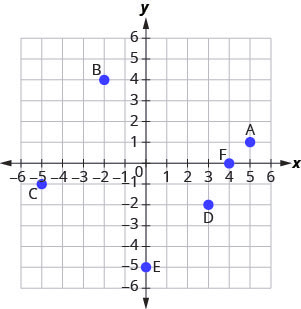
11) Name the ordered pair of each point shown in the rectangular coordinate system.
Solution
a: [latex](5,1)[/latex]
b: [latex](-2,4)[/latex]
c: [latex](-5,-1)[/latex]
d: [latex](3,-2)[/latex]
e: [latex](0,-5)[/latex]
f: [latex](4,0)[/latex]
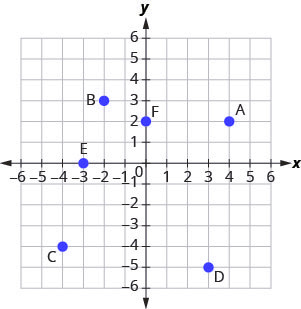
12) Name the ordered pair of each point shown in the rectangular coordinate system.
Solution
a: [latex](4,2)[/latex]
b: [latex](-2,3)[/latex]
c: [latex](-4,-4)[/latex]
d: [latex](3,-5)[/latex]
e: [latex](-3,0)[/latex]
f: [latex](0,2)[/latex]
Verify Solutions to an Equation in Two Variables
Up to now, all the equations you have solved were equations with just one variable. In almost every case, when you solved the equation you got exactly one solution. The process of solving an equation ended with a statement like [latex]x=4[/latex]. (Then, you checked the solution by substituting back into the equation.)
Here’s an example of an equation in one variable, and its one solution.
[latex]\begin{eqnarray*}3x\;+\;5\;&=&\;17\\3x\;&=&\;12\\x\;&=&\;4\end{eqnarray*}[/latex]
But equations can have more than one variable. Equations with two variables may be of the form [latex]Ax\;+\;By\;=\;C[/latex]. Equations of this form are called linear equations in two variables.
Linear Equation
An equation of the form [latex]Ax\;+\;By\;=\;C[/latex], where [latex]A[/latex] and [latex]B[/latex] are not both zero, is called a linear equation in two variables.
Notice the word line in linear. Here is an example of a linear equation in two variables, [latex]x[/latex] and [latex]y[/latex].
[latex]\begin{align*} {\color{red}{A}}x+{\color{blue}{B}}y&={\color{purple}{C}}\\ x+{\color{blue}{4}}y&={\color{purple}{8}}\\ {\color{red}{A}}{\color{red}{=}}{\color{red}{1}},\;{\color{blue}{B}}{\color{blue}{=}}{\color{blue}{4}},&\;{\color{purple}{C}}{\color{purple}{=}}{\color{purple}{8}} \end{align*}[/latex]
The equation [latex]y\;=\;-3x\;+\;5[/latex] is also a linear equation. But it does not appear to be in the form [latex]Ax\;+\;By\;=\;C[/latex]. We can use the Addition Property of Equality and rewrite it in [latex]Ax\;+\;By\;=\;C[/latex] form.
[latex]\small{\begin{align*}&\;&y&=-3x+5\\ &\text{Step 1: Add to both sides.}\;&y+3x&=-3x+5+3x\\ &\text{Step 2: Simplify.}\;&y+3x&=5\\ &\text{Step 3: Use the Commutative Property to put it in Ax+By=C form.}\;&3x=y&=5 \end{align*}}[/latex]
By rewriting [latex]y\;=\;-3x\;+\;5[/latex] as [latex]3x\;+\;y\;=\;5[/latex], we can easily see that it is a linear equation in two variables because it is of the form [latex]Ax\;+\;By\;=\;C[/latex]. When an equation is in the form [latex]Ax\;+\;By\;=\;C[/latex], we say it is in standard form.
Standard Form of Linear Equation
A linear equation is in standard form when it is written [latex]Ax\;+\;By\;=\;C[/latex].
Most people prefer to have [latex]A[/latex], [latex]B[/latex], and [latex]C[/latex] be integers and [latex]𝐴\geq0[/latex] when writing a linear equation in standard form, although it is not strictly necessary.
Linear equations have infinitely many solutions. For every number that is substituted for [latex]x[/latex] there is a corresponding [latex]y[/latex] value. This pair of values is a solution to the linear equation and is represented by the ordered pair [latex](x,y)[/latex]. When we substitute these values of [latex]x[/latex] and [latex]y[/latex] into the equation, the result is a true statement, because the value on the left side is equal to the value on the right side.
Solution of a Linear Equation in Two Variables
An ordered pair[latex](x,y)[/latex] is a solution of the linear equation [latex]Ax\;+\;By\;=\;C[/latex], if the equation is a true statement when the [latex]x[/latex] and [latex]y[/latex] values of the ordered pair are substituted into the equation.
Example 3.9.4
Determine which ordered pairs are solutions to the equation [latex]x+4y=8[/latex].
a. [latex](0,2)[/latex]
b. [latex](2,-4)[/latex]
c. [latex](-4,3)[/latex]
Solution
Substitute the [latex]x[/latex]– and [latex]y[/latex]-values from each ordered pair into the equation and determine if the result is a true statement.
| (a) | (b) | (c) |
|---|---|---|
| [latex]\begin{align*} (0,2)\\ x={\color{blue}{0}}, y&={\color{red}{2}}\\ x+4y&=8\\ {\color{blue}{0}}+4\cdot{\color{red}{2}}&\overset?=8\\ 0+8&\overset?=8\\ 8&=8\checkmark \end{align*}[/latex] | [latex]\begin{align*} (2,-4)\\ x={\color{blue}{2}}, y&={\color{red}{-4}}\\ x+4y&=8\\ {\color{blue}{2}}+4\cdot{\color{red}{-4}}&\overset?=8\\ 2+(-16)&\overset?=8\\ -14&\neq8 \end{align*}[/latex] | [latex]\begin{align*} (-4,3)\\ x={\color{blue}{-4}}, y&={\color{red}{3}}\\ x+4y&=8\\ {\color{blue}{-4}}+4\cdot{\color{red}{3}}&\overset?=8\\ -4+12&\overset?=8\\ 8&=8\checkmark \end{align*}[/latex] |
| [latex](0,2)[/latex] is a solution | [latex](2,-4)[/latex] is not a solution | [latex](-4,3)[/latex] is a solution |
Try It
13) Which of the following ordered pairs are solutions to [latex]2x+3y=6[/latex]?
a. [latex](3,0)[/latex]
b. [latex](2,0)[/latex]
c. [latex](6,-2)[/latex]
Solution
a, c
14) Which of the following ordered pairs are solutions to the equation [latex]4x-y=8[/latex]?
a. [latex](0,8)[/latex]
b. [latex](2,0)[/latex]
c. [latex](1,-4)[/latex]
Solution
b, c
Example 3.9.5
Which of the following ordered pairs are solutions to the equation [latex]y=5x-1[/latex]?
b. [latex](1,4)[/latex]
c. [latex](-2,-7)[/latex]
Solution
Substitute the [latex]x[/latex] and [latex]y[/latex] values from each ordered pair into the equation and determine if it results in a true statement.
| (a) | (b) | (c) |
|---|---|---|
| [latex]\begin{align*} (0,-1)\\ x={\color{blue}{0}}, y&={\color{red}{-1}}\\ y&=5x-1\\ {\color{red}{-1}}&\overset?=5({\color{blue}{0}})-1\\ -1&\overset?=0-1\\ -1&=-1\checkmark \end{align*}[/latex] | [latex]\begin{align*} (1,4)\\ x={\color{blue}{1}}, y&={\color{red}{4}}\\ y&=5x-1\\ {\color{red}{4}}&\overset?=5({\color{blue}{1}})-1\\ 4&\overset?=5-1\\ 4&=4\checkmark \end{align*}[/latex] | [latex]\begin{align*} (-2,-7)\\ x={\color{blue}{-2}}, y&={\color{red}{-7}}\\ y&=5x-1\\ {\color{red}{-7}}&\overset?=5({\color{blue}{-2}})-1\\ -7&\overset?=-10-1\\ 7&\neq-11 \end{align*}[/latex] |
| [latex](0,-1)[/latex] is a solution. | [latex](1,4)[/latex] is a solution. | [latex](-2,-7)[/latex] is not a solution. |
Try It
15) Which of the following ordered pairs are solutions to the equation [latex]y=4x-3[/latex]?
a. [latex](0,3)[/latex]
b. [latex](1,1)[/latex]
c. [latex](-1,-1)[/latex]
Solution
b
16) Which of the following ordered pairs are solutions to the equation [latex]y=-2x+6[/latex]?
a. [latex](0,6)[/latex]
b. [latex](1,4)[/latex]
c. [latex](-2,-2)[/latex]
Solution
a, b
Complete a Table of Solutions to a Linear Equation in Two Variables
In the examples above, we substituted the [latex]x[/latex] and [latex]y[/latex] values of a given ordered pair to determine whether or not it was a solution to a linear equation. But how do you find the ordered pairs if they are not given? It’s easier than you might think—you can just pick a value for [latex]x[/latex] and then solve the equation for [latex]y[/latex]. Or, pick a value for [latex]y[/latex] and then solve for [latex]x[/latex].
We’ll start by looking at the solutions to the equation [latex]y=5x-1[/latex] that we found in Example 3.9.5. We can summarize this information in a table of solutions, as shown in the below table.
| [latex]y=5x-1[/latex] | ||
| [latex]x[/latex] | [latex]y[/latex] | [latex](x,y)[/latex] |
| [latex]0[/latex] | [latex]-1[/latex] | [latex](0,-1)[/latex] |
| [latex]1[/latex] | [latex]4[/latex] | [latex](1,4)[/latex] |
To find a third solution, we’ll let [latex]x=2[/latex] and solve for [latex]y[/latex].
[latex]\begin{align*}&\;&y&=5x-1\\ &\text{Substitute}\;x={\color{blue}{2}}.\;&y&=5({\color{blue}{2}})-1\\ &\text{Multiply.}\;&y&=10-1\\ &\text{Simplify.}\;&y&=9 \end{align*}[/latex]
The ordered pair [latex](2,9)[/latex] is a solution to [latex]y=5x-1[/latex]. We will add it to below table.
| [latex]y=5x-1[/latex] | ||
| [latex]x[/latex] | [latex]y[/latex] | [latex](x,y)[/latex] |
| [latex]0[/latex] | [latex]-1[/latex] | [latex](0,-1)[/latex] |
| [latex]1[/latex] | [latex]4[/latex] | [latex](1,4)[/latex] |
| [latex]2[/latex] | [latex]9[/latex] | [latex](2,9)[/latex] |
Example 3.9.6
Complete below table to find three solutions to the equation [latex]y=4x-2[/latex].
| [latex]y=4x-2[/latex] | ||
| [latex]x[/latex] | [latex]y[/latex] | [latex](x,y)[/latex] |
| [latex]0[/latex] | ||
| [latex]-1[/latex] | ||
| [latex]2[/latex] | ||
Solution
Substitute [latex]x=0[/latex], [latex]x=-1[/latex], and [latex]x=2[/latex] into [latex]y=4x-2[/latex]
[latex]\begin{align*} x&={\color{blue}{0}}\;\;&x&={\color{blue}{-1}}&x&={\color{blue}{2}}\\ y&=4x-2\;\;&y&=4x-2&y&=4x-2\\ y&=4\cdot{\color{blue}{0}}-2\;\;&y&=4({\color{blue}{-1}})-2\;\;&y&=4\cdot{\color{blue}{2}}-2\\ y&=-2\;\;&y&=-4-2\;\;&y&=8-2\\ y&=-2\;\;&y&=-6\;\;&y&=6\\ \;&(0,-2)\;\;&\;&(-1,-6)\;\;&\;&(2,6) \end{align*}[/latex]
The results are summarized in below table.
| [latex]y=4x-2[/latex] | ||
| [latex]x[/latex] | [latex]y[/latex] | [latex](x,y)[/latex] |
| [latex]0[/latex] | [latex]-2[/latex] | [latex](0,-2)[/latex] |
| [latex]-1[/latex] | [latex]-6[/latex] | [latex](-1,-6)[/latex] |
| [latex]2[/latex] | [latex]6[/latex] | [latex](2,6)[/latex] |
Try It
17) Complete the table to find three solutions to this equation: [latex]y=3x-1[/latex].
| [latex]y=3x-1[/latex] | ||
| [latex]x[/latex] | [latex]y[/latex] | [latex](x,y)[/latex] |
| [latex]0[/latex] | ||
| [latex]-1[/latex] | ||
| [latex]2[/latex] | ||
Solution
| [latex]y=3x-1[/latex] | ||
| [latex]x[/latex] | [latex]y[/latex] | [latex](x,y)[/latex] |
| [latex]0[/latex] | [latex]-1[/latex] | [latex](0,-1)[/latex] |
| [latex]-1[/latex] | [latex]-4[/latex] | [latex](-1,-4)[/latex] |
| [latex]2[/latex] | [latex]5[/latex] | [latex](2,5)[/latex] |
18) Complete the table to find three solutions to this equation: [latex]y=6x+1[/latex].
| [latex]y=6x+1[/latex] | ||
| [latex]x[/latex] | [latex]y[/latex] | [latex](x,y)[/latex] |
| [latex]0[/latex] | ||
| [latex]-1[/latex] | ||
| [latex]2[/latex] | ||
Solution
| [latex]y=6x-1[/latex] | ||
| [latex]x[/latex] | [latex]y[/latex] | [latex](x,y)[/latex] |
| [latex]0[/latex] | [latex]1[/latex] | [latex](0,-1)[/latex] |
| [latex]-1[/latex] | [latex]7[/latex] | [latex](1,7)[/latex] |
| [latex]2[/latex] | [latex]-11[/latex] | [latex](2,-11)[/latex] |
Example 3.9.7
Complete the below table to find three solutions to the equation [latex]5x-4y=20[/latex].
| [latex]5x-4y=20[/latex] | ||
| [latex]x[/latex] | [latex]y[/latex] | [latex](x,y)[/latex] |
| [latex]0[/latex] | ||
| [latex]0[/latex] | ||
| [latex]5[/latex] | ||
Solution
Substitute the given value into the equation [latex]5x-4y=20[/latex] and solve for the other variable. Then, fill in the values in the table.
[latex]\begin{align*} x&={\color{blue}{0}}\;\;&y&={\color{red}{0}}&y&={\color{purple}{5}}\\ 5x-4y&=20-2\;\;&5x-4y&=20&5x-4y&=20\\ 5\cdot{\color{blue}{0}}&=20\;\;&5x-4\cdot{\color{red}{0}}&=20\;\;&5x-4\cdot{\color{purple}{5}}&=20\\ 0-4y&=20\;\;&5x-0&=20\;\;&5x-20&=20\\ -4y&=20\;\;&5x&=20\;\;&5x&=40\\ y&=-5\;\;&x&=4\;\;&x&=8\\ \;&(0,-5)\;\;&\;&(4,0)\;\;&\;&(8,5) \end{align*}[/latex]
The results are summarized in the below table.
| [latex]5x-4y=20[/latex] | ||
| [latex]x[/latex] | [latex]y[/latex] | [latex](x,y)[/latex] |
| [latex]0[/latex] | [latex]-5[/latex] | [latex](0,-5)[/latex] |
| [latex]4[/latex] | [latex]0[/latex] | [latex](4,0)[/latex] |
| [latex]8[/latex] | [latex]5[/latex] | [latex](8,5)[/latex] |
Try It
19) Complete the table to find three solutions to this equation: [latex]2x-5y=20[/latex].
| [latex]2x-5y=20[/latex] | ||
| [latex]x[/latex] | [latex]y[/latex] | [latex](x,y)[/latex] |
| [latex]0[/latex] | ||
| [latex]0[/latex] | ||
| [latex]-5[/latex] | ||
Solution
| [latex]2x-5y=20[/latex] | ||
| [latex]x[/latex] | [latex]y[/latex] | [latex](x,y)[/latex] |
| [latex]0[/latex] | [latex]-4[/latex] | [latex](0,-4)[/latex] |
| [latex]10[/latex] | [latex]0[/latex] | [latex](10,0)[/latex] |
| [latex]-5[/latex] | [latex]-6[/latex] | [latex](-5,-6)[/latex] |
20) Complete the table to find three solutions to this equation: [latex]3x-4y=12[/latex].
| [latex]3x-4y=12[/latex] | ||
| [latex]x[/latex] | [latex]y[/latex] | [latex](x,y)[/latex] |
| [latex]0[/latex] | ||
| [latex]0[/latex] | ||
| [latex]-4[/latex] | ||
Solution
| [latex]3x-4y=12[/latex] | ||
| [latex]x[/latex] | [latex]y[/latex] | [latex](x,y)[/latex] |
| [latex]0[/latex] | [latex]-3[/latex] | [latex](0,-3)[/latex] |
| [latex]4[/latex] | [latex]0[/latex] | [latex](4,0)[/latex] |
| [latex]-4[/latex] | [latex]-6[/latex] | [latex](-4,-6)[/latex] |
Find Solutions to a Linear Equation
To find a solution to a linear equation, you really can pick any number you want to substitute into the equation for [latex]x[/latex] or [latex]y[/latex]. But since you’ll need to use that number to solve for the other variable it’s a good idea to choose a number that’s easy to work with.
When the equation is in [latex]y[/latex]-form, with the [latex]y[/latex] by itself on one side of the equation, it is usually easier to choose values of [latex]x[/latex] and then solve for [latex]y[/latex].
Example 3.9.8
Solution
We can substitute any value we want for [latex]x[/latex] or any value for [latex]y[/latex]. Since the equation is in [latex]y[/latex]-form, it will be easier to substitute in values of [latex]x[/latex].
Let’s pick [latex]x=0[/latex], [latex]x=1[/latex], and [latex]x=-1[/latex].
| [latex]\begin{align*}x&=\;{\color{blue}{0}}\\y&=\;-3x\;+\;2\end{align*}[/latex] | [latex]\begin{align*}x&=\;{\color{blue}{1}}\\y&=\;-3x\;+\;2\end{align*}[/latex] | [latex]\begin{align*}x&=\;{\color{blue}{-}}{\color{blue}{1}}\\y&=\;-3x\;+\;2\end{align*}[/latex] |
Step 1: Substitute the value into the equation.
| [latex]{y\;=\;-3\;\times\;}{\color{blue}{0}}{\;+\;2}[/latex] | [latex]{y\;=\;-3\;\times\;}{\color{blue}{1}}{\;+\;2}[/latex] | [latex]{y\;=\;-3\;\times\;}{\color{blue}{(}}{{\color{blue}{-}}{\color{blue}{1}}}{\color{blue}{)}}{\;+\;2}[/latex] |
Step 2: Simplify.
| [latex]y\;=\;0\;+\;2[/latex] | [latex]y\;=\;-3\;+\;2[/latex] | [latex]y\;=\;3\;+\;2[/latex] |
Step 3: Simplify.
| [latex]y\;=\;2[/latex] | [latex]y\;=\;-1[/latex] | [latex]y\;=\;5[/latex] |
Step 4: Write the ordered pair.
| [latex](0, 2)[/latex] | [latex](1, −1)[/latex] | [latex](−1, 5)[/latex] |
Step 5: Check.
| [latex]\begin{eqnarray*}y\;&=&\;-3x\;+\;2\\2\;&\overset?=&\;-3(0)\;+\;2\\2\;&=&\;2\;\checkmark\\\end{eqnarray*}[/latex] | [latex]\begin{eqnarray*}y\;&=&\;-3x\;+\;2\\-1\;&\overset?=&\;-3(1)\;+\;2\\-1\;&=&\;-1\;\checkmark\\\end{eqnarray*}[/latex] | [latex]\begin{eqnarray*}y\;&=&\;-3x\;+\;2\\5\;&\overset?=&\;-3(-1)\;+\;2\\5\;&=&\;5\;\checkmark\\\end{eqnarray*}[/latex] |
So, [latex](0,2)[/latex], [latex](1,-1)[/latex] and [latex](-1,5)[/latex] are all solutions to [latex]y=-3x+2[/latex]. We show them in the below table.
| [latex]y=-3x+2[/latex] | ||
| [latex]x[/latex] | [latex]y[/latex] | [latex](x,y)[/latex] |
| [latex]0[/latex] | [latex]2[/latex] | [latex](0,2)[/latex] |
| [latex]1[/latex] | [latex]-1[/latex] | [latex](1,-1)[/latex] |
| [latex]-1[/latex] | [latex]5[/latex] | [latex](-1,5)[/latex] |
Try It
21) Find three solutions to this equation: [latex]y=-2x+3[/latex].
Solution
Answers will vary.
22) Find three solutions to this equation: [latex]y=-4x+1[/latex].
Solution
Answers will vary.
We have seen how using zero as one value of [latex]x[/latex] makes finding the value of [latex]y[/latex] easy. When an equation is in standard form, with both the [latex]x[/latex] and [latex]y[/latex] on the same side of the equation, it is usually easier to first find one solution when [latex]x=0[/latex] find a second solution when [latex]y=0[/latex], and then find a third solution.
Example 3.9.9
Find three solutions to the equation [latex]3x+2y=6[/latex].
Solution
We can substitute any value we want for [latex]x[/latex] or any value for [latex]y[/latex]. Since the equation is in standard form, let’s pick first [latex]x=0[/latex], then [latex]y=0[/latex], and then find a third point.
| [latex]{x\;=\;}{\color{blue}{0}}[/latex] | [latex]{y\;=\;}{\color{red}{0}}[/latex] | [latex]{x\;=\;}{\color{blue}{1}}[/latex] |
Step 1: Substitute the value into the equation.
| [latex]3x\;+\;2y\;=\;6[/latex] | [latex]3x\;+\;2y\;=\;6[/latex] | [latex]3x\;+\;2y\;=\;6[/latex] |
Step 2. Simplify.
| [latex]{3(}{\color{blue}{0}}{)\;+\;2y\;=\;6}[/latex] | [latex]{3x\;+\;2(}{\color{blue}{0}}{)\;=\;6}[/latex] | [latex]{3(}{\color{blue}{1}}{)\;+\;2y\;=\;6}[/latex] |
Step 3: Solve.
| [latex]\begin{eqnarray*}0\;+\;2y\;&=&\;6\\2y\;&=&\;6\\y\;&=&\;3\\\end{eqnarray*}[/latex] | [latex]\begin{eqnarray*}3x\;+\;0\;&=&\;6\\3x\;&=&\;6\\x\;&=&\;2\end{eqnarray*}[/latex] | [latex]\begin{eqnarray*}3\;+\;2y\;=\;6\\2y\;=\;3\\y\;=\;\frac32\end{eqnarray*}[/latex] |
Step 4: Write the ordered pair.
| [latex](0, 3)[/latex] | [latex](2, 0)[/latex] | [latex](1,\frac{3}{2})[/latex] |
Step 5: Check.
| [latex]\begin{eqnarray*}3x\;+\;2y\;&=&\;6\\3(0)\;+\;2(3)\;&\overset?=&\;6\\0\;+\;6\;&=&\;6\\6\;&=&\;6\;\checkmark\end{eqnarray*}[/latex] | [latex]\begin{eqnarray*}3x\;+\;2y\;&=&\;6\\3(2)\;+\;2(0)\;&\overset?=&\;6\\6\;+\;0\;&=&\;6\\6\;&=&\;6\;\checkmark\end{eqnarray*}[/latex] | [latex]\begin{eqnarray*}3x\;+\;2y\;&=&\;6\\3(1)\;+\;2(\frac32)\;&\overset?=&\;6\\3\;+\;3\;&\overset?=&\;6\\6\;&=&\;6\;\checkmark\end{eqnarray*}[/latex] |
So [latex](0,3)[/latex], [latex](2,0)[/latex], and [latex](1,\frac{3}{2})[/latex] are all solutions to the equation [latex]3x+2y=6[/latex]. We can list these three solutions in below table.
| [latex]3x+2y=6[/latex] | ||
| [latex]x[/latex] | [latex]y[/latex] | [latex](x,y)[/latex] |
| [latex]0[/latex] | [latex]3[/latex] | [latex](0,3)[/latex] |
| [latex]2[/latex] | [latex]0[/latex] | [latex](2,0)[/latex] |
| [latex]1[/latex] | [latex]\frac{3}{2}[/latex] | [latex](1,\frac{3}{2})[/latex] |
Try It
23) Find three solutions to the equation [latex]2x+3y=6[/latex].
Solution
Answers will vary.
24) Find three solutions to the equation [latex]4x+2y=8[/latex].
Solution
Answers will vary.
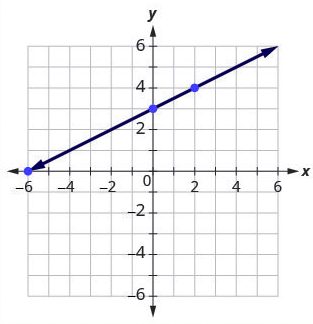
Recognize the Relationship Between the Solutions of an Equation and its Graph
In the previous section, we found several solutions to the equation [latex]3x+2y=6[/latex]. They are listed in the table below. So, the ordered pairs [latex](0,3)[/latex], [latex](2,0)[/latex], and [latex](1,\frac{3}{2})[/latex] are some solutions to the equation [latex]3x+2y=6[/latex]. We can plot these solutions in the rectangular coordinate system as shown in the below table.
| [latex]3x+2y=6[/latex] | ||
| [latex]x[/latex] | [latex]y[/latex] | [latex](x,y)[/latex] |
| [latex]0[/latex] | [latex]3[/latex] | [latex](0,3)[/latex] |
| [latex]2[/latex] | [latex]0[/latex] | [latex](2,0)[/latex] |
| [latex]1[/latex] | [latex]\frac{3}{2}[/latex] | [latex](1,\frac{3}{2})[/latex] |
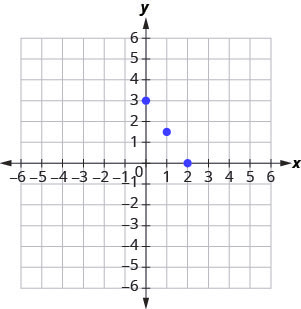
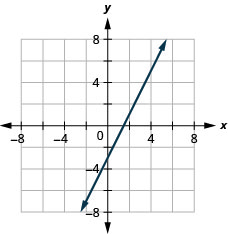
Notice how the points line up perfectly? We connect the points with a line to get the graph of the equation [latex]3x+2y=6[/latex]. See Figure 3.9.16. Notice the arrows on the ends of each side of the line. These arrows indicate the line continues.

Every point on the line is a solution of the equation. Also, every solution of this equation is a point on this line. Points not on the line are not solutions.
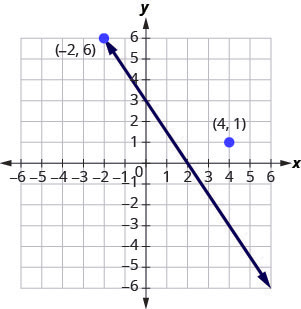
Notice that the point whose coordinates are [latex](-2,6)[/latex] is on the line shown in Figure 3.9.17. If you substitute [latex]x=-2[/latex] and [latex]y=6[/latex] into the equation, you find that it is a solution to the equation.
[latex]\begin{align*}\text{Test}({\color{blue}{-2}},&{\color{red}{6}})\\ 3x+2y&=6\\ 3({\color{blue}{-2}})+2({\color{red}{6}})&=6\\ -6+12&=6\\ 6&=6\checkmark \end{align*}[/latex]
So the point [latex](-2,6)[/latex] is a solution to the equation [latex]3x+2y=6[/latex]. (The phrase “the point whose coordinates are [latex](-2,6)[/latex]” is often shortened to “the point [latex](-2,6)[/latex].”)
[latex]\begin{align*}\text{What about}({\color{blue}{4}},&{\color{red}{1}})\\ 3x+2y&=6\\ 3({\color{blue}{4}})+2({\color{red}{1}})&=6\\ 12+2&\overset?=6\\ 14&\neq6\checkmark \end{align*}[/latex]
So [latex](4,1)[/latex] is not a solution to the equation [latex]3x+2y=6[/latex]. Therefore, the point [latex](4,1)[/latex] is not on the line. See Figure 3.9.17. This is an example of the saying, “A picture is worth a thousand words.” The line shows you all the solutions to the equation. Every point on the line is a solution of the equation. And, every solution of this equation is on this line. This line is called the graph of the equation [latex]3x+2y=6[/latex].
Graph of a Linear Equation
The graph of a linear equation [latex]Ax\;+\;By\;=\;C[/latex] is a line.
- Every point on the line is a solution of the equation.
- Every solution of this equation is a point on this line.
Example 3.9.10
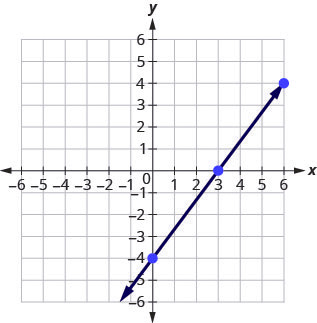
The graph of [latex]y=2x-3[/latex] is shown.
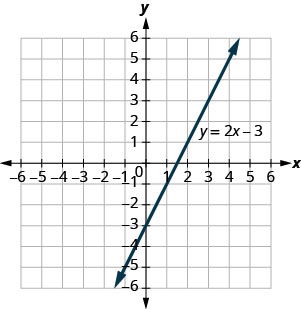
For each ordered pair, decide:
a. Is the ordered pair a solution to the equation?
b. Is the point on the line?
a. [latex](0,-3)[/latex]
b.[latex](3,3)[/latex]
c. [latex](2,-3)[/latex]
d.[latex](-1,-5)[/latex]
Solution
Substitute the [latex]x[/latex]– and [latex]y[/latex]– values into the equation to check if the ordered pair is a solution to the equation.
a.
| A: | B: | C: | D: |
|---|---|---|---|
| [latex]\begin{align*} &({\color{blue}{0}},{\color{red}{-3}})\\ y&=2x-3\\ {\color{red}{-3}}&\overset?=2({\color{blue}{0}})-3\\ -3&=-3\checkmark \end{align*}[/latex] | [latex]\begin{align*} &({\color{blue}{3}},{\color{red}{3}})\\ y&=2x-3\\ {\color{red}{3}}&\overset?=2({\color{blue}{3}})-3\\ 3&=3\checkmark \end{align*}[/latex] | [latex]\begin{align*} &({\color{blue}{2}},{\color{red}{-3}})\\ y&=2x-3\\ {\color{red}{-3}}&\overset?=2({\color{blue}{2}})-3\\ -3&\neq1 \end{align*}[/latex] | [latex]\begin{align*} &({\color{blue}{-1}},{\color{red}{-5}})\\ y&=2x-3\\ {\color{red}{-5}}&\overset?=2({\color{blue}{-1}})-3\\ -5&=-5\checkmark \end{align*}[/latex] |
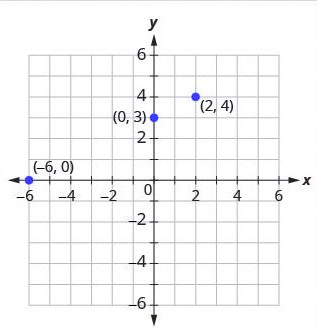
| [latex](0,-3)[/latex] is a solution. | [latex](3,3)[/latex] is a solution | [latex](2,-3)[/latex] is not a solution | [latex](-1,-5)[/latex] is a solution |
b. Plot the points A [latex](0,3)[/latex], B [latex](3,3)[/latex], C [latex](2,-3)[/latex], and D [latex](-1,-5)[/latex].
The points [latex](0,3)[/latex], [latex](3,3)[/latex], and [latex](-1,-5)[/latex] are on the line [latex]y=2x-3[/latex], and the point [latex](2,-3)[/latex] is not on the line.
The points that are solutions to [latex]y=2x-3[/latex] are on the line, but the point that is not a solution is not on the line.
Try It
25) Use the graph of [latex]y=3x-1[/latex] to decide whether each ordered pair is:
- a solution to the equation.
- on the line.
a. [latex](0,-1)[/latex]
b. [latex](2,5)[/latex]
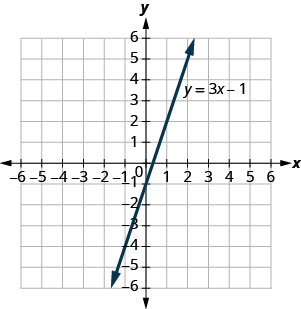
Solution
a. yes, yes
b. yes, yes
26) Use graph of [latex]y=3x-1[/latex] to decide whether each ordered pair is:
- a solution to the equation
- on the line
a. [latex](3,-1)[/latex]
b. [latex](-1,-4)[/latex]
Solution
a. no, no
b. yes, yes
Graph a Linear Equation by Plotting Points
There are several methods that can be used to graph a linear equation. The method we used to graph [latex]3x+2y=6[/latex] is called plotting points, or the Point–Plotting Method.
Example 3.9.11
Graph the equation [latex]y=2x+1[/latex] by plotting points.
Solution
Step 1: Find three points whose coordinates are solutions to the equation.
You can choose any values for [latex]x[/latex] or [latex]y[/latex].
In this case, since [latex]y[/latex] is isolated on the left side of the equation, it is easier to choose values for [latex]x[/latex].
[latex]\begin{align*}y&=2x+1\\[4ex]x&={\color{blue}{0}}\\ y&=2x+1\\ y&=2\cdot{\color{blue}{0}}+1\\ y&=0+1\\ y&=1 \\[4ex]x&={\color{blue}{1}}\\ y&=2x+1\\ y&=2\cdot{\color{blue}{1}}+1\\ y&=2+1\\ y&=3\\[4ex]x&={\color{blue}{-2}}\\ y&=2x+1\\ y&=2\cdot{\color{blue}{-2}}+1\\ y&=-4+1\\ y&=-3 \end{align*}[/latex]
Organize the solutions in a table.
Put the three solutions in a table.
| y=2x+1 | ||
| x | y | (x,y) |
| 0 | 1 | (0,1) |
| 1 | 3 | (1,3) |
| -2 | -3 | (-2.-3) |
Step 2: Plot the points in a rectangular coordinate system.
Plot: (0,1), (1, 3), (-2,-3).
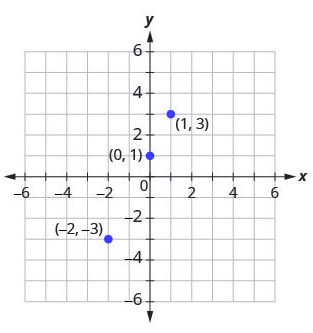
Check that the points line up. If they do not, carefully check your work!
Do the points line up? Yes, the points line up.
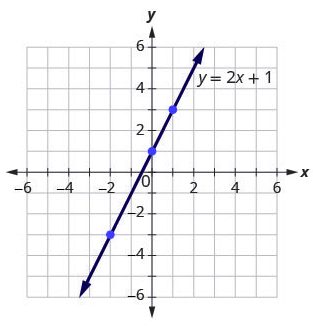
Step 3: Draw the line through the three points. Extend the line to fill the grid and put arrows on both ends of the line.
This line is the graph of [latex]y=2x+1[/latex].
Try It
27) Graph the equation by plotting points: [latex]y=2x-3[/latex].
Solution
28) Graph the equation by plotting points: [latex]y=-2x+4[/latex].
Solution

The steps to take when graphing a linear equation by plotting points are summarized below.
HOW TO
Graph a linear equation by plotting points.
- Find three points whose coordinates are solutions to the equation. Organize them in a table.
- Plot the points in a rectangular coordinate system. Check that the points line up. If they do not, carefully check your work.
- Draw the line through the three points. Extend the line to fill the grid and put arrows on both ends of the line.
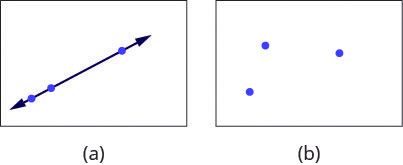
It is true that it only takes two points to determine a line, but it is a good habit to use three points. If you only plot two points and one of them is incorrect, you can still draw a line but it will not represent the solutions to the equation. It will be the wrong line.
If you use three points, and one is incorrect, the points will not line up. This tells you something is wrong and you need to check your work. Look at the difference between part (a) and part (b) in Figure 3.9.25.
Let’s do another example. This time, we’ll show the last two steps all on one grid.
Example 3.9.12
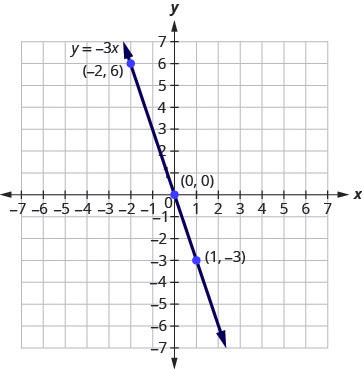
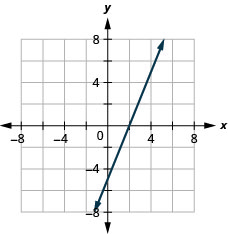
Graph the equation [latex]y=-3x[/latex].
Solution
Step 1: Find three points that are solutions to the equation.
Here, again, it’s easier to choose values for [latex]x[/latex]. Do you see why?
[latex]\begin{align*} x&={\color{blue}{0}}\;\;&x&={\color{blue}{1}}&x&={\color{blue}{-2}}\\ y&=-3x\;\;&y&=-3&y&=-3\\ y&=-3\cdot{\color{blue}{0}}\;\;&y&=-3\cdot{\color{blue}{1}}\;\;&y&=-3({\color{blue}{-2}})\\ y&=0\;\;&y&=-3\;\;&y&=6\\ \end{align*}[/latex]
Step 2: List the points in the following table.
| [latex]y=-3x[/latex] | ||
| [latex]x[/latex] | [latex]y[/latex] | [latex](x,y)[/latex] |
| [latex]0[/latex] | [latex]0[/latex] | [latex](0,0)[/latex] |
| [latex]1[/latex] | [latex]-3[/latex] | [latex](1,-3)[/latex] |
| [latex]-2[/latex] | [latex]6[/latex] | [latex](-2,6)[/latex] |
Step 3: Plot the points, check that they line up, and draw the line.
Try It
29) Graph the equation by plotting points: [latex]y=-4x[/latex].
Solution
30) Graph the equation by plotting points: [latex]y=x[/latex].
Solution
When an equation includes a fraction as the coefficient of [latex]x[/latex], we can still substitute any numbers for [latex]x[/latex]. But the math is easier if we make ‘good’ choices for the values of [latex]x[/latex]. This way we will avoid fraction answers, which are hard to graph precisely.
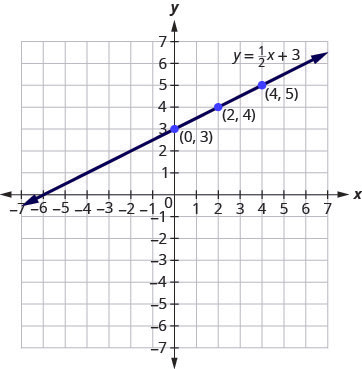
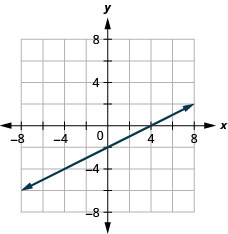
Example 3.9.13
Solution
Step 1: Find three points that are solutions to the equation.
Since this equation has the fraction [latex]\frac{1}{2}[/latex] as a coefficient of [latex]x[/latex], we will choose values of [latex]x[/latex] carefully. We will use zero as one choice and multiples of 2 for the other choices. Why are multiples of 2 a good choice for values of [latex]x[/latex]?
[latex]\begin{align*} x&={\color{blue}{0}}\;\;&x&={\color{blue}{2}}&x&={\color{blue}{4}}\\ y&=\frac12x+3\;\;&y&=\frac12x+3&y&=\frac12x+3\\ y&=\frac12({\color{blue}{0}})+3\;\;&y&=\frac12({\color{blue}{2}})+3\;\;&y&=\frac12({\color{blue}{4}})+3\\ y&=0+3\;\;&y&=1+3\;\;&y&=2+3\\ y&=3\;\;&y&=4\;\;&y&=5 \end{align*}[/latex]
The points are shown in the below table.
| [latex]y=\frac{1}{2}x+3[/latex] | ||
| [latex]x[/latex] | [latex]y[/latex] | [latex](x,y)[/latex] |
| [latex]0[/latex] | [latex]3[/latex] | [latex](0,3)[/latex] |
| [latex]2[/latex] | [latex]4[/latex] | [latex](2,4)[/latex] |
| [latex]4[/latex] | [latex]5[/latex] | [latex](4,5)[/latex] |
Step 2: Plot the points, check that they line up, and draw the line.
Try It
Solution
Solution
So far, all the equations we graphed had [latex]y[/latex] given in terms of [latex]x[/latex]. Now we’ll graph an equation with [latex]x[/latex] and [latex]y[/latex] on the same side. Let’s see what happens in the equation [latex]2x+y=3[/latex]. If [latex]y=0[/latex] what is the value of [latex]x[/latex]?
[latex]\begin{align*}y&={\color{red}{0}}\\ 2x+y&=3\\ 2x+{\color{red}{0}}&=3\\ 2x&=3\\ x&=\frac32\\ &\left(\frac32,0\right) \end{align*}[/latex]
This point has a fraction for the [latex]x[/latex]– coordinate and, while we could graph this point, it is hard to be precise graphing fractions. Remember in the example [latex]y=\frac{1}{2}x+3[/latex], we carefully chose values for [latex]x[/latex] so as not to graph fractions at all. If we solve the equation [latex]2x+y=3[/latex] for [latex]y[/latex], it will be easier to find three solutions to the equation.
The solutions for [latex]x=0[/latex], [latex]x=1[/latex], and [latex]x=-1[/latex] are shown in the below table. The graph is shown in the Figure 3.9.32.
| [latex]2x+y=3[/latex] | ||
| [latex]x[/latex] | [latex]y[/latex] | [latex](x,y)[/latex] |
| [latex]0[/latex] | [latex]3[/latex] | [latex](0,3)[/latex] |
| [latex]1[/latex] | [latex]1[/latex] | [latex](1,1)[/latex] |
| [latex]-1[/latex] | [latex]5[/latex] | [latex](-1,5)[/latex] |
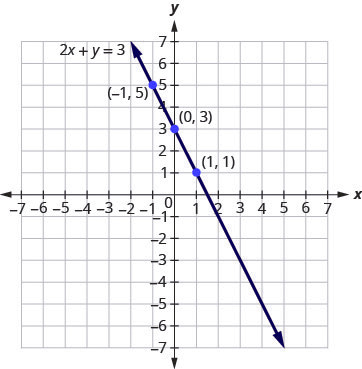
Can you locate the point [latex](\frac{3}{2},0)[/latex], which we found by letting [latex]y=0[/latex], on the line?
Example 3.9.14
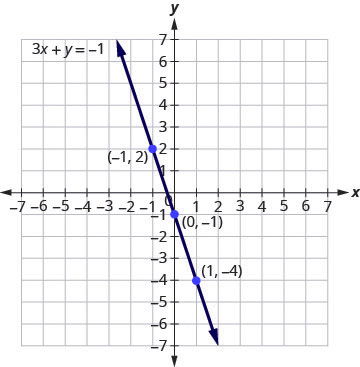
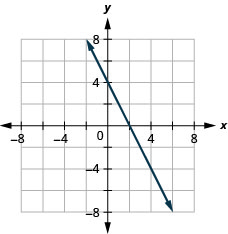
Graph the equation [latex]3x+y=-1[/latex].
Solution
Step 1: Find three points that are solutions to the equation.
[latex]3x+y=-1[/latex]
Step 2: First, solve the equation for [latex]y[/latex].
[latex]y=-3x-1[/latex]
Step 3: We’ll let [latex]x[/latex] be [latex]0[/latex], [latex]1[/latex], and [latex]-1[/latex] to find 3 points.
The ordered pairs are shown in the below table. Plot the points, check that they line up, and draw the line. See Figure 3.9.33.
| [latex]3x+y=-1[/latex] | ||
| [latex]x[/latex] | [latex]y[/latex] | [latex](x,y)[/latex] |
| [latex]0[/latex] | [latex]-1[/latex] | [latex](0,-1)[/latex] |
| [latex]1[/latex] | [latex]-4[/latex] | [latex](1,-4)[/latex] |
| [latex]-1[/latex] | [latex]2[/latex] | [latex](-1,2)[/latex] |
Try It
Solution
34) Graph the equation [latex]4x+y=-3[/latex].
Solution
If you can choose any three points to graph a line, how will you know if your graph matches the one shown in the answers in the book? If the points where the graphs cross the [latex]x[/latex]– and [latex]y[/latex]-axis are the same, the graphs match!
The equation in Example 3.9.14, was written in standard form, with both [latex]x[/latex] and [latex]y[/latex] on the same side. We solved that equation for [latex]y[/latex] in just one step. But for other equations in standard form it is not that easy to solve for [latex]y[/latex], so we will leave them in standard form. We can still find a first point to plot by letting [latex]x=0[/latex] and solving for [latex]y[/latex]. We can plot a second point by letting [latex]y=0[/latex] and then solving for [latex]x[/latex]. Then we will plot a third point by using some other value for [latex]x[/latex] or [latex]y[/latex].
Example 3.9.15
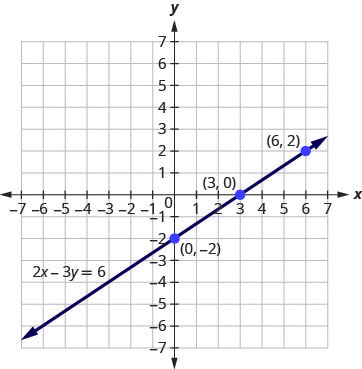
Graph the equation [latex]2x-3y=6[/latex]
Solution
Step 1: Find three points that are solutions to the equation.
[latex]2x-3y =6[/latex]
Step 2: First, let [latex]x=0[/latex].
[latex]2(0)-3y=6[/latex]
Step 3: Solve for [latex]y[/latex].
[latex]\begin{align*}-3y&= 6\\y&=-2\end{align*}[/latex]
Step 4: Now let [latex]y=0[/latex].
[latex]2x-3(0)=6[/latex]
Step 5: Solve for [latex]x[/latex].
[latex]\begin{align*}2x&=6\\x&=3\end{align*}[/latex]
Step 6: We need a third point. Remember, we can choose any value for [latex]x[/latex] or [latex]y[/latex]. We’ll let [latex]x=6[/latex].
[latex]2(6)-3y=6[/latex]
Step 7: Solve for [latex]y[/latex].
[latex]\begin{align*}12-3y&=6\\-3y&=-6\\y&=2\end{align*}[/latex]
We list the ordered pairs in the below table. Plot the points, check that they line up, and draw the line. See Figure 3.9.36
| [latex]2x-3y=6[/latex] | ||
| [latex]x[/latex] | [latex]y[/latex] | [latex](x,y)[/latex] |
| [latex]0[/latex] | [latex]-2[/latex] | [latex](0,-2)[/latex] |
| [latex]3[/latex] | [latex]0[/latex] | [latex](3,0)[/latex] |
| [latex]6[/latex] | [latex]2[/latex] | [latex](6,2)[/latex] |
Try It
35) Graph the equation [latex]4x+2y=8[/latex].
Solution
36) Graph the equation [latex]2x-4y=8[/latex].
Solution
Graph Vertical and Horizontal Lines
Can we graph an equation with only one variable? Just [latex]x[/latex] and no [latex]y[/latex], or just [latex]y[/latex] without an [latex]x[/latex]? How will we make a table of values to get the points to plot?
Let’s consider the equation [latex]x=-3[/latex]. This equation has only one variable, [latex]x[/latex]. The equation says that [latex]x[/latex] is always equal to [latex]-3[/latex], so its value does not depend on [latex]y[/latex]. No matter what [latex]y[/latex] is, the value of [latex]x[/latex] is always [latex]-3[/latex].
So to make a table of values, write [latex]-3[/latex] in for all the [latex]x[/latex] values. Then choose any values for [latex]y[/latex]. Since [latex]x[/latex] does not depend on [latex]y[/latex], you can choose any numbers you like. But to fit the points on our coordinate graph, we’ll use [latex]1[/latex], [latex]2[/latex], and [latex]3[/latex] for the [latex]y[/latex]-coordinates. See the table below.
| [latex]x=-3[/latex] | ||
| [latex]x[/latex] | [latex]y[/latex] | [latex](x,y)[/latex] |
| [latex]-3[/latex] | [latex]1[/latex] | [latex](-3,1)[/latex] |
| [latex]-3[/latex] | [latex]2[/latex] | [latex](-3,2)[/latex] |
| [latex]-3[/latex] | [latex]3[/latex] | [latex](-3,3)[/latex] |
Plot the points from the above table and connect them with a straight line. Notice in Figure 3.9.39 that we have graphed a vertical line.
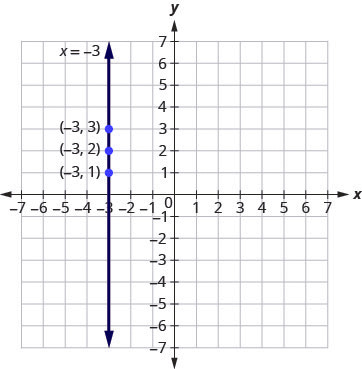
Vertical Line
A vertical line is the graph of an equation of the form [latex]x=a[/latex].
The line passes through the [latex]x[/latex]-axis at [latex](a,0)[/latex].
Example 3.9.16
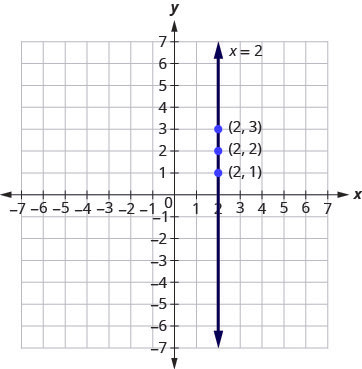
Graph the equation [latex]x=2[/latex].
Solution
The equation has only one variable, [latex]x[/latex], and [latex]x[/latex] is always equal to [latex]2[/latex]. We create the table below where [latex]x[/latex] is always [latex]2[/latex] and then put in any values for [latex]y[/latex]. The graph is a vertical line passing through the [latex]x[/latex]-axis at [latex]2[/latex]. See Figure 3.9.40.
| [latex]x=2[/latex] | ||
| [latex]x[/latex] | [latex]y[/latex] | [latex](x,y)[/latex] |
| [latex]2[/latex] | [latex]1[/latex] | [latex](2,1)[/latex] |
| [latex]2[/latex] | [latex]2[/latex] | [latex](2,2)[/latex] |
| [latex]2[/latex] | [latex]3[/latex] | [latex](2,3)[/latex] |
Try It
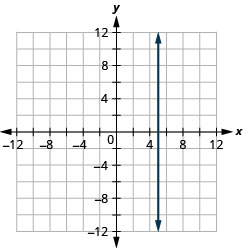
37) Graph the equation [latex]x=5[/latex].
Solution
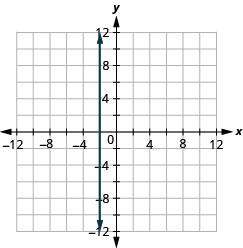
38) Graph the equation [latex]x=-2[/latex].
Solution
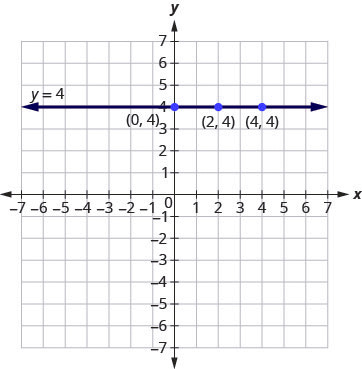
What if the equation has [latex]y[/latex] but no [latex]x[/latex]? Let’s graph the equation [latex]y=4[/latex]. This time the [latex]y[/latex]-value is a constant, so in this equation, [latex]y[/latex] does not depend on [latex]x[/latex]. Fill in [latex]4[/latex] for all the [latex]y[/latex]’s in the below table and then choose any values for [latex]x[/latex]. We’ll use [latex]0[/latex], [latex]2[/latex], and [latex]4[/latex] for the [latex]x[/latex]-coordinates.
| [latex]y=4[/latex] | ||
| [latex]x[/latex] | [latex]y[/latex] | [latex](x,y)[/latex] |
| [latex]0[/latex] | [latex]4[/latex] | [latex](0,4)[/latex] |
| [latex]2[/latex] | [latex]4[/latex] | [latex](2,4)[/latex] |
| [latex]4[/latex] | [latex]4[/latex] | [latex](4,4)[/latex] |
The graph is a horizontal line passing through the [latex]y[/latex]-axis at [latex]4[/latex]. See Figure 3.9.43.
Horizontal Line
A horizontal line is the graph of an equation of the form [latex]y=b[/latex].
The line passes through the [latex]y[/latex]-axis at [latex](0,b)[/latex].
Example 3.9.17
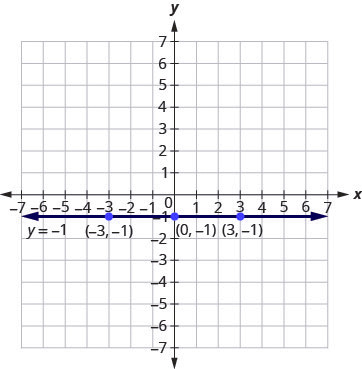
Graph the equation [latex]y=-1[/latex]
Solution
The equation [latex]y=-1[/latex] has only one variable, [latex]y[/latex]. The value of [latex]y[/latex] is constant. All the ordered pairs in the below table have the same [latex]y[/latex]-coordinate. The graph is a horizontal line passing through the [latex]y[/latex]-axis at [latex]-1[/latex], as shown in Figure 3.9.44.
| [latex]y=-1[/latex] | ||
| [latex]x[/latex] | [latex]y[/latex] | [latex](x,y)[/latex] |
| [latex]0[/latex] | [latex]-1[/latex] | [latex](0,-1)[/latex] |
| [latex]3[/latex] | [latex]-1[/latex] | [latex](3,-1)[/latex] |
| [latex]-3[/latex] | [latex]-1[/latex] | [latex](-3,-1)[/latex] |
Try It
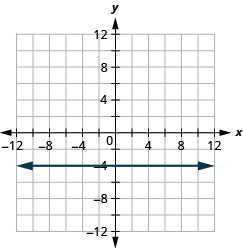
39) Graph the equation [latex]y=-4[/latex].
Solution
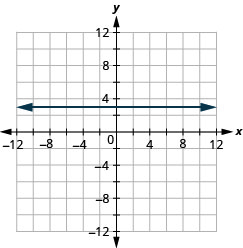
40) Graph the equation [latex]y=3[/latex].
Solution
The equations for vertical and horizontal lines look very similar to equations like [latex]y=4x[/latex]. What is the difference between the equations [latex]y=4x[/latex] and [latex]y=4[/latex]?
The equation [latex]y=4x[/latex] has both [latex]x[/latex] and [latex]y[/latex]. The value of [latex]y[/latex] depends on the value of [latex]x[/latex]. The [latex]y[/latex]-coordinate changes according to the value of [latex]x[/latex]. The equation [latex]y=4[/latex] has only one variable. The value of [latex]y[/latex] is constant. The [latex]y[/latex]-coordinate is always [latex]4[/latex]. It does not depend on the value of [latex]x[/latex]. See the table below.
| [latex]y=4x[/latex] | [latex]y=4[/latex] | |||||
| [latex]x[/latex] | [latex]y[/latex] | [latex](x,y)[/latex] | [latex]x[/latex] | [latex]y[/latex] | [latex](x,y)[/latex] | |
| [latex]0[/latex] | [latex]0[/latex] | [latex](0,0)[/latex] | [latex]0[/latex] | [latex]4[/latex] | [latex](0,4)[/latex] | |
| [latex]1[/latex] | [latex]4[/latex] | [latex](1,4)[/latex] | [latex]1[/latex] | [latex]4[/latex] | [latex](1,4)[/latex] | |
| [latex]2[/latex] | [latex]8[/latex] | [latex](2,8)[/latex] | [latex]2[/latex] | [latex]4[/latex] | [latex](2,4)[/latex] | |
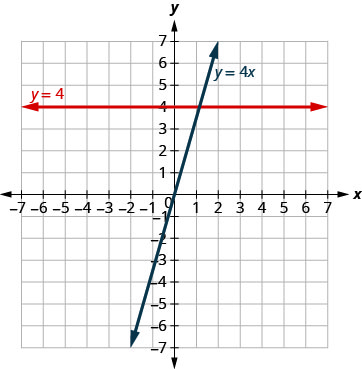
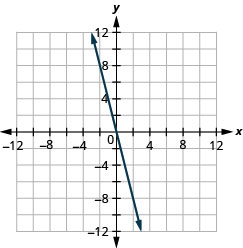
Notice, in Figure 3.9.47, the equation [latex]y=4x[/latex] gives a slanted line, while [latex]y=4[/latex] gives a horizontal line.
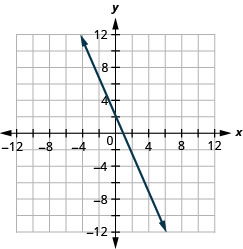
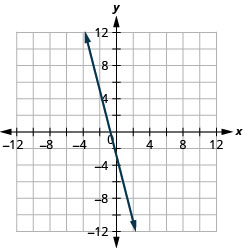
Example 3.9.18
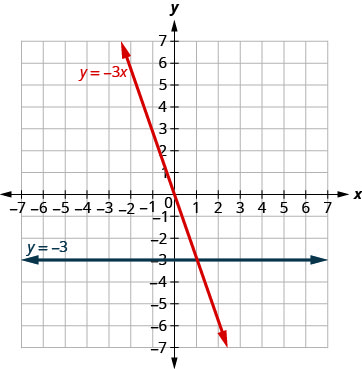
Graph [latex]y=-3x[/latex] and [latex]y=-3[/latex] in the same rectangular coordinate system.
Solution
Notice that the first equation has the variable [latex]x[/latex], while the second does not. See the below table. The two graphs are shown in Figure 3.9.48.
| [latex]y=-3x[/latex] | [latex]y=-3[/latex] | |||||
| [latex]x[/latex] | [latex]y[/latex] | [latex](x,y)[/latex] | [latex]x[/latex] | [latex]y[/latex] | [latex](x,y)[/latex] | |
| [latex]0[/latex] | [latex]0[/latex] | [latex](0,0)[/latex] | [latex]0[/latex] | [latex]-3[/latex] | [latex](0,-3)[/latex] | |
| [latex]1[/latex] | [latex]-3[/latex] | [latex](1,-3)[/latex] | [latex]1[/latex] | [latex]-3[/latex] | [latex](1,-3)[/latex] | |
| [latex]2[/latex] | [latex]-6[/latex] | [latex](2,-6)[/latex] | [latex]2[/latex] | [latex]-3[/latex] | [latex](2,-3)[/latex] | |
Try It
Solution
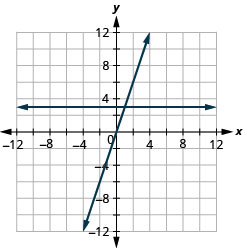
42) Graph [latex]y=3[/latex] and [latex]y=3x[/latex] in the same rectangular coordinate system.
Solution
Intercepts on a Graph
Every linear equation can be represented by a unique line that shows all the solutions of the equation. We have seen that when graphing a line by plotting points, you can use any three solutions to graph. This means that two people graphing the line might use different sets of three points.
At first glance, their two lines might not appear to be the same, since they would have different points labelled. But if all the work was done correctly, the lines should be exactly the same. One way to recognize that they are indeed the same line is to look at where the line crosses the [latex]x[/latex]-axis and the [latex]y[/latex]-axis. These points are called the intercepts of the line.
Intercepts of a Line
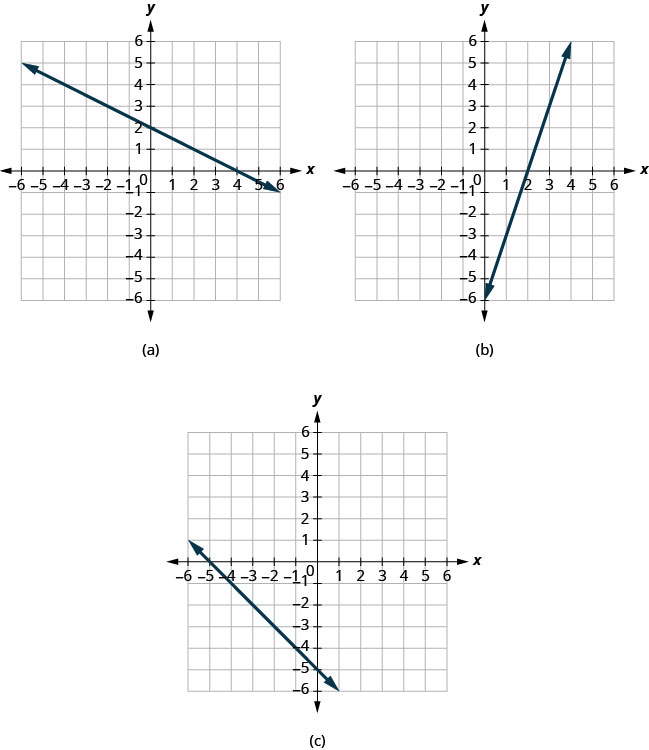
Let’s look at the graphs of the lines in Figure 3.9.51.
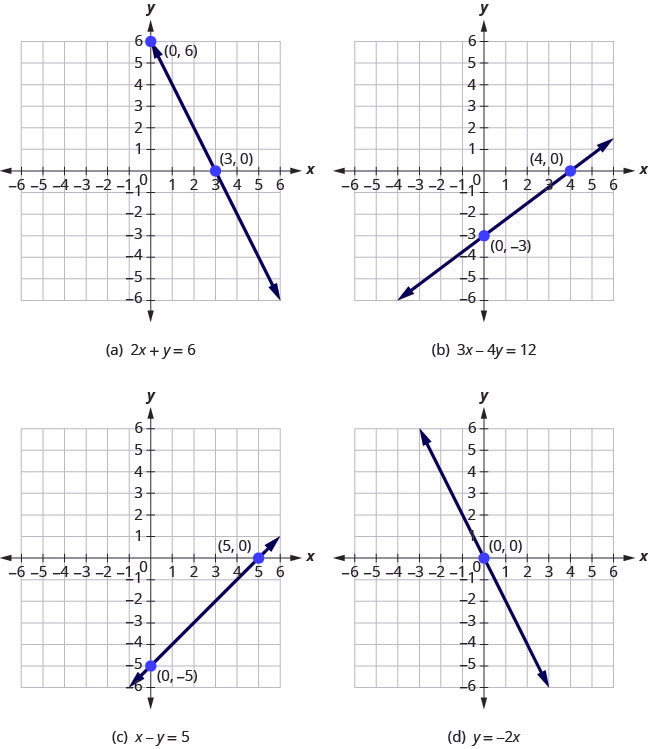
First, notice where each of these lines crosses the [latex]x[/latex] negative axis. See the table below.
| Figure | The line crosses the x-axis at: | Ordered pair of this point |
|---|---|---|
| Figure (a) | [latex]3[/latex] | [latex](3,0)[/latex] |
| Figure (b) | [latex]4[/latex] | [latex](4,0)[/latex] |
| Figure (c) | [latex]5[/latex] | [latex](5,0)[/latex] |
| Figure (d) | [latex]0[/latex] | [latex](0,0)[/latex] |
Do you see a pattern?
For each row, the [latex]y[/latex]-coordinate of the point where the line crosses the [latex]x[/latex]-axis is zero. The point where the line crosses the [latex]x[/latex]-axis has the form [latex](a,0)[/latex] and is called the [latex]x[/latex]-intercept of a line. The [latex]x[/latex]-intercept occurs when [latex]y[/latex] is zero.
Now, let’s look at the points where these lines cross the [latex]y[/latex]-axis. See the table below.
| Figure | The line crosses the y-axis at: | Ordered pair for this point |
|---|---|---|
| Figure (a) | [latex]6[/latex] | [latex](0,6)[/latex] |
| Figure (b) | [latex]-3[/latex] | [latex](0,-3)[/latex] |
| Figure (c) | [latex]-5[/latex] | [latex](0,5)[/latex] |
| Figure (d) | [latex]0[/latex] | [latex](0,0)[/latex] |
What is the pattern here?
In each row, the [latex]x[/latex]-coordinate of the point where the line crosses the [latex]y[/latex]-axis is zero. The point where the line crosses the [latex]y[/latex]-axis has the form [latex]\left(0,b\right)[/latex] and is called the [latex]y[/latex]–intercept of the line. The [latex]y[/latex]-intercept occurs when [latex]x[/latex] is zero.
The [latex]x[/latex]-intercept is the point [latex](a,0)[/latex] where the line crosses the [latex]x[/latex]-axis.
The [latex]y[/latex]-intercept is the point [latex](0,b)[/latex] where the line crosses the [latex]y[/latex]-axis.
| x | y | |
|---|---|---|
| The [latex]x[/latex]-intercept occurs when y is zero. | a | 0 |
| The [latex]y[/latex]-intercept occurs when x is zero | 0 | b |
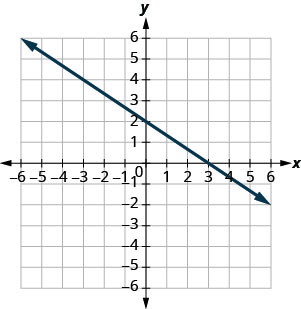
Example 3.9.19
Find the [latex]x[/latex]-intercept and [latex]y[/latex]-intercept on each graph.
Solution
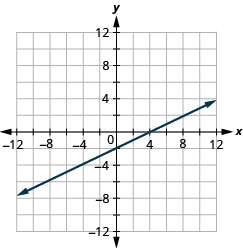
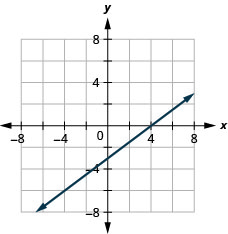
a. The graph crosses the [latex]x[/latex]-axis at the point [latex](4,0)[/latex]. The [latex]x[/latex]-intercept is [latex](4,0)[/latex].
The graph crosses the [latex]y[/latex]-axis at the point [latex](0,2)[/latex]. The [latex]y[/latex]-intercept is [latex](0,2)[/latex].
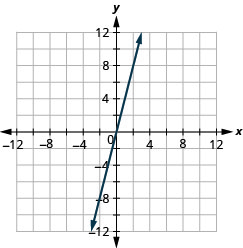
b. The graph crosses the [latex]x[/latex]-axis at the point [latex](2,0)[/latex]. The [latex]x[/latex]-intercept is [latex](2,0)[/latex].
The graph crosses the [latex]y[/latex]-axis at the point [latex](0,-6)[/latex]. The [latex]y[/latex]-intercept is [latex](0,-6)[/latex].
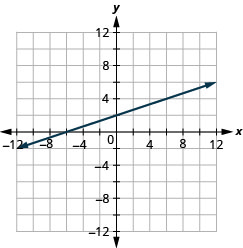
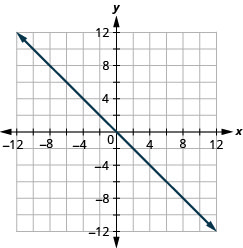
c. The graph crosses the [latex]x[/latex]-axis at the point [latex](-5,0)[/latex]. The [latex]x[/latex]-intercept is [latex](-5,0)[/latex].
The graph crosses the [latex]y[/latex]-axis at the point [latex](0,-5)[/latex]. The [latex]y[/latex]-intercept is [latex](0,-5)[/latex].
Try It
43) Find the [latex]x[/latex]-intercept and [latex]y[/latex]-intercept on the graph.

Solution
[latex]x[/latex]-intercept: [latex](2,0)[/latex]; [latex]y[/latex]-intercept: [latex](0,-2)[/latex]
44) Find the [latex]x[/latex]-intercept and [latex]y[/latex]-intercept on the graph.
Solution
[latex]x[/latex]-intercept: [latex](3,0)[/latex], [latex]y[/latex]-intercept: [latex](0,2)[/latex]
Intercepts from an Equation of a Line
Recognizing that the [latex]x[/latex]-intercept occurs when [latex]y[/latex] is zero and that the [latex]y[/latex]-intercept occurs when [latex]x[/latex] is zero, gives us a method to find the intercepts of a line from its equation. To find the [latex]x[/latex]-intercept, let [latex]y=0[/latex] and solve for [latex]x[/latex]. To find the [latex]y[/latex]-intercept, let [latex]x=0[/latex] and solve for [latex]y[/latex].
Find the [latex]x[/latex]-intercept and [latex]y[/latex]-intercept from the Equation of a Line
Use the equation of the line. To find:
- the [latex]x[/latex]-intercept of the line, let [latex]y=0[/latex] and solve for [latex]x[/latex].
- the [latex]y[/latex]-intercept of the line, let [latex]x=0[/latex] and solve for [latex]y[/latex].
Example 3.9.20
Find the intercepts of [latex]2x+y=6[/latex].
Solution
We will let [latex]y=0[/latex] to find the [latex]x[/latex]-intercept, and let [latex]x=0[/latex] to find the [latex]y[/latex]-intercept. We will fill in the table, which reminds us of what we need to find.
| [latex]2x+y=6[/latex] | ||
| [latex]x[/latex] | [latex]y[/latex] | |
| 0 | [latex]x[/latex]-intercept | |
| 0 | [latex]y[/latex]-intercept | |
To find the [latex]x[/latex]-intercept, let [latex]y=0[/latex].
Step 1: Let [latex]y = 0[/latex].
[latex]\begin{align*}2x+{\color{red}{y}}&=6\\2x\;+\;{\color{red}{0}}&=6\end{align*}[/latex]
Step 2: Simplify.
[latex]\begin{eqnarray*}2x&=&6\\x&=&3\end{eqnarray*}[/latex]
Step 3: The [latex]x[/latex]-intercept is.
[latex](3, 0)[/latex]
Step 4: To find the [latex]y[/latex]-intercept, let [latex]x = 0[/latex].
Step 5: Let [latex]x = 0[/latex].
[latex]\begin{eqnarray*}2{\color{red}{x}}\;+\;\;y\;&=&\;6\\2\;\times\;{\color{red}{0}}\;+\;y\;&=&\;6\end{eqnarray*}[/latex]
Step 6: Simplify.
[latex]\begin{eqnarray*}0\;+\;y\;&=&\;6\\y\;&=&\;6\end{eqnarray*}[/latex]
Step 7: The [latex]y[/latex]-intercept is.
[latex](0, 6)[/latex]
The intercepts are the points [latex](3,0)[/latex] and [latex](0,6)[/latex] as shown in the below table.
| [latex]2x+y=6[/latex] | |
| [latex]x[/latex] | [latex]y[/latex] |
| [latex]3[/latex] | [latex]0[/latex] |
| [latex]0[/latex] | [latex]6[/latex] |
Try It
45) Find the intercepts of [latex]3x+y=12[/latex].
Solution
[latex]x[/latex]-intercept: [latex](4,0)[/latex], [latex]y[/latex]-intercept: [latex](0,12)[/latex]
46) Find the intercepts of [latex]x+4y=8[/latex].
Solution
[latex]x[/latex]-intercept: [latex](8,0)[/latex], [latex]y[/latex]-intercept: [latex](0,2)[/latex]
Example 3.9.21
Find the intercepts of [latex]4x–3y=12[/latex].
Solution
Step 1: To find the [latex]x[/latex]-intercept, let [latex]y = 0[/latex].
[latex]\begin{align*}4x\;-\;3{\color{red}{y}}&=12\\4x\;-\;3\;\times\;({\color{red}{0}})&=12\end{align*}[/latex]
Step 3: Simplify.
[latex]\begin{eqnarray*}4x\;-\;0\;&=&\;12\\4x\;&=&\;12\\x\;&=&\;3\end{eqnarray*}[/latex]
Step 4: The [latex]x[/latex]-intercept is:
[latex](3, 0)[/latex]
Step 5: To find the [latex]y[/latex]-intercept, let [latex]x = 0[/latex].
Step 6: Let [latex]x = 0[/latex].
[latex]\begin{align*}4{\color{red}{x}}-3y&=12\\4\;\times\;{\color{red}{0}}\;-\;3y&=12\end{align*}[/latex]
Step 7: Simplify.
[latex]\begin{eqnarray*}0\;-\;3y\;&=&\;12\\-3y\;&=&\;12\\y\;&=&\;-4\end{eqnarray*}[/latex]
Step 8: The [latex]y[/latex]-intercept is:
[latex](0, −4)[/latex]
The intercepts are the points [latex](3, 0)[/latex] and [latex](0, −4)[/latex] as shown in the following table.
| [latex]4x-3y=12[/latex] | |
| [latex]x[/latex] | [latex]y[/latex] |
| [latex]3[/latex] | [latex]0[/latex] |
| [latex]0[/latex] | [latex]-4[/latex] |
Try It
47) Find the intercepts of [latex]3x–4y=12[/latex].
Solution
[latex]x[/latex]-intercept: [latex](4,0)[/latex], [latex]y[/latex]-intercept: [latex](0,-3)[/latex]
48) Find the intercepts of [latex]2x–4y=8[/latex].
Solution
[latex]x[/latex]-intercept: [latex](4,0)[/latex], [latex]y[/latex]-intercept: [latex](0,-2)[/latex]
Graph a Line Using the Intercepts
To graph a linear equation by plotting points, you need to find three points whose coordinates are solutions to the equation. You can use the x-intercept and [latex]y[/latex]-intercept as two of your three points. Find the intercepts, and then find a third point to ensure accuracy. Make sure the points line up—then draw the line. This method is often the quickest way to graph a line.
Example 3.9.22
Graph [latex]–x+2y=6[/latex] using the intercepts.
Solution
Step 1: Find the [latex]x[/latex]– and [latex]y[/latex]-intercepts of the line.
Let [latex]y=0[/latex] and solve for [latex]x[/latex].
Let [latex]x=0[/latex] and solve for [latex]y[/latex].
Find the [latex]x[/latex]-intercept.
[latex]\begin{align*}\text{Let}\;y&=0\\ -x+2y&=6\\ -x+2({\color{red}{0}})&=6\\ -x&=6\\ x&=6\\ \text{The x-intercept is (-6,0).}\end{align*}[/latex]
Find the [latex]y[/latex]-intercept.
[latex]\begin{align*}\text{Let}\;x&=0\\ -x+2y&=6\\ -{\color{red}{0}}+2y&=6\\ 2y&=6\\ y&=3\\ \text{The y-intercept is (0,3).} \end{align*}[/latex]
Step 2: Find another solution to the equation.
We’ll use [latex]x=2[/latex].
[latex]\begin{align*}\text{Let}\;x&=2\\ -x+2y&=6\\ -{\color{red}{2}}+2y&=6\\ 2y&=8\\ y&=4\\ \text{A third point is (2,4).} \end{align*}[/latex]
Step 3: Plot the three points.
Check that the points line up.
| [latex]x[/latex] | [latex]y[/latex] | [latex](x,y)[/latex] |
|---|---|---|
| -6 | 0 | (-6,0) |
| 0 | 3 | (0,3) |
| 2 | 4 | (2,4) |
Step 4: Draw the line.
See the graph.
Try It
49) Graph [latex]x–2y=4[/latex] using the intercepts.
Solution
50) Graph [latex]–x+3y=6[/latex] using the intercepts.
Solution
HOW TO
Graph a linear equation using the intercepts.
The steps to graph a linear equation using the intercepts are summarized below.
- Find the [latex]x[/latex]-intercept and [latex]y[/latex]-intercept of the line.
- Let [latex]y=0[/latex] and solve for [latex]x[/latex].
- Let [latex]x=0[/latex] and solve for [latex]y[/latex].
- Find a third solution to the equation.
- Plot the three points and check that they line up.
- Draw the line.
Example 3.9.23
Graph [latex]4x–3y=12[/latex] using the intercepts.
Solution
[latex]\begin{align*} \text{x-intercept, let}\;&y=0\;&\text{y-intercept, let}\;x&=0\;&\text{third point, let}\;y&=4\\ 4x-3y&=12\;\;&4x-3y&=12&4x-3y&=12\\ 4x-3({\color{red}{0}})&=12\;\;&4({\color{red}{0}})-3y&=12&4x-3({\color{red}{4}})&=12\\ 4x&=12\;\;&-3y&=12&4x-12&=12\\ x&=3\;\;&y&=-4\;\;&4x&=24\\ \;&\;\;&\;&\;\;&x&=6 \end{align*}[/latex]
Find the intercepts and a third point. We list the points in the table below and show the graph below.
| [latex]4x-3y=12[/latex] | ||
| [latex]x[/latex] | [latex]y[/latex] | [latex](x,y)[/latex] |
| [latex]3[/latex] | [latex]0[/latex] | [latex](3,0)[/latex] |
| [latex]0[/latex] | [latex]-4[/latex] | [latex](0,-4)[/latex] |
| [latex]6[/latex] | [latex]4[/latex] | [latex](6,4)[/latex] |
Try It
51) Graph [latex]5x–2y=10[/latex] using the intercepts.
Solution
52) Graph [latex]3x–4y=12[/latex] using the intercepts.
Solution
Example 3.9.24
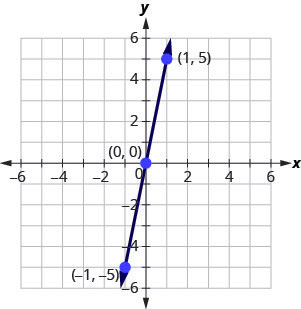
Graph [latex]y=5x[/latex] using the intercepts.
Solution
Step 1: Find the [latex]x[/latex]– and [latex]y[/latex]-intercepts of the line.
[latex]\begin{align*} \text{x-intercept}&\;&\text{y-intercept}\\ \text{Let}\;y&=0\;&\text{Let}\;x&=0\\ y&=5x\;\;&y&=5x\\ {\color{red}{0}}&=5x\;\;&y&=5\cdot{\color{red}{0}}\\ 0&=x\;\;&y&=0\\ (0,&0)\;&\;&(0,0) \end{align*}[/latex]
This line has only one intercept. It is the point [latex](0,0)[/latex].
Step 2: To ensure accuracy we need to plot three points. Since the [latex]x[/latex]-intercept and [latex]y[/latex]-intercept are the same point, we need two more points to graph the line.
[latex]\begin{align*} \text{Let}\;x&=1\;&\text{Let}\;x&=-1\\ y&=5x\;\;&y&=5x\\ y&=5\cdot({\color{red}{1}})\;\;&y&=5({\color{red}{-1}})\\ y&=5\;\;&y&=-5\\ \end{align*}[/latex]
See table below.
| [latex]y=5x[/latex] | ||
| [latex]x[/latex] | [latex]y[/latex] | [latex](x,y)[/latex] |
| [latex]0[/latex] | [latex]0[/latex] | [latex](0,0)[/latex] |
| [latex]1[/latex] | [latex]5[/latex] | [latex](1,5)[/latex] |
| [latex]-1[/latex] | [latex]-5[/latex] | [latex](-1,-5)[/latex] |
Step 3: Plot the three points, check that they line up, and draw the line.
Try It
53) Graph [latex]y=4x[/latex] using the intercepts.
Solution
54) Graph [latex]y=-x[/latex] the intercepts.
Solution
Key Concepts
- Sign Patterns of the Quadrants
| Quadrant I | Quadrant II | Quadrant III | Quadrant IV |
|---|---|---|---|
| [latex](x,y)[/latex] | [latex](x,y)[/latex] | [latex](x,y)[/latex] | [latex](x,y)[/latex] |
| [latex](+,+)[/latex] | [latex](-,+)[/latex] | [latex](-,-)[/latex] | [latex](+,-)[/latex] |
- Points on the Axes
- On the [latex]x[/latex]-axis, [latex]y=0[/latex]. Points with a [latex]y[/latex]-coordinate equal to [latex]0[/latex] are on the [latex]x[/latex]-axis, and have coordinates [latex](a,0)[/latex].
- On the [latex]y[/latex]-axis, [latex]x=0[/latex]. Points with an [latex]x[/latex]-coordinate equal to [latex]0[/latex] are on the [latex]y[/latex]-axis, and have coordinates [latex](0,b)[/latex].
- Solution of a Linear Equation
- An ordered pair [latex](x,y)[/latex] is a solution of the linear equation [latex]Ax\;+\;By\;=\;C[/latex], if the equation is a true statement when the [latex]x[/latex] and [latex]y[/latex] values of the ordered pair are substituted into the equation.
- Graph a Linear Equation by Plotting Points
- Find three points whose coordinates are solutions to the equation. Organize them in a table.
- Plot the points in a rectangular coordinate system. Check that the points line up. If they do not, carefully check your work!
- Draw the line through the three points. Extend the line to fill the grid and put arrows on both ends of the line.
- Find the x-intercept and y-Intercept from the Equation of a Line
- Use the equation of the line to find the [latex]x[/latex]-intercept of the line, let [latex]y=0[/latex] and solve for [latex]x[/latex].
- Use the equation of the line to find the [latex]y[/latex]-intercept of the line, let [latex]x=0[/latex] and solve for [latex]y[/latex].
- Graph a Linear Equation using the Intercepts
- Find the [latex]x[/latex]-intercept and [latex]y[/latex]-intercept of the line.
Let [latex]y=0[/latex] and solve for [latex]x[/latex].
Let [latex]x=0[/latex] and solve for [latex]y[/latex]. - Find a third solution to the equation.
- Plot the three points and then check that they line up.
- Draw the line.
- Find the [latex]x[/latex]-intercept and [latex]y[/latex]-intercept of the line.
- Strategy for Choosing the Most Convenient Method to Graph a Line:
- Consider the form of the equation.
- If it only has one variable, it is a vertical or horizontal line.
[latex]x=a[/latex] is a vertical line passing through the [latex]x[/latex]-axis at [latex]a[/latex].
[latex]y=b[/latex] is a horizontal line passing through the [latex]y[/latex]-axis at [latex]b[/latex]. - If [latex]y[/latex] is isolated on one side of the equation, graph by plotting points.
- Choose any three values for [latex]x[/latex] and then solve for the corresponding [latex]y[/latex]-values.
- If the equation is of the form [latex]Ax\;+\;By\;=\;C[/latex], find the intercepts. Find the [latex]x[/latex]-intercept and [latex]y[/latex]-intercept, then a third point.
Self Check
After completing the exercises, use this checklist to evaluate your mastery of the objectives of this section.
After reviewing this checklist, what will you do to become confident for all goals?
Glossary
- linear equation
- A linear equation is of the form [latex]Ax\;+\;By\;=\;C[/latex], where [latex]A[/latex] and [latex]B[/latex] are not both zero, is called a linear equation in two variables.
- ordered pair
- An ordered pair [latex](x,y)[/latex] gives the coordinates of a point in a rectangular coordinate system.
- origin
- The point [latex](0,0)[/latex] is called the origin. It is the point where the [latex]x[/latex]-axis and [latex]y[/latex]-axis intersect.
- quadrant
- The [latex]x[/latex]-axis and the [latex]y[/latex]-axis divide a plane into four regions, called quadrants.
- rectangular coordinate system
- A grid system is used in algebra to show a relationship between two variables; also called the [latex]xy[/latex]-plane or the ‘coordinate plane’.
- x-coordinate
- The first number in an ordered pair [latex](x,y)[/latex].
- y-coordinate
- The second number in an ordered pair [latex](x,y)[/latex].
- graph of a linear equation
- The graph of a linear equation [latex]Ax\;+\;By\;=\;C[/latex] is a straight line. Every point on the line is a solution of the equation. Every solution of this equation is a point on this line.
- horizontal line
- A horizontal line is the graph of an equation of the form [latex]y=b[/latex]. The line passes through the [latex]y[/latex]-axis at [latex](0,b)[/latex].
- vertical line
- A vertical line is the graph of an equation of the form [latex]x=a[/latex]. The line passes through the [latex]x[/latex]-axis at [latex](a,0)[/latex].
- intercepts of a line
- The points where a line crosses the [latex]x[/latex]-axis and the [latex]y[/latex]-axis are called the intercepts of the line.
- x-intercept
- The point [latex](a,0)[/latex] where the line crosses the [latex]x[/latex]-axis; the [latex]x[/latex]–intercept occurs when [latex]y[/latex] is zero.
- y-intercept
- The point [latex](0,b)[/latex] where the line crosses the [latex]y[/latex]-axis; the [latex]y[/latex]-intercept occurs when [latex]x[/latex] is zero.
A grid system is used in algebra to show a relationship between two variables; also called the xy-plane or the ‘coordinate plane’.
The x-axis and the y-axis divide a plane into four regions, called quadrants.
An ordered pair (x,y) gives the coordinates of a point in a rectangular coordinate system.
The first number in an ordered pair (x,y).
The second number in an ordered pair (x,y)
The origin is the point labeled 0 on a number line.
A vertical line is the graph of an equation of the form x=a. The line passes through the x-axis at (a,0).
A horizontal line is the graph of an equation of the form y=b. The line passes through the y-axis at (0,b).
A linear equation is of the form Ax+By=C, where A and B are not both zero, is called a linear equation in two variables.
The graph of a linear equation Ax+By=C is a straight line. Every point on the line is a solution of the equation. Every solution of this equation is a point on this line.
The points where a line crosses the x- axis and the y- axis are called the intercepts of the line
The point (a,0) where the line crosses the x- axis; the x- intercept occurs when y is zero.
The point (0,b) where the line crosses the y- axis; the y- intercept occurs when x is zero.
