8.6 Patient-Ventilator Interaction & Graphic Representation of Ventilation
When monitoring patient-ventilator interaction, beginning with ventilation parameters appears to be a straightforward and universally adopted practice across all ventilators currently in use. The following table presents a list of common ventilation parameters that provide clinicians with valuable insights into how the patient responds to the ventilator.
|
Ventilatory Parameters |
Respiratory Rate |
Average Normal Value |
|---|---|---|
| [latex]\text{Lung Volume}[/latex] |
[latex]\text{Tidal Volume}[/latex]
|
[latex]\text{5 - 6 mL/Kg}[/latex]
|
|
[latex]V_D/V_T[/latex]
|
[latex]20\text{ - }40\%[/latex]
|
|
|
[latex]\text{I:E}[/latex]
|
[latex]\text{1:2}[/latex]
|
|
| [latex]\text{Airway pressures}[/latex] |
[latex]P_{peak}[/latex]
|
[latex]<35\text{ cmH}_2\text{O}[/latex]
|
|
[latex]P_{plateau}[/latex]
|
[latex]<30\text{ cmH}_2\text{O}[/latex]
|
|
|
[latex]\Delta P\text{ (driving pressure)}[/latex]
|
[latex]<15\text{ cmH}_2\text{O}[/latex]
|
|
|
[latex]\text{PEEP and auto-PEEP}[/latex]
|
[latex]\text{Based on patient requirements}[/latex]
|
|
| [latex]\text{Lung mechanics}[/latex] |
[latex]\text{Compliance}[/latex]
|
[latex]\text{50 - 100 mL/cmH}_2\text{O}[/latex]
|
|
[latex]\text{Resistance}[/latex]
|
[latex]\text{0.5 - 2.5 L/cmH}_2\text{O/s (up to 6 cmH}_2\text{O/L/s)}[/latex]
|
Patient-ventilator asynchrony is a significant concern in critically ill patients receiving mechanical ventilation. It can prolong mechanical ventilation, increase the risk of complications, and contribute to patient discomfort and distress. Close monitoring, adjustment of ventilator settings, and consideration of patient-specific factors are essential in minimizing asynchrony and optimizing patient-ventilator interaction. Asynchrony is sometimes obvious, as it causes patient discomfort, and other times it can be very subtle and difficult to notice.
Patient-ventilator asynchrony refers to a mismatch or lack of coordination between the patient’s respiratory effort and the assistance provided by a mechanical ventilator. It occurs when the timing, flow, or volume of the ventilator’s assistance does not align properly with the patient’s own breathing patterns and needs. This lack of synchronization can result in discomfort for the patient, compromised ventilation, and potential complications. The most common methods of detecting asynchrony is analyzing the ventilator graphics.
Types of Asynchrony
1. Trigger Asynchrony
Trigger asynchrony occurs when the ventilator fails to detect the patient’s effort to initiate a breath, or when the patient initiates a breath at a different time than the ventilator is delivering a breath. This lack of coordination can result in discomfort for the patient, increased work of breathing, and may affect the effectiveness of mechanical ventilation.
Key Takeaway
To minimize trigger asynchrony, the sensitivity settings must be set appropriately.
When the ventilator is not sensitive enough to patient effort, it results in increased work of breathing and potentially missed breath as the ventilator will not recognize patient effort. This is known as missed trigger asynchrony. Watch this brief video to better visualize missed trigger asynchrony.
Auto triggering, also known as auto-cycling or self-cycling, is a phenomenon that can occur during mechanical ventilation where the ventilator is triggered to deliver a breath even when the patient has not initiated any respiratory effort. In other words, the ventilator senses a “false” respiratory effort and delivers a breath even though the patient did not intend to take one.
Auto triggering can happen due to various reasons, including:
- Sensitivity Settings: If the sensitivity of the ventilator’s trigger is set too low, it may interpret non-respiratory signals (e.g., patient movement, cardiac oscillations) as spontaneous breaths and initiate a mechanical breath.
- Circuit or Tubing Movement: Movement or vibrations in the ventilator circuit, tubing, or connections can be misinterpreted as patient respiratory efforts by the ventilator.
- Airway Secretions or Water: Presence of excessive secretions or water in the airway can stimulate the ventilator’s trigger, leading to auto triggering.
- Patient-ventilator Interaction: In some cases, the patient’s breathing pattern may become unintentionally synchronized with the ventilator’s settings, causing auto triggering.
Auto triggering can be detrimental to the patient because it can lead to excessive ventilation, which may cause discomfort, worsen lung injury, or induce respiratory alkalosis. Additionally, it can lead to asynchrony between the patient and the ventilator, affecting the effectiveness of mechanical ventilation and potentially increasing the patient’s work of breathing.
To prevent auto triggering, clinicians need to carefully adjust the ventilator settings, particularly the sensitivity level of the trigger, to ensure that it responds only to the patient’s true respiratory efforts. Regular monitoring and assessment of the patient-ventilator interaction are essential to identify and address any auto triggering issues promptly. Ensuring proper sedation and analgesia for the patient can also help reduce the risk of auto triggering and improve overall patient comfort during mechanical ventilation. Watch this brief video to better visualize auto triggering.
Double Trigger Asynchrony
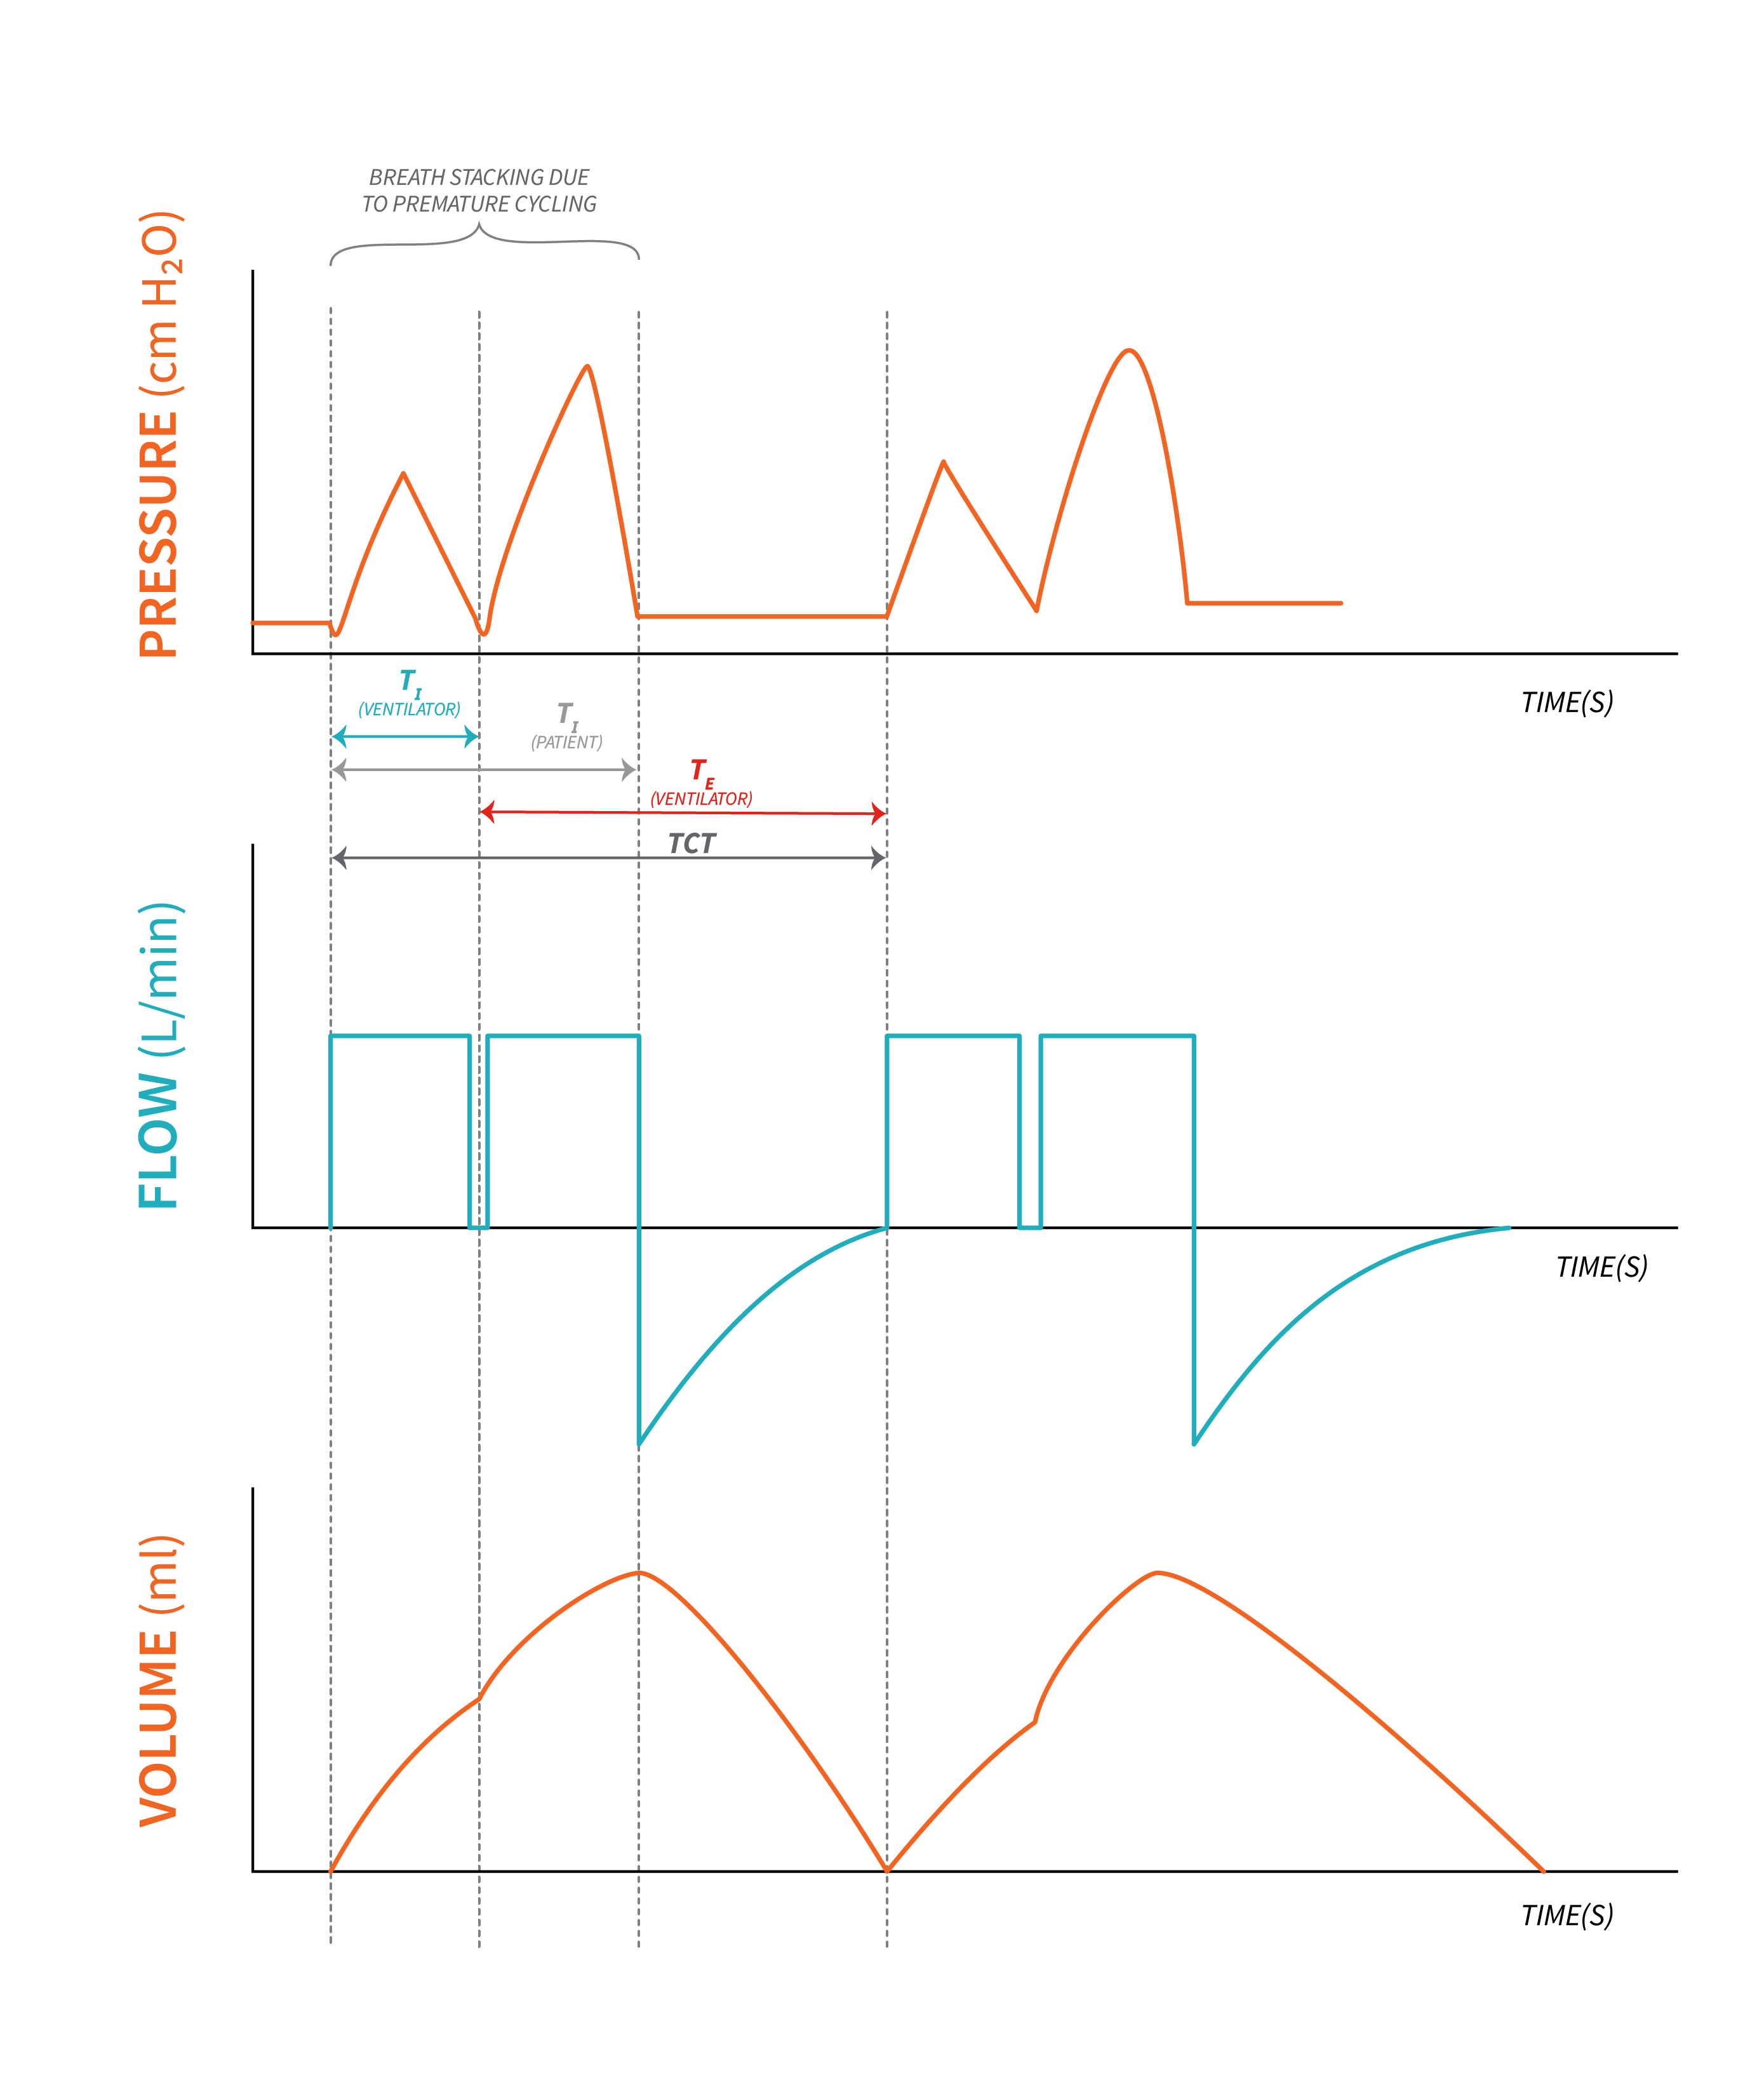
Double-triggering, also known as breath-stacking, refers to a distinctive pattern where the patient triggers two consecutive ventilator breaths and the expiratory time between them is less than half of the mean inspiratory time. This second triggering or breath stacking is often caused by a mismatch between the set inspiratory time and the patient’s desired inspiratory time, which can be described as cycle asynchrony. Watch this brief video to better visualize double triggering.
2. Cycle Asynchrony
As we recall from chapter 2, the Cycle variable plays a crucial role in determining the opening of the exhalation valve and concluding the inspiration phase. Cycle asynchrony arises when there is a disparity between the inspiratory time of the ventilator and that of the patient. For example, if the inspiratory time set on the ventilator is shorter than what the patient requires (patient’s desired [latex]T_i[/latex]), it leads to a cycle asynchrony, resembling double triggering (this is sometimes called premature cycling).
Let’s take a look at the diagram below for a better understanding: during ventilation, the ventilator-set [latex]T_i[/latex] concludes, but the patient’s inspiratory muscles are still contracting, resulting in a drop in pressure. Should this drop in pressure reach the trigger sensitivity level, it will prompt the ventilator to deliver another breath, causing the appearance of double triggering.
When the set inspiratory time is longer than the patient’s desired inspiratory time, the patient may instinctively attempt to exhale, resulting in an increase in pressure within the ventilator circuit. This increased pressure can reach the upper limit, triggering an audible alarm (this is sometimes called delayed cycling).
3. Flow Asynchrony
This type of asynchrony occurs mostly during ventilation modes where flow is set inadequately or on patients with high inspiratory flow demand. However, it can be seen in pressure control modes where inspiratory rise time is inadequate for the patient. Flow asynchrony can be corrected either by increasing flow in volume control ventilation or adjusting the rise time in pressure control ventilation. Watch this video explanation of flow asynchrony.
4. Mode asynchrony
It goes without saying that selecting an inappropriate ventilation mode for a particular patient can lead to discomfort and increased work of breathing. If mode asynchrony goes unnoticed, it can often result in unnecessary over-sedation as clinicians may misinterpret the patient’s attempt to synchronize with the ventilator as resistance or “fighting” against it. This over-sedation, in turn, prolongs the time the patient spends on the ventilator, giving rise to complications associated with extended ventilation.
To prevent mode asynchrony and its potential consequences, it is crucial to regularly assess patients for signs of spontaneous breathing and opportunities for weaning and liberation from mechanical ventilation. By proactively monitoring and addressing any asynchrony, we can optimize patient comfort, enhance the weaning process, and minimize complications related to prolonged ventilation duration.
Ventilation Graphics – Loops
Until now, our primary focus has been on monitoring ventilation graphics represented through waveforms or scalars, such as pressure-time, flow-time, and volume-time graphs. However, it’s important to highlight that all ventilators are equipped with the ability to display pressure-volume or flow-volume loops, which offer invaluable insights into patient-ventilator interaction. These loops, also known as curves, serve as useful tools providing essential information that helps us better understand and optimize the dynamics between the patient and the ventilator, specifically the patient’s lung mechanics.
The Pressure-Volume Loop
First, let’s identify the type of breath on a pressure-volume loop (PV loop).
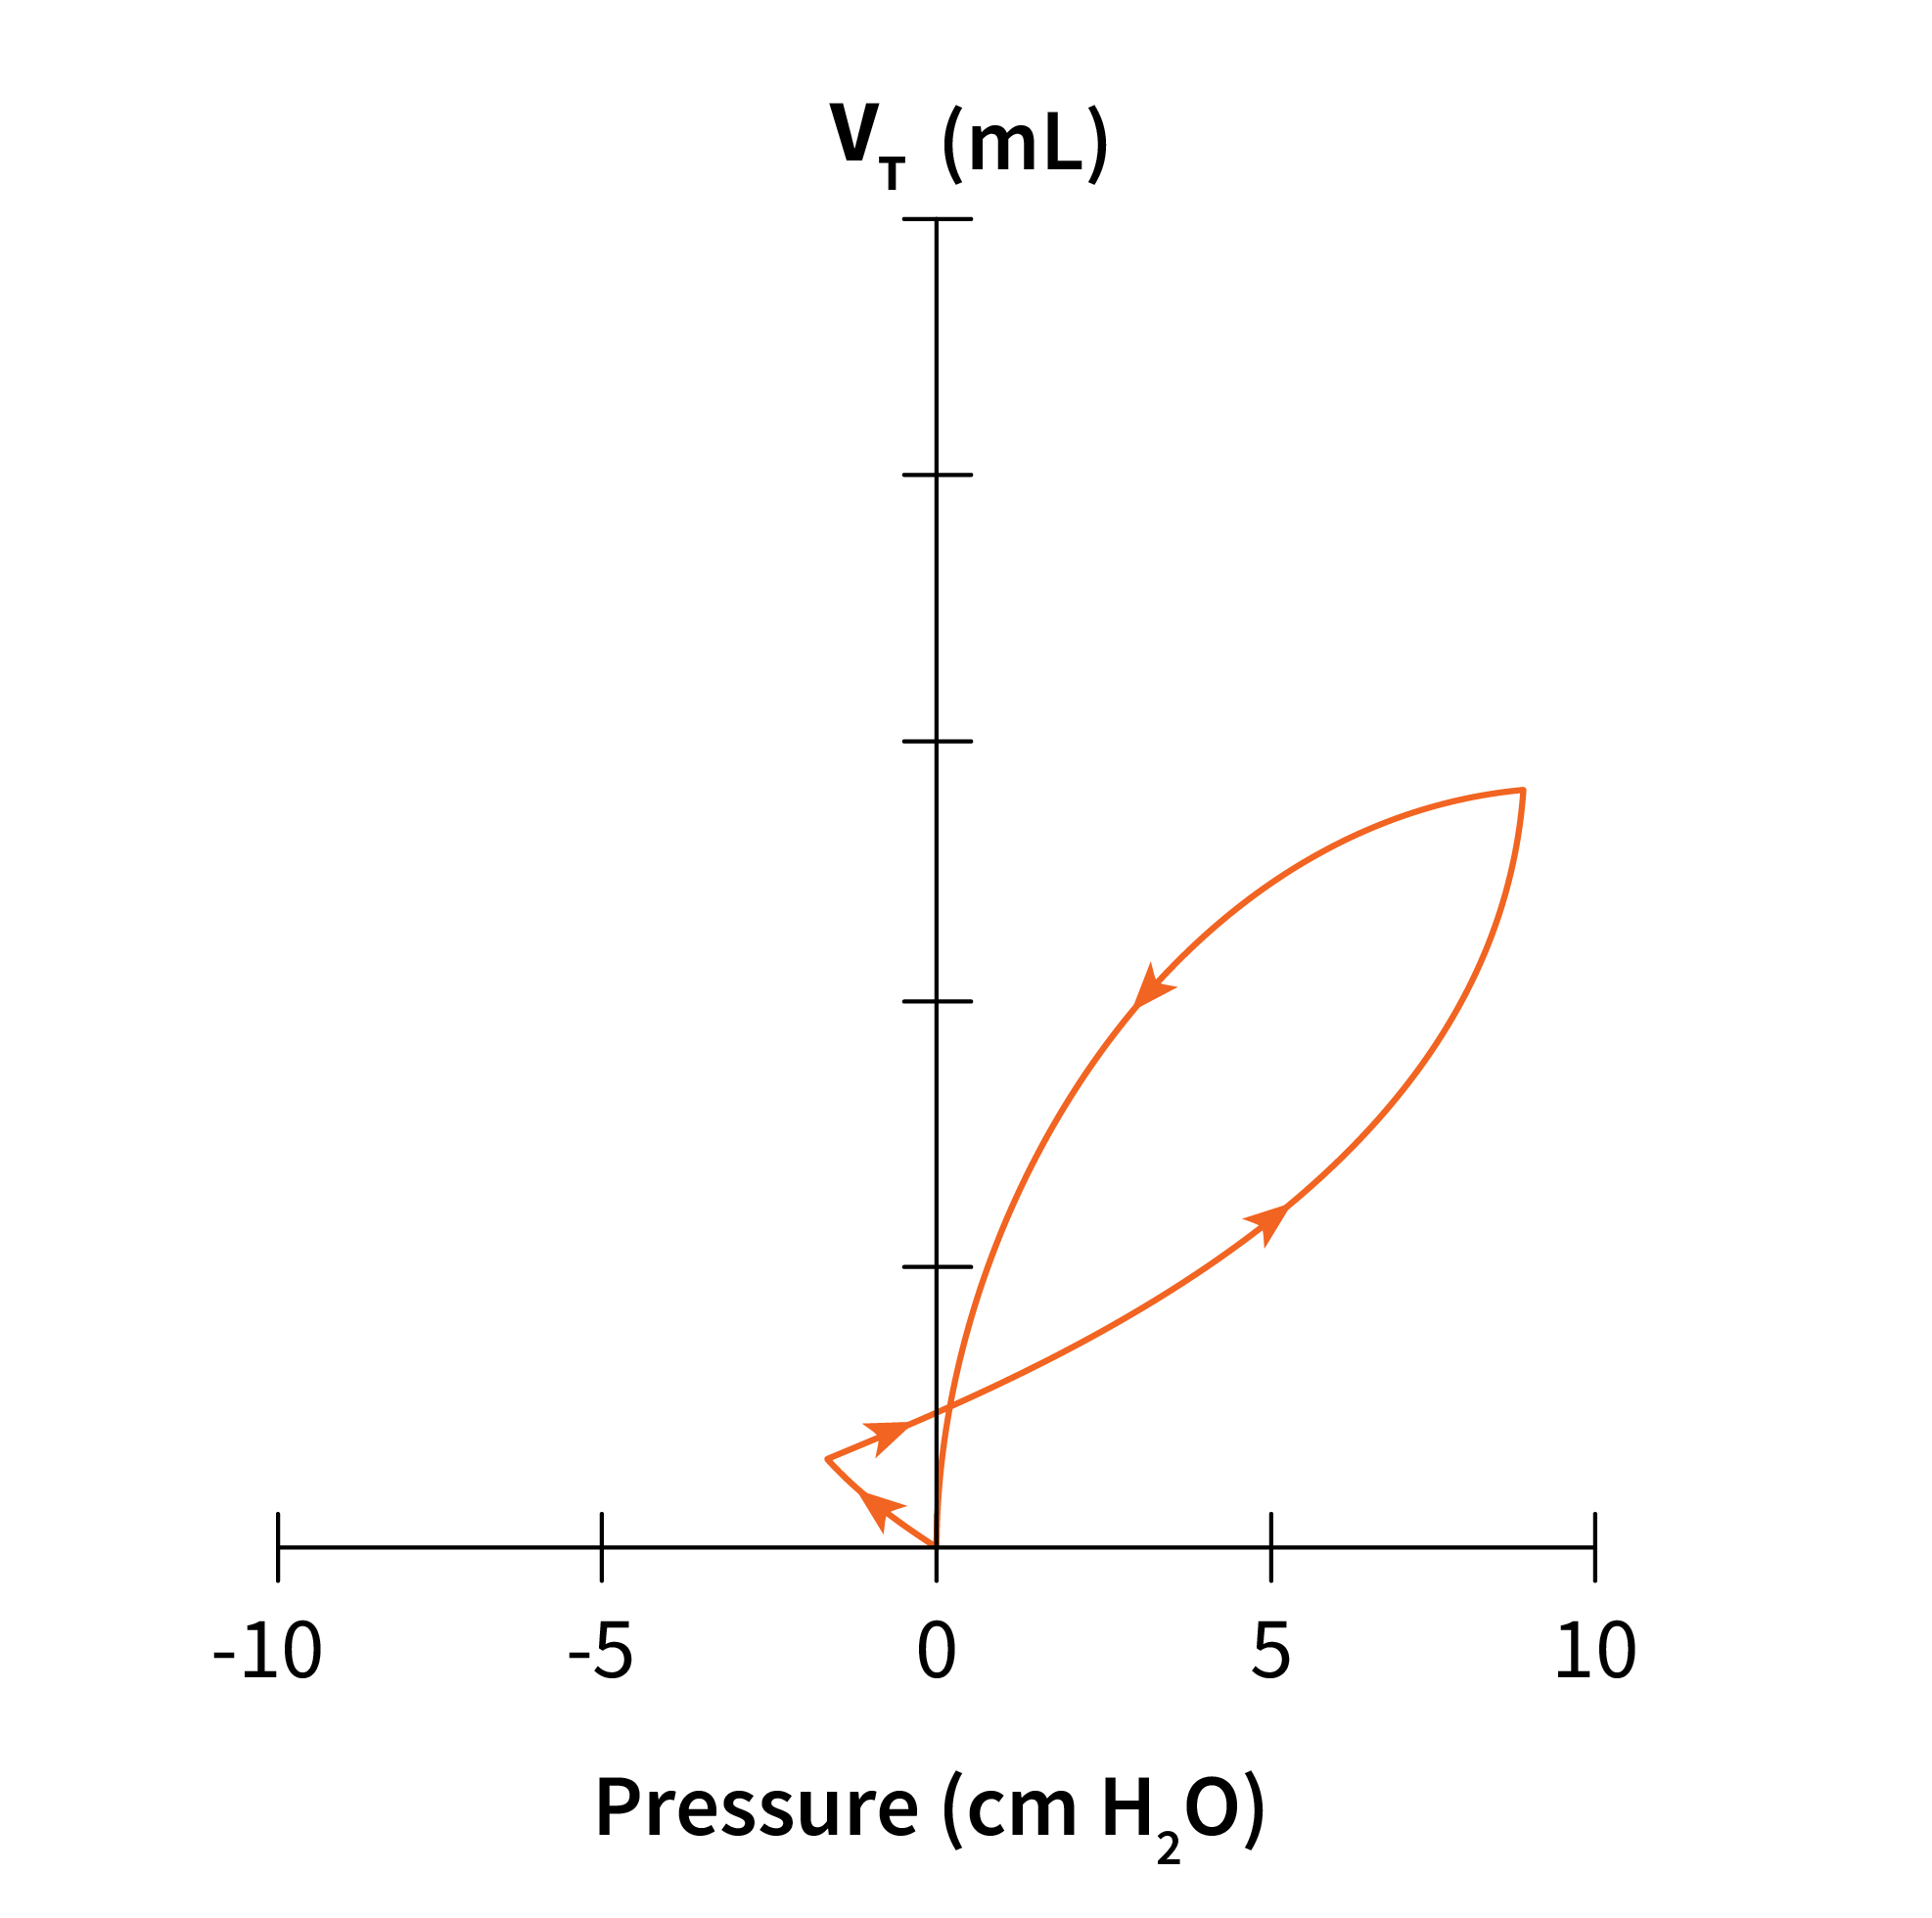
A PV loop is drawn in a counterclockwise direction for a controlled PPV breath and in a clockwise direction for spontaneous breaths. Compare the three diagrams below from a controlled breath (Figure 8.6.2) and a spontaneous breath (Figure 8.6.3). An assisted breath (seen in Figure 8.6.4) will look like a combination of a spontaneous and a controlled breath (Figure 8.6.2 and Figure 8.6.3). The breath starts with a patient effort (spontaneous), with the flow moving in the direction of a spontaneous breath (clockwise direction) followed quickly by a change in direction of flow, counterclockwise, as the ventilator takes over.
 |
 |
 |
Now, let’s review the components of a pressure-volume loop (PV loop) on a volume controlled breath with constant flow for a healthy lung.
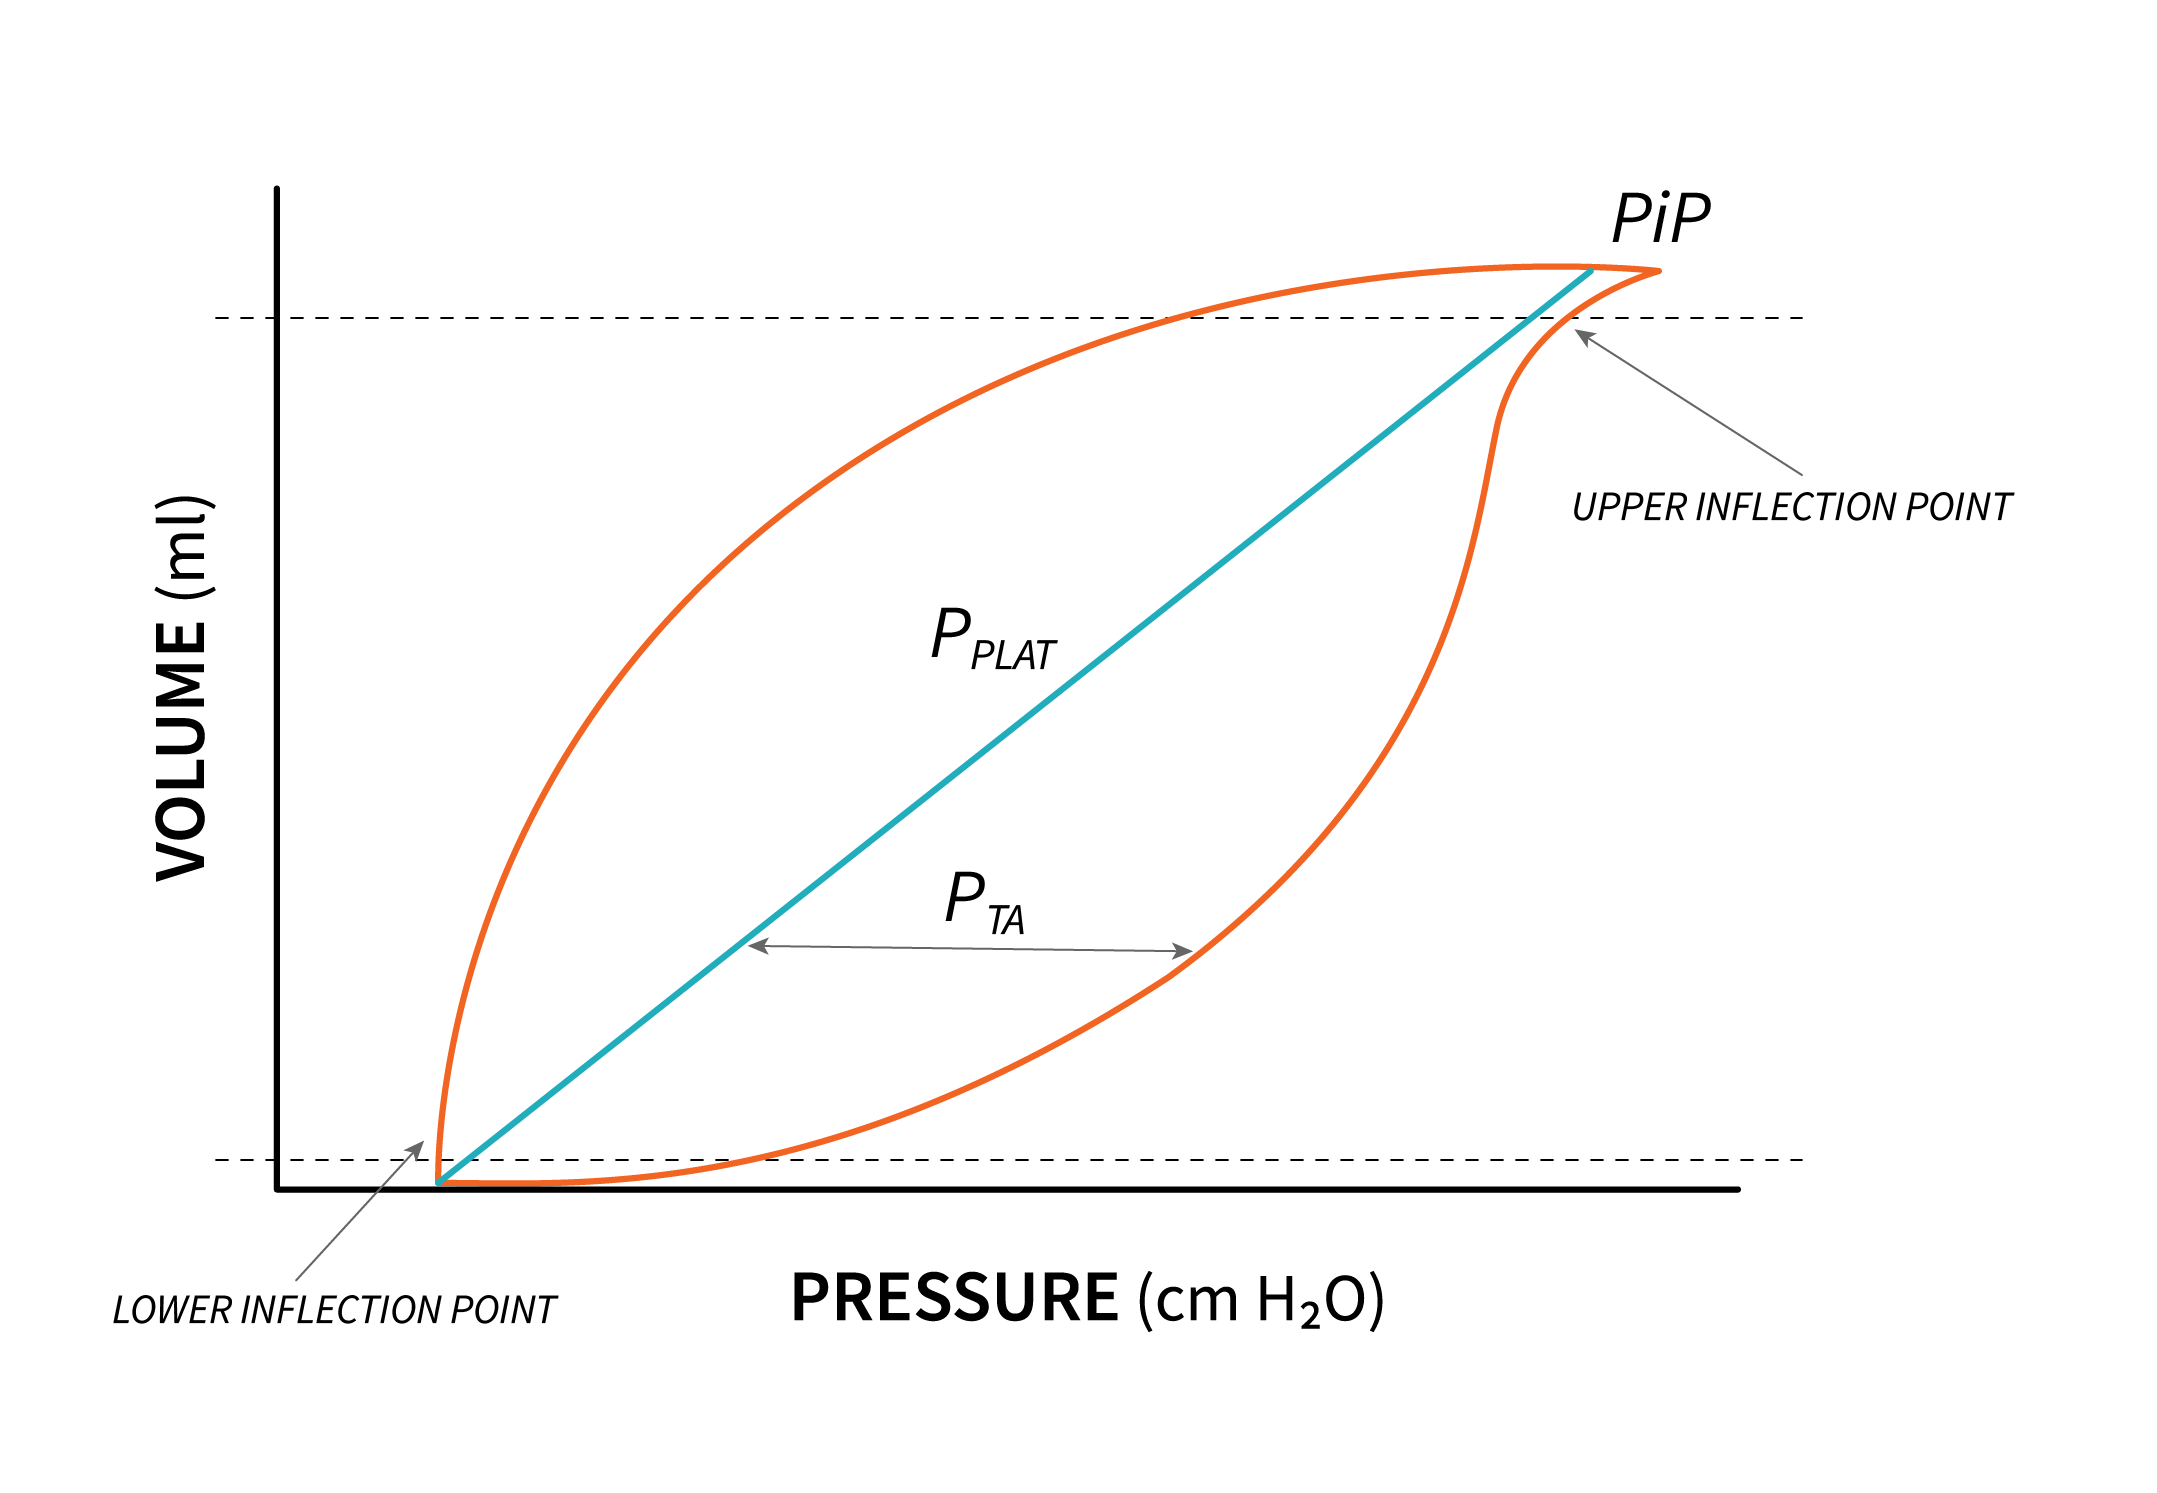
Note that the breath begins from the set baseline (PEEP). As alveoli open at the beginning of inspiration, there is a sharp increase in pressure to the point where the alveoli begin to open. This point is known as the Lower Inflection Point. After this point, the pressure rises smoothly up to peak inspiratory pressure (PIP). Pressure increases in the lungs, increasing tidal volume in the same time, as long as compliance allows distention. Increasing pressure past the compliance threshold leads to overdistension. This point is known as the Upper Inflection point and it can be identified on the PV loop as the point past which increasing pressure does not result in an increase in volume. In fact, past this point, the risk of barotrauma increases.
The above diagram also displays a static PV loop, represented by a solid straight line, showing the pressure needed to open the lungs under static conditions known as plateau pressure. [latex]P_{alv}[/latex] (alveolar distending pressure) can be determined by subtracting PEEP from this plateau pressure, and its value is influenced by lung compliance, indicating the lung’s expandability.
During inhalation, the solid line of the inspiratory curve corresponds to the pressure at the airway opening when delivering a tidal volume [latex](V_T)[/latex]. At the onset of each breath, the ventilator must apply adequate pressure to open collapsed alveoli, resulting in a noticeable lag time (CLICK7) before lung inflation and volume increase.
To overcome airway resistance and initiate lung opening, transairway pressure comes into play. The area between the inspiratory and expiratory curves illustrates hysteresis, which describes two associated phenomena that do not occur simultaneously. Specifically, there is a difference between the inspiratory and expiratory curves, with the lung’s elastic recoil being lower during expiration compared to inspiration for any given lung volume.
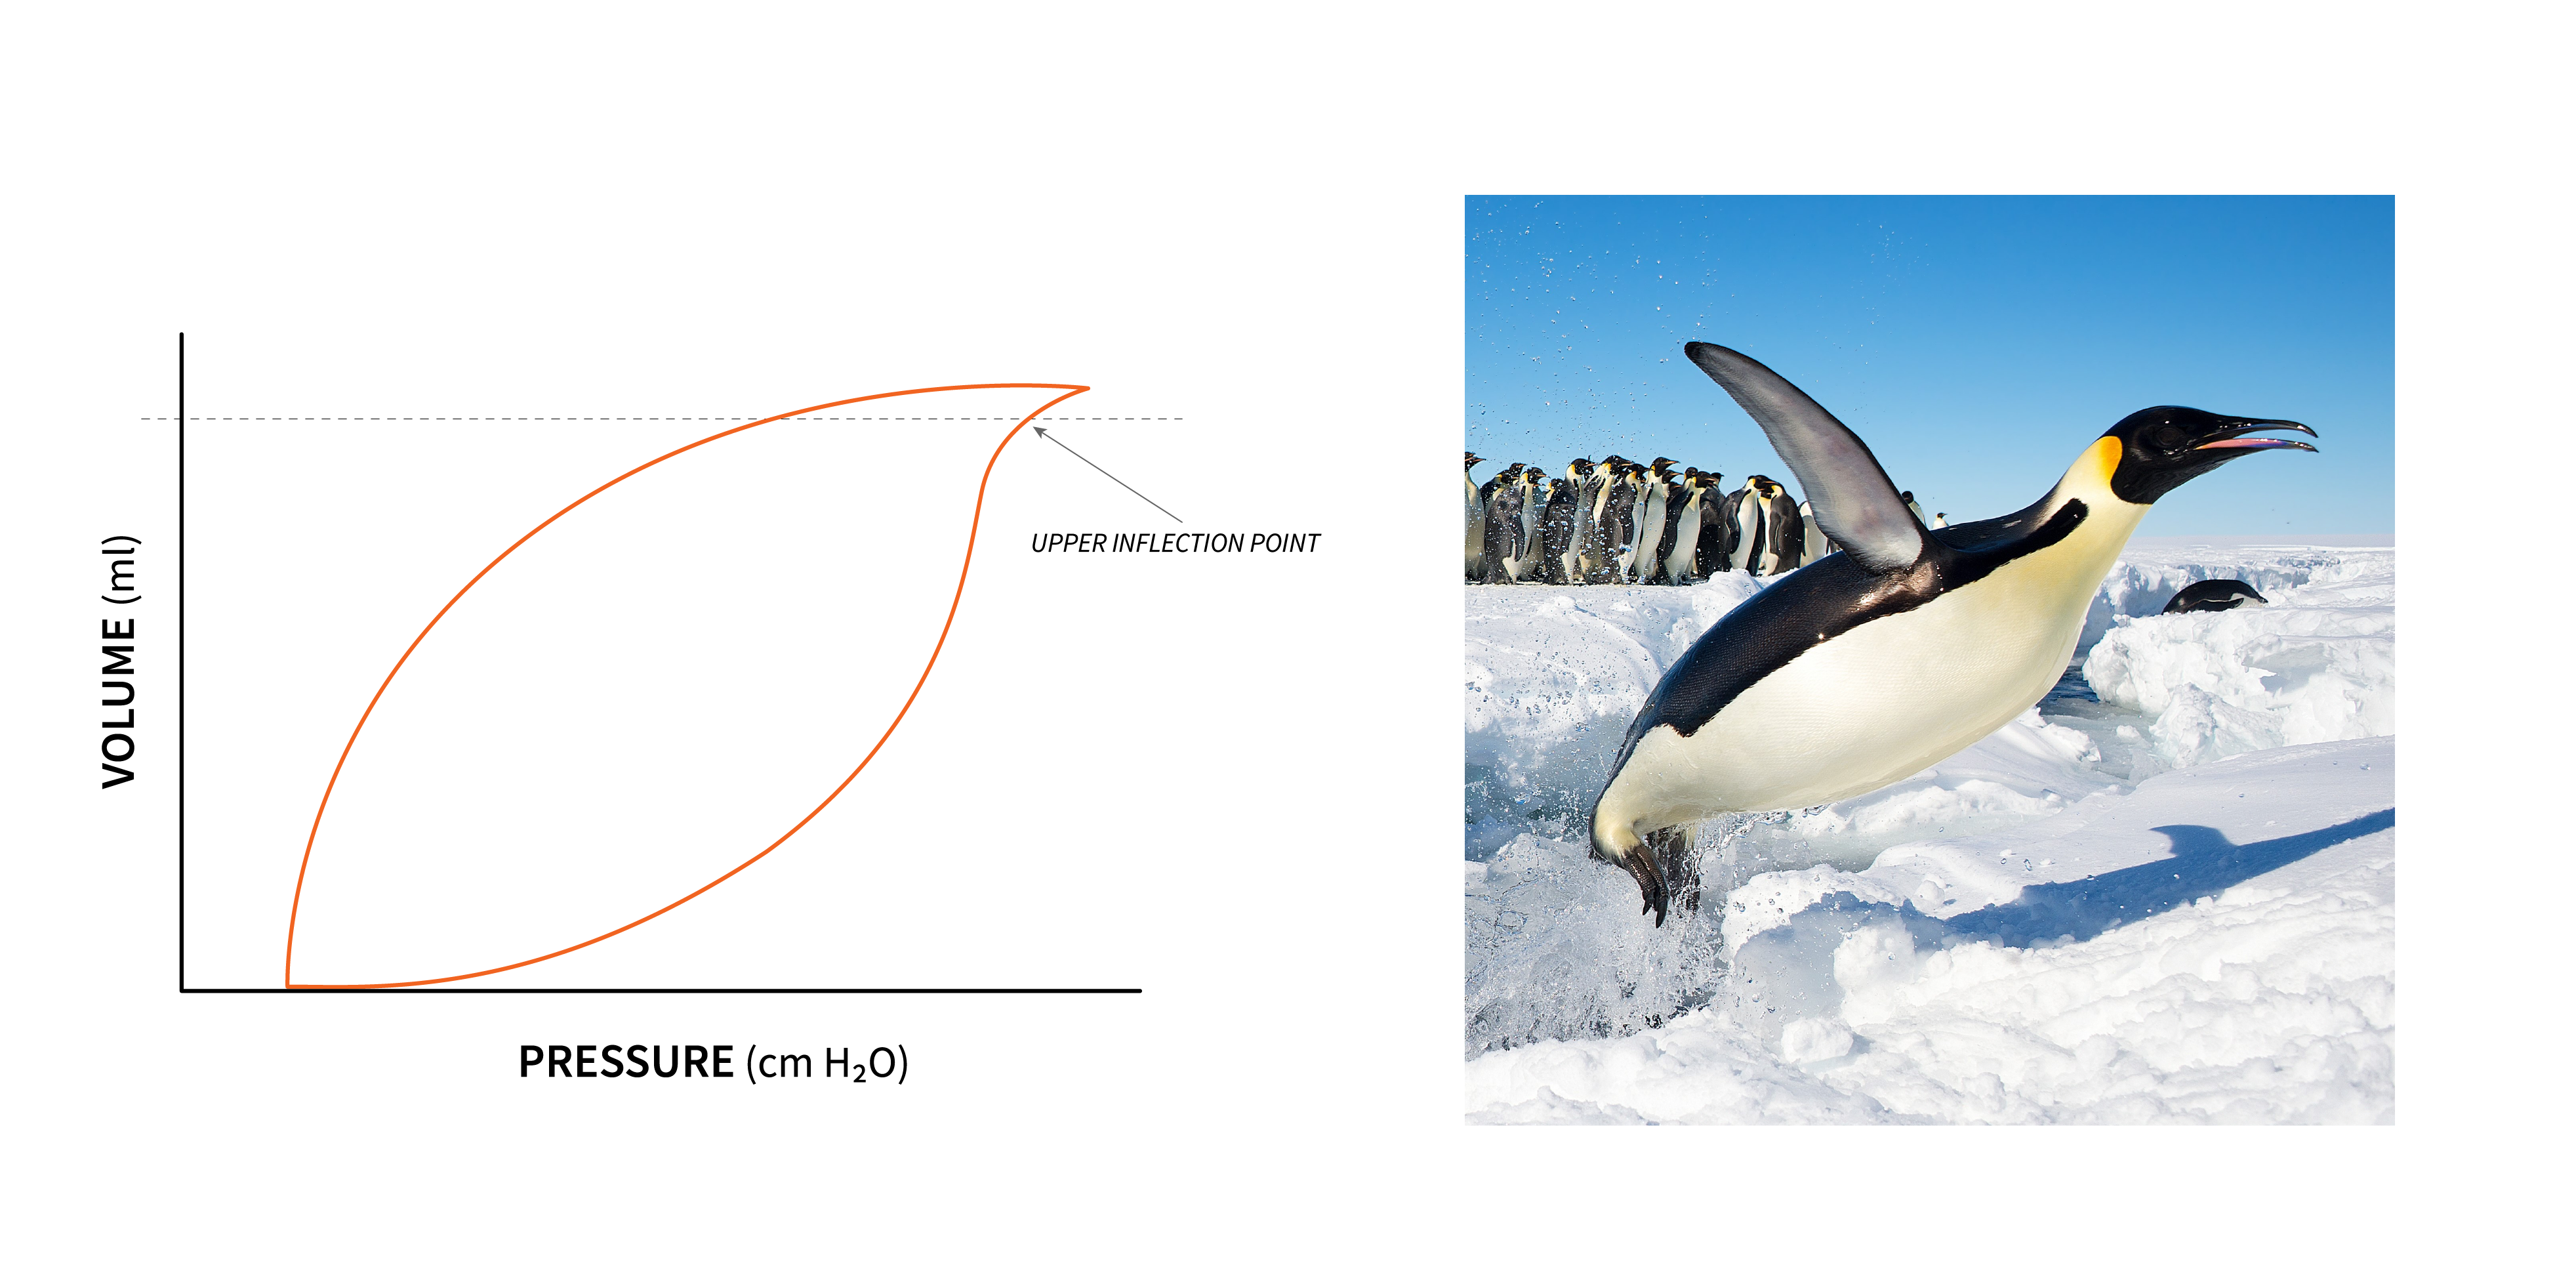
Key Takeaway – Lung Overdistention
Careful assessment of PV loops is a useful tool in identifying overdistension. Additional pressure applied past the Upper inflection Point will over distend the lung without any additional volume gain. This is often described on the PV loop as “beaking” because the PV loop at the top inspiration takes on the shape of a penguin beak.
Object Lesson
Why do we need to learn the components of the PV loop? To better understand risks posed by mechanical ventilation, and that for optimal ventilation we should be keeping pressure between the Lower inflection point and upper inflection point.
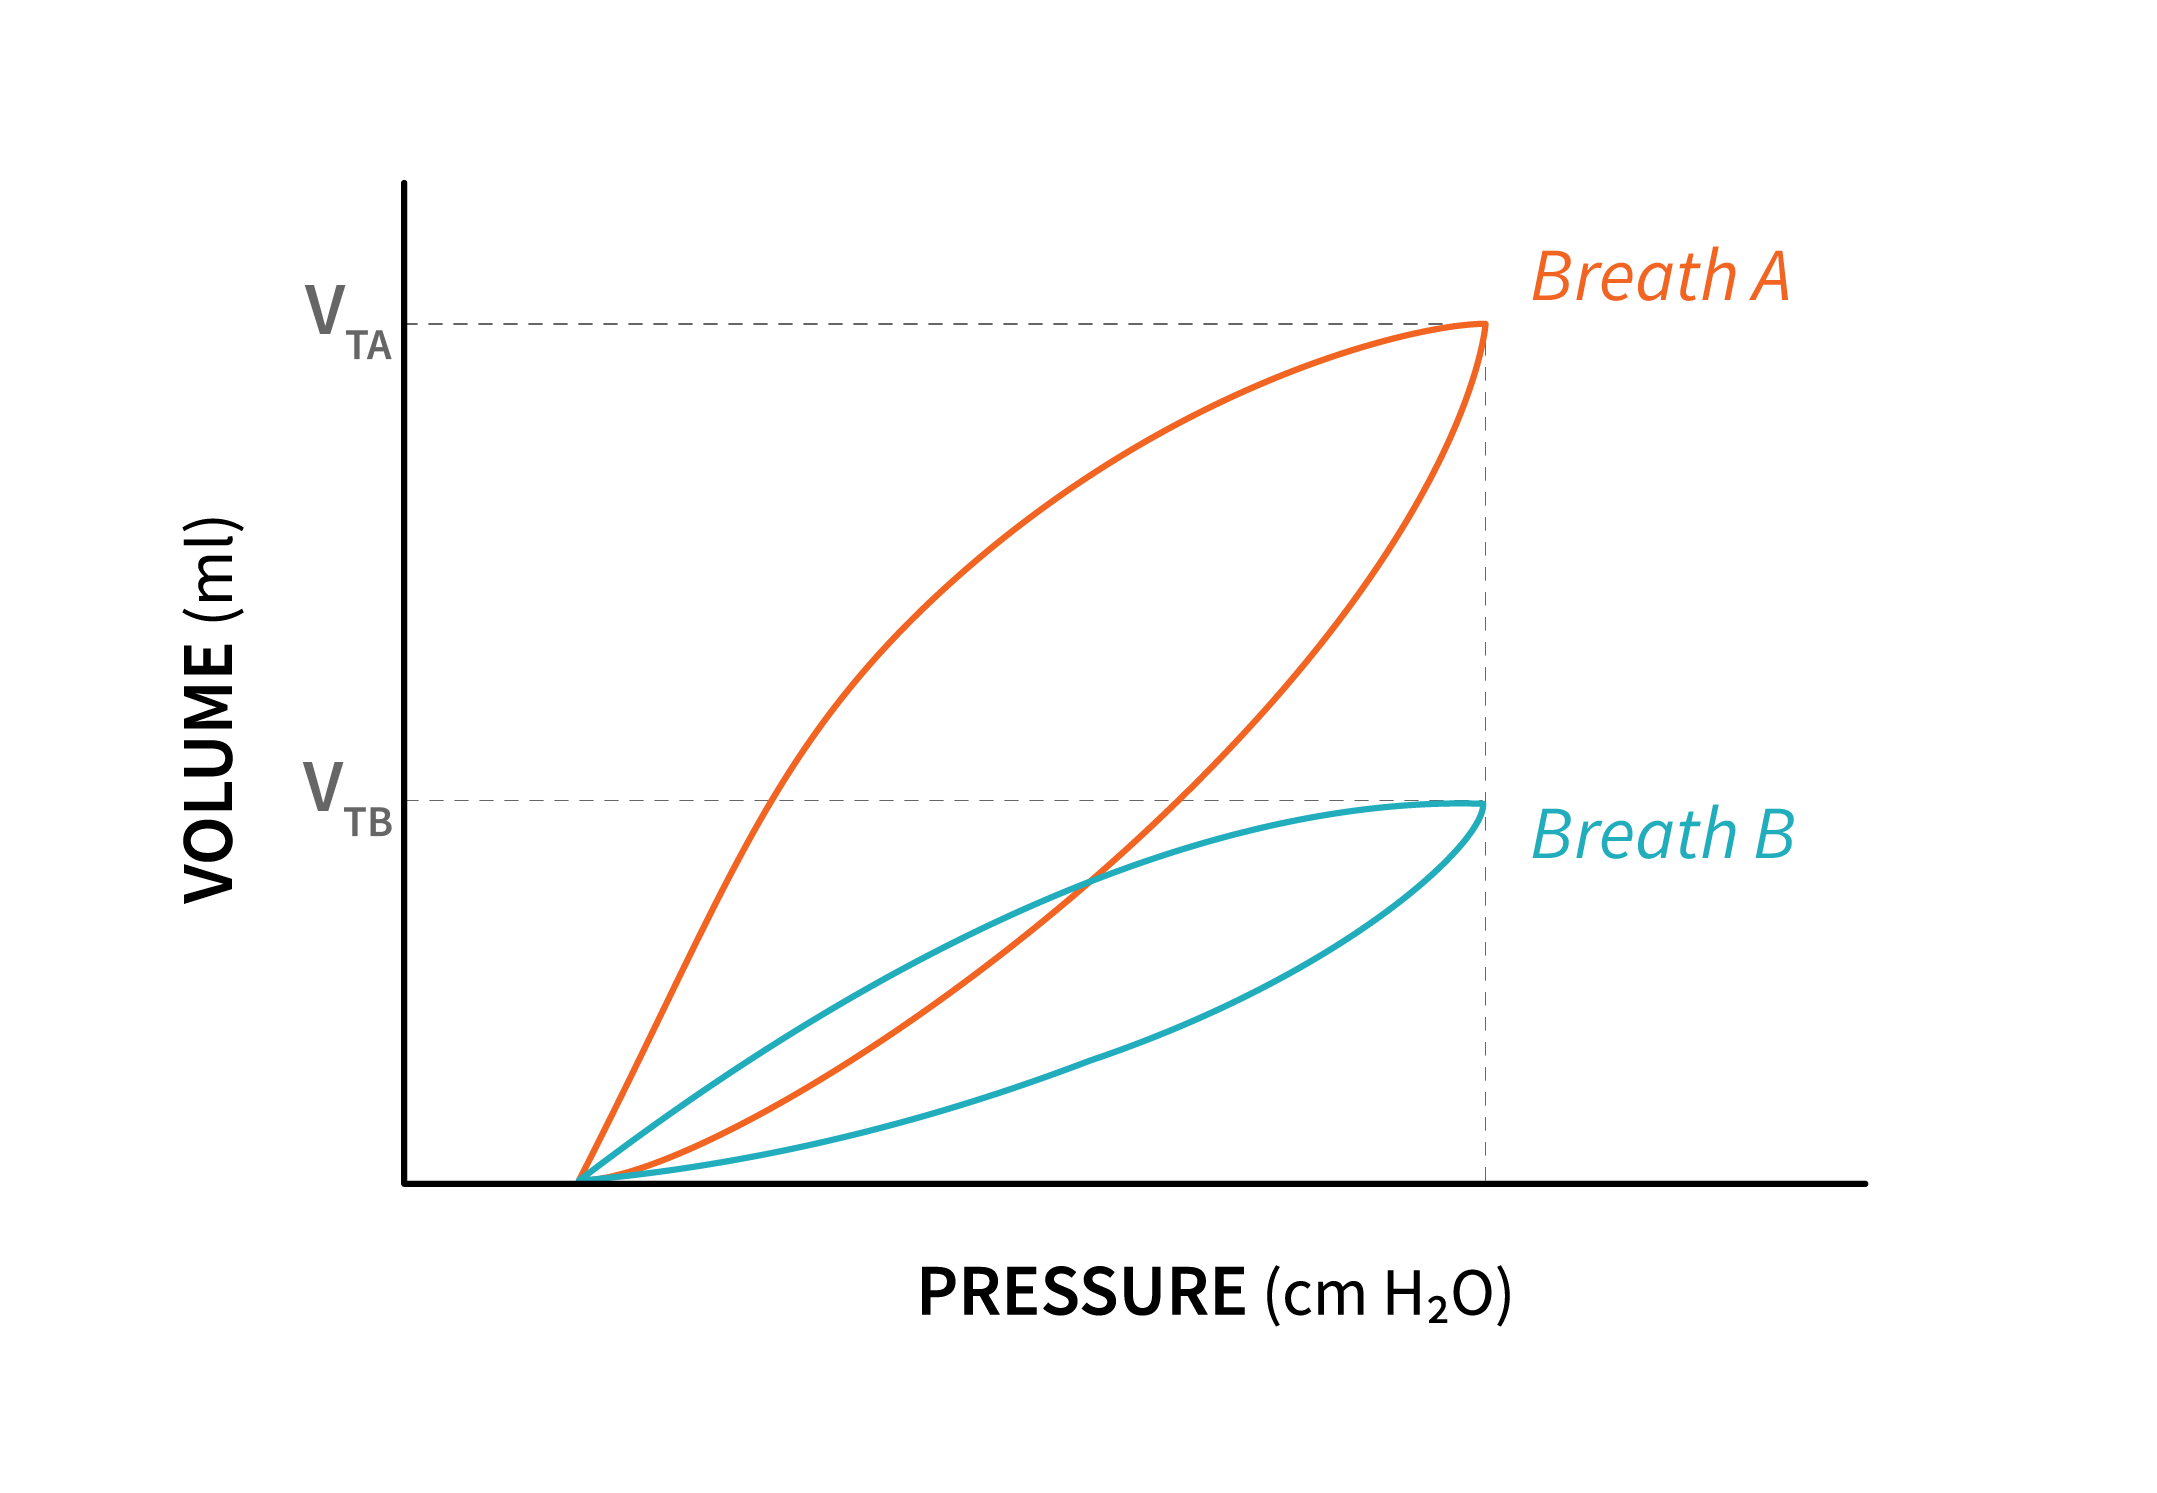
The shape and orientation of the PV loop often provides the first indication of decreasing lung compliance. For example, in the following diagram representing pressure control breaths, where pressure stays the same from breath to breath, note the difference between the PV loop of breaths A and the PV loop of breath B. The second PV loop shows the same pressure being used to ventilate, but a significantly lower tidal volume is delivered due to the lung compliance decreasing.
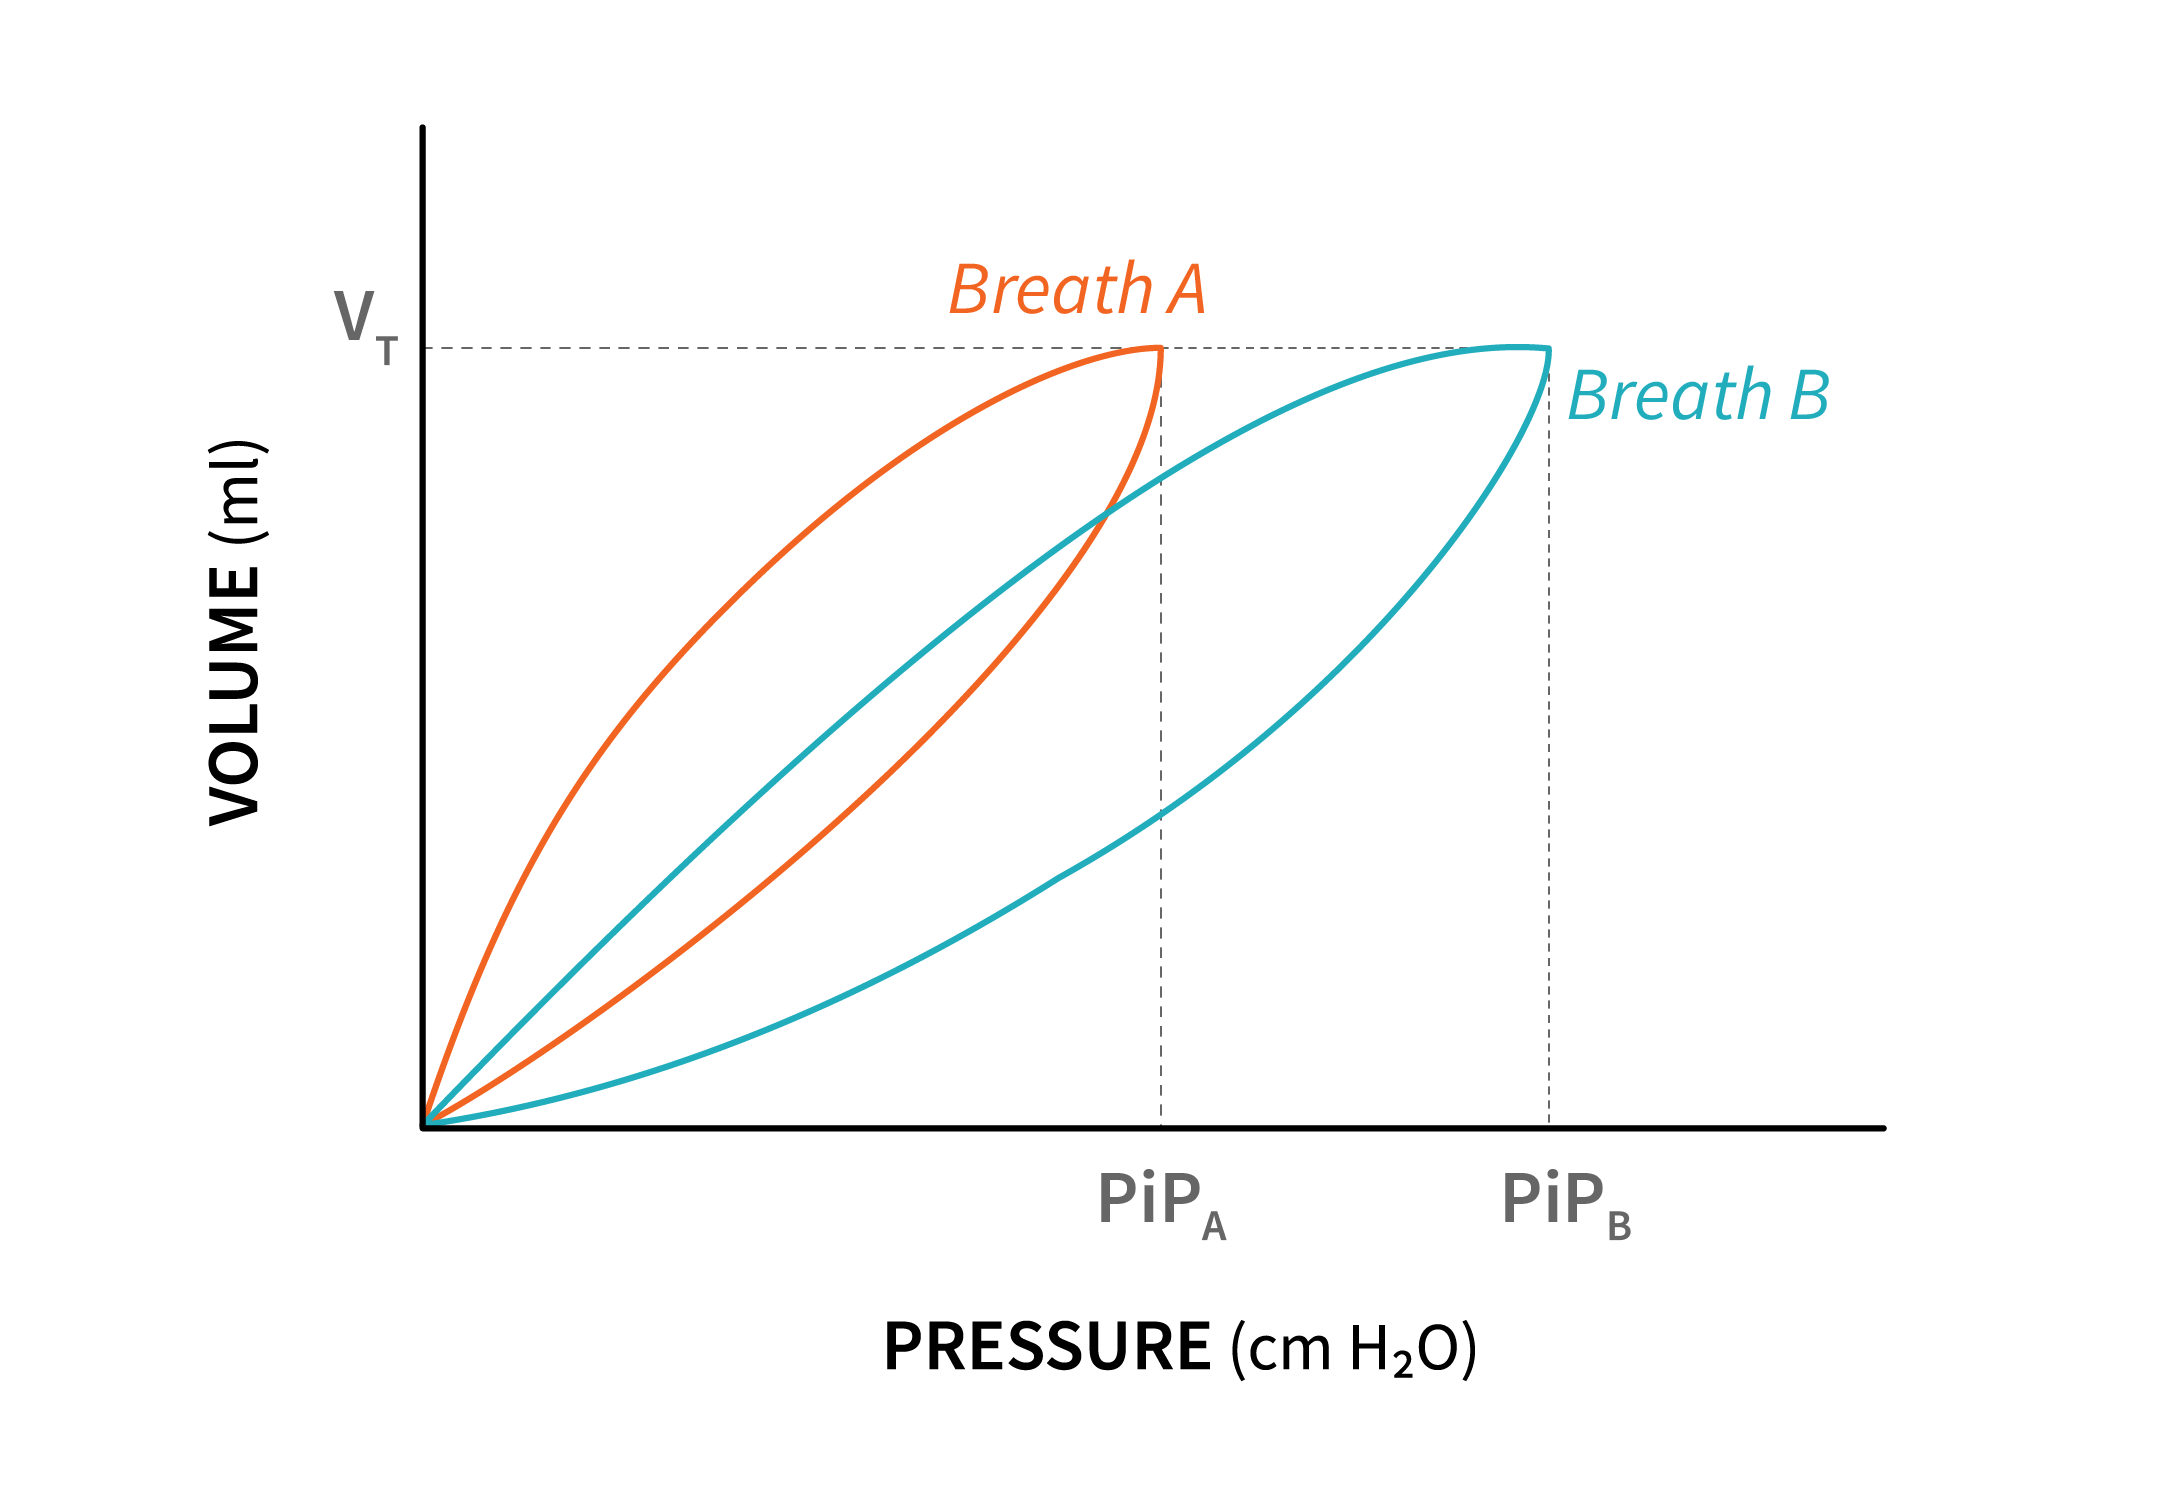
In volume control ventilation, where the set volume remains constant with each breath, a reduction in lung compliance will result in higher pressures being applied to achieve the desired volume. On the following diagram, compare breath A to breath B where compliance decreased.
Airway resistance can also be observed on a PV loop. When there is an increase in resistance to airflow, the loop becomes wider on either the inspiration or expiration side, depending on which phase experiences the higher resistance. This is more commonly seen with increased expiratory resistance, such as in conditions like Asthma or COPD.
Increased inspiratory resistance can be noticed on the PV loop. This may be caused by factors like a small-sized endotracheal tube, a kinked tube, the patient biting the tube, or the presence of large airway tumors. In such cases, the pressure can change from breath to breath as it tries to overcome the increased resistance.

The Flow-Volume Loop
Flow Volume loops (FV loops) are useful in identifying changes in airway resistance. Let’s look at the flow-volume loop of a volume controlled breath. The inspiratory limb of the FV loop is controlled and constant, so it will not show any significant changes with changes in airway resistance. However, the expiratory limb of the FV loop will change with changing airway resistance. As resistance increases, the peak expiratory flowrate decreases. Sometimes, in the presence of obstruction in the airway, the expiratory limb of the FV loop takes a concave shape, giving it a scooped-up appearance.

Key Takeaway
Because they reflect changes in airway resistance, Flow-Volume Loops are often used to assess patient’s response to bronchodilator therapy.
