6.5 Venus
Venus appears very bright, and even a small telescope reveals that it goes through phases like the Moon. Galileo discovered that Venus displays a full range of phases, and he used this as an argument to show that Venus must circle the Sun and not Earth. The planet’s actual surface is not visible because it is shrouded by dense clouds that reflect about 70% of the sunlight that falls on them, frustrating efforts to study the underlying surface, even with cameras in orbit around the planet (Figure 6.22).
Venus as Photographed by the Pioneer Venus Orbiter
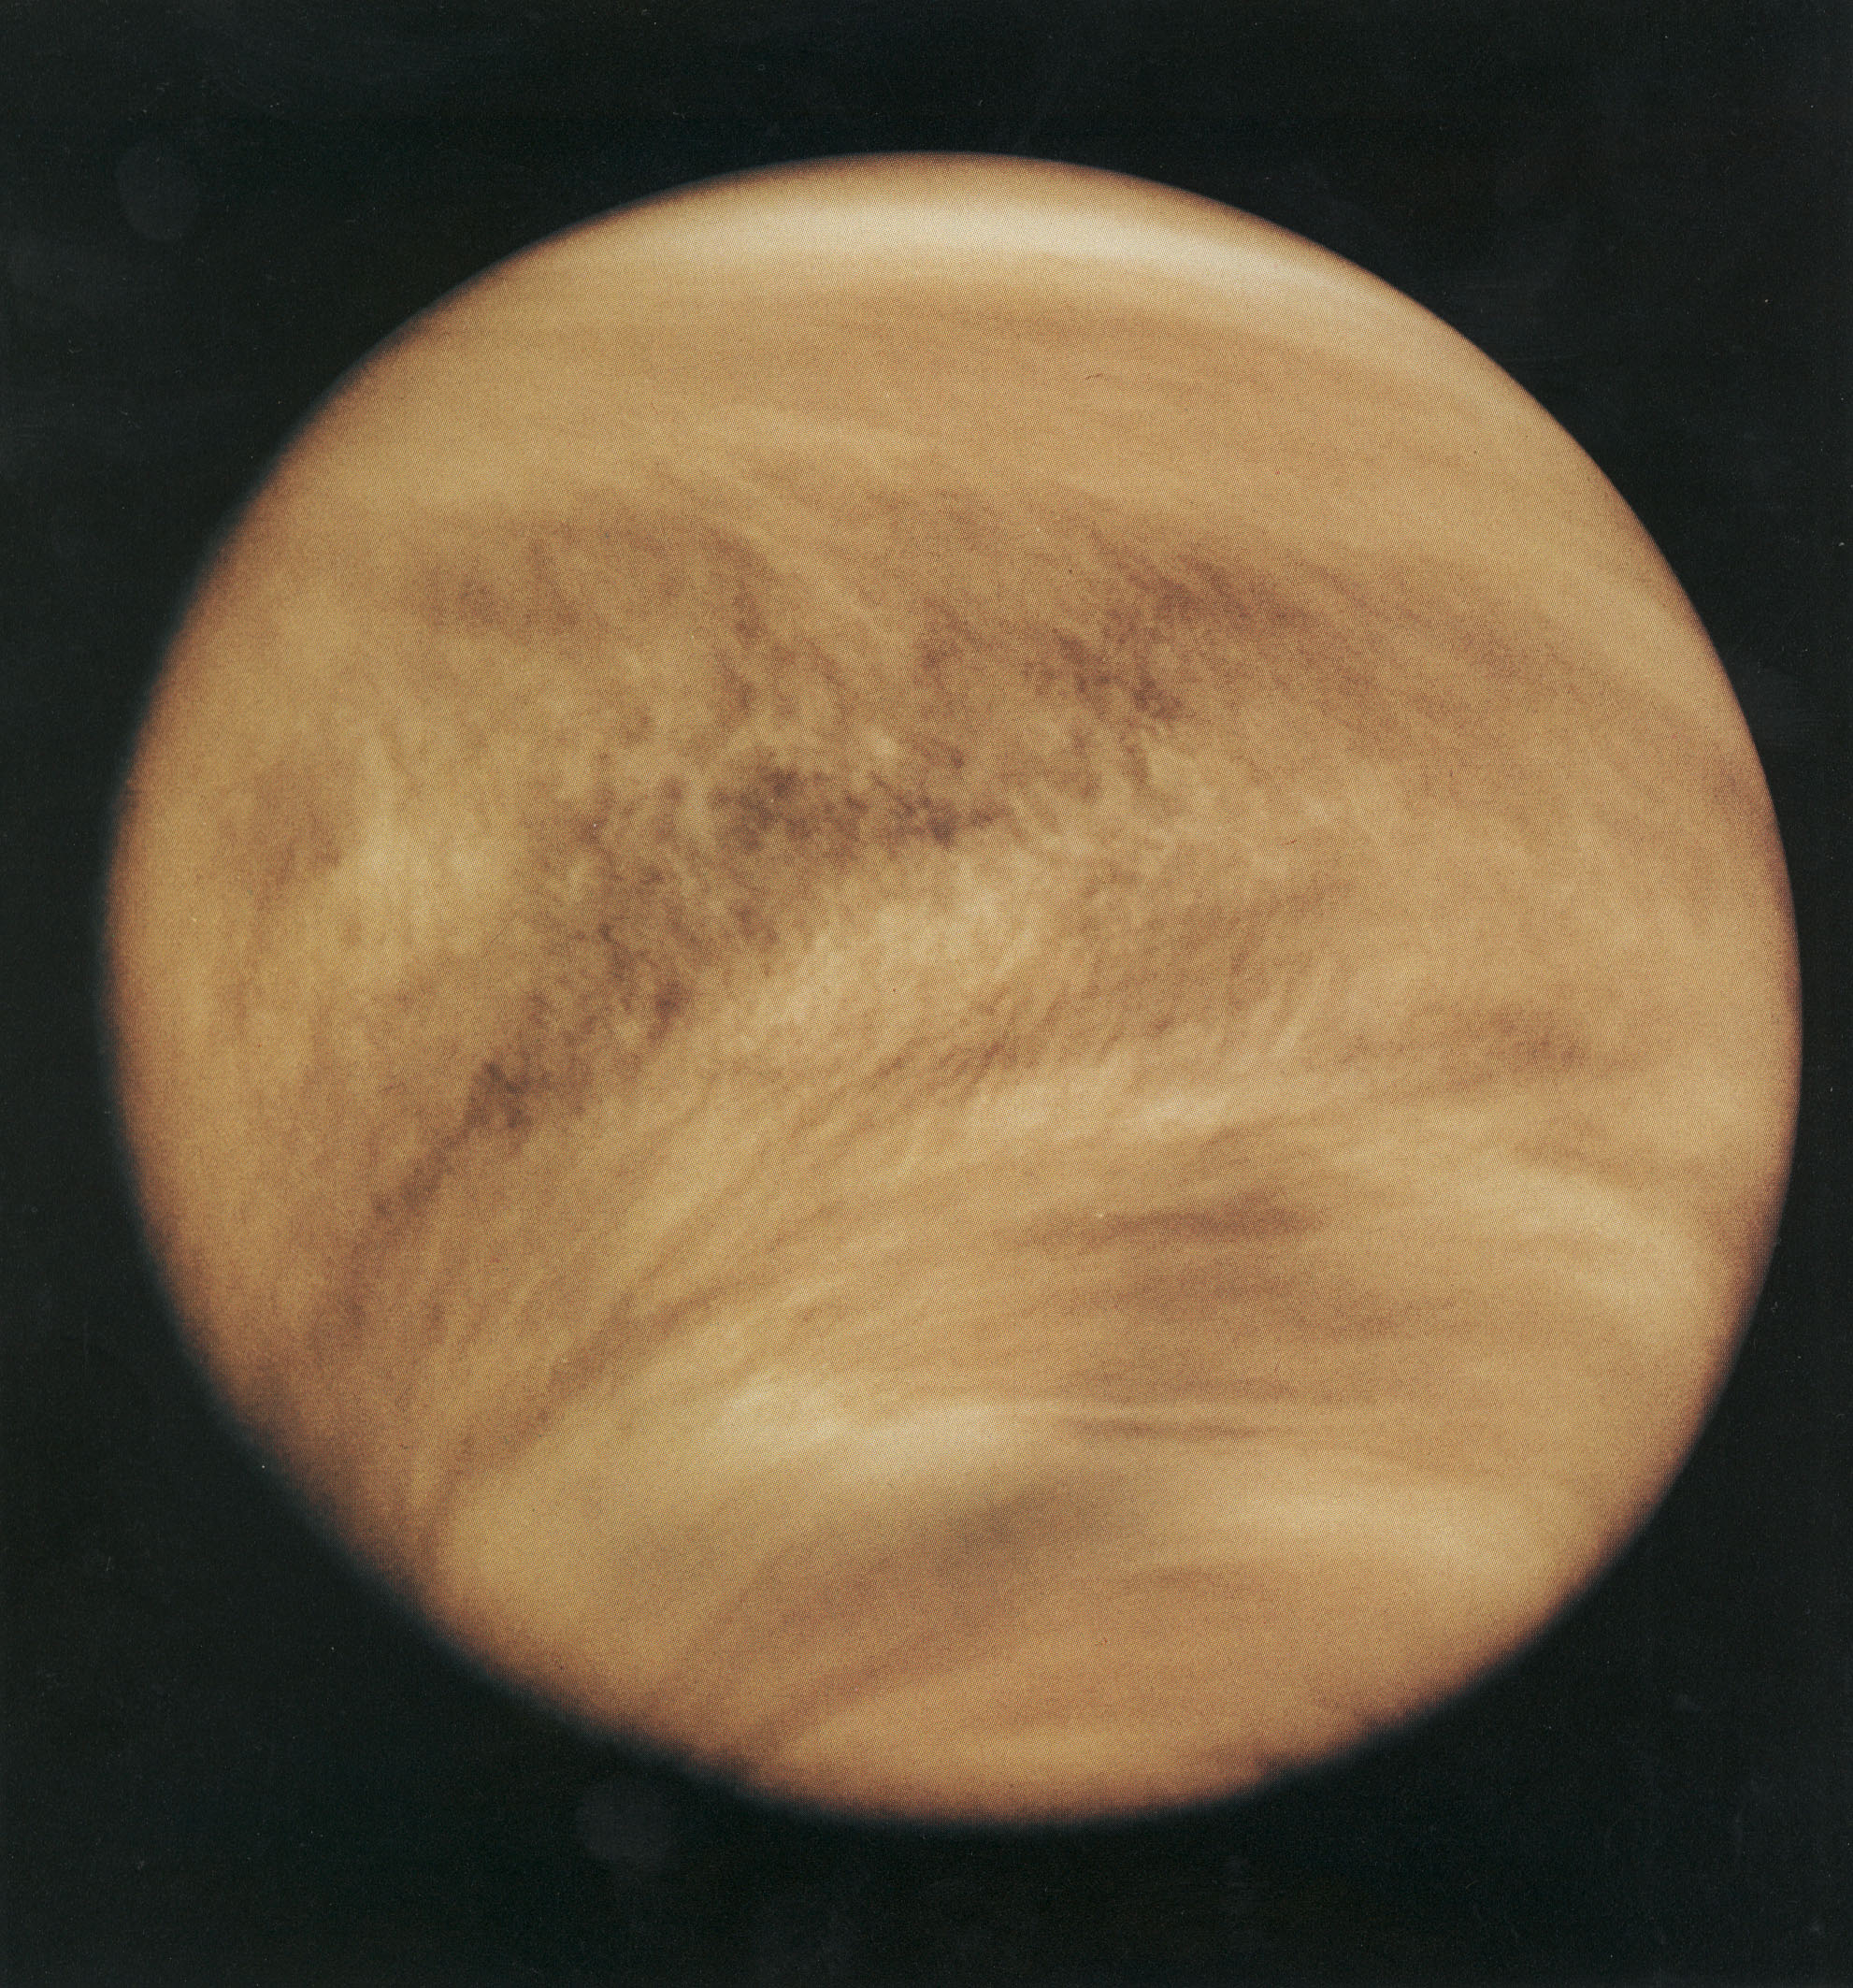
Ultraviolet image of Venus’ clouds as seen by the Pioneer Venus Orbiter (Feb. 26, 1979) by NASA/GSFC, NASA Media Licence.
Since no surface detail can be seen through Venus’ clouds, its rotation period can be found only by bouncing radar signals off the planet. The first radar observations of Venus’ rotation were made in the early 1960s. Later, topographical surface features were identified on the planet that showed up in the reflected radar signals. The rotation period of Venus, precisely determined from the motion of such “radar features” across its disk, is 243 days. Even more surprising than how long Venus takes to rotate is the fact that it spins in a backward or retrograde direction (east to west).
Stop for a moment and think about how odd this slow rotation makes the calendar on Venus. The planet takes 225 Earth days to orbit the Sun and 243 Earth days to spin on its axis. So the day on Venus (as defined by its spinning once) is longer than the year! As a result, the time the Sun takes to return to the same place in Venus’ sky—another way we might define the meaning of a day—turns out to be 117 Earth days. (If you say “See you tomorrow” on Venus, you’ll have a long time to wait.) Although we do not know the reason for Venus’ slow backward rotation, we can guess that it may have suffered one or more extremely powerful collisions during the formation process of the solar system.
Since Venus has about the same size and composition as Earth, we might expect its geology to be similar. This is partly true, but Venus does not exhibit the same kind of plate tectonics as Earth, and we will see that its lack of erosion results in a very different surface appearance.
Nearly 50 spacecraft have been launched to Venus, but only about half were successful. Although the 1962 US Mariner 2 flyby was the first, the Soviet Union launched most of the subsequent missions to Venus. In 1970, Venera 7 became the first probe to land and broadcast data from the surface of Venus. It operated for 23 minutes before succumbing to the high surface temperature. Additional Venera probes and landers followed, photographing the surface and analyzing the atmosphere and soil.
To understand the geology of Venus, however, we needed to make a global study of its surface, a task made very difficult by the perpetual cloud layers surrounding the planet. The problem resembles the challenge facing air traffic controllers at an airport, when the weather is so cloudy or smoggy that they can’t locate the incoming planes visually. The solution is similar in both cases: use a radar instrument to probe through the obscuring layer.
The first global radar map was made by the US Pioneer Venus orbiter in the late 1970s, followed by better maps from the twin Soviet Venera 15 and 16 radar orbiters in the early 1980s. However, most of our information on the geology of Venus is derived from the US Magellan spacecraft, which mapped Venus with a powerful imaging radar. Magellan produced images with a resolution of 100 metres, much better than that of previous missions, yielding our first detailed look at the surface of our sister planet (Figure 6.23). (The Magellan spacecraft returned more data to Earth than all previous planetary missions combined; each 100 minutes of data transmission from the spacecraft provided enough information, if translated into characters, to fill two 30-volume encyclopedias.)
Radar Map of Venus

Hemispheric View of Venus by NASA/JPL/USGS, NASA Media Licence.
Consider for a moment how good Magellan’s resolution of 100 metres really is. It means the radar images from Venus can show anything on the surface larger than a football field. Suddenly, a whole host of topographic features on Venus became accessible to our view. As you look at the radar images throughout this chapter, bear in mind that these are constructed from radar reflections, not from visible-light photographs. For example, bright features on these radar images are an indication of rough terrain, whereas darker regions are smoother.
The radar maps of Venus reveal a planet that looks much the way Earth might look if our planet’s surface were not constantly being changed by erosion and deposition of sediment. Because there is no water or ice on Venus and the surface wind speeds are low, almost nothing obscures or erases the complex geological features produced by the movements of Venus’ crust, by volcanic eruptions, and by impact craters. Having finally penetrated below the clouds of Venus, we find its surface to be naked, revealing the history of hundreds of millions of years of geological activity.
About 75% of the surface of Venus consists of lowland lava plains. Superficially, these plains resemble the basaltic ocean basins of Earth, but they were not produced in quite the same way. There is no evidence of subduction zones on Venus, indicating that, unlike Earth, this planet never experienced plate tectonics. Although convection (the rising of hot materials) in its mantle generated great stresses in the crust of Venus, they did not start large continental plates moving. The formation of the lava plains of Venus more nearly resembles that of the lunar maria. Both were the result of widespread lava eruptions without the crustal spreading associated with plate tectonics.
Rising above the lowland lava plains are two full-scale continents of mountainous terrain. The largest continent on Venus, called Aphrodite, is about the size of Africa (you can see it stand out in Figure 6.23). Aphrodite stretches along the equator for about one-third of the way around the planet. Next in size is the northern highland region Ishtar, which is about the size of Australia. Ishtar contains the highest region on the planet, the Maxwell Mountains, which rise 11 kilometres above the surrounding lowlands. (The Maxwell Mountains are the only feature on Venus named after a man. They commemorate James Clerk Maxwell, whose theory of electromagnetism led to the invention of radar. All other features are named for women, either from history or mythology.)
One of the first questions astronomers addressed with the high-resolution Magellan images was the age of the surface of Venus. Remember that the age of a planetary surface is rarely the age of the world it is on. A young age merely implies an active geology in that location. Such ages can be derived from counting impact craters. Figure 6.24 is an example of what these craters look like on the Venus radar images. The more densely cratered the surface, the greater its age. The largest crater on Venus (called Mead) is 275 kilometres in diameter, slightly larger than the largest known terrestrial crater (Chicxulub), but much smaller than the lunar impact basins.
Impact Craters on Venus
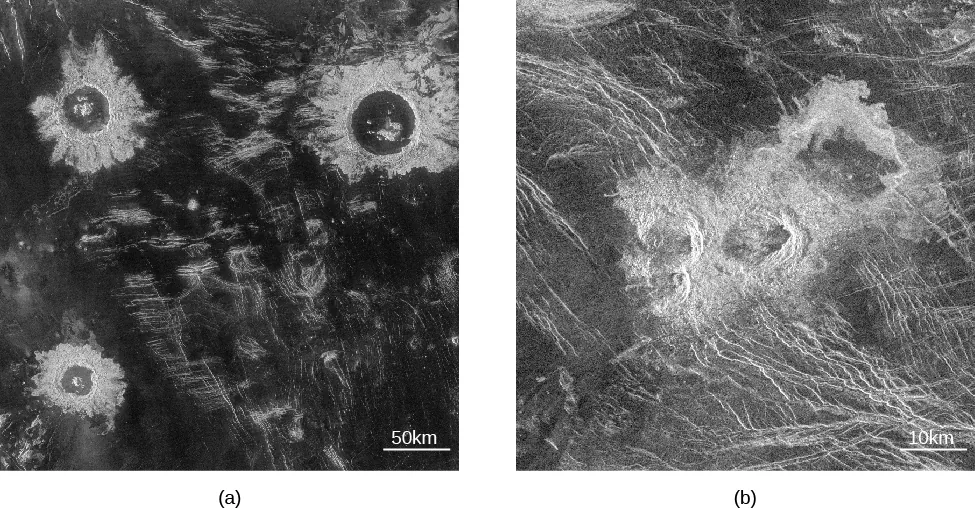
(a): PIA00086: Mosaic of Large Impact Craters by NASA/JPL, NASA Media Licence.
(b): PIA00088: Venus – Stein Triplet Crater by NASA/JPL, NASA Media Licence.
The large craters in the venusian plains indicate an average surface age that is only between 300 and 600 million years. These results indicate that Venus is indeed a planet with persistent geological activity, intermediate between that of Earth’s ocean basins (which are younger and more active) and that of its continents (which are older and less active).
Like Earth, Venus is a planet that has experienced widespread volcanism. In the lowland plains, volcanic eruptions are the principal way the surface is renewed, with large flows of highly fluid lava destroying old craters and generating a fresh surface. In addition, numerous younger volcanic mountains and other structures are associated with surface hot spots—places where convection in the planet’s mantle transports the interior heat to the surface.
The largest individual volcano on Venus, called Sif Mons, is about 500 kilometres across and 3 kilometres high—broader but lower than the Hawaiian volcano Mauna Loa. At its top is a volcanic crater, or caldera, about 40 kilometres across, and its slopes show individual lava flows up to 500 kilometres long. Thousands of smaller volcanoes dot the surface, down to the limit of visibility of the Magellan images, which correspond to cones or domes about the size of a shopping mall parking lot. Most of these seem similar to terrestrial volcanoes. Other volcanoes have unusual shapes, such as the “pancake domes” illustrated in Figure 6.25.
Pancake-Shaped Volcanoes on Venus
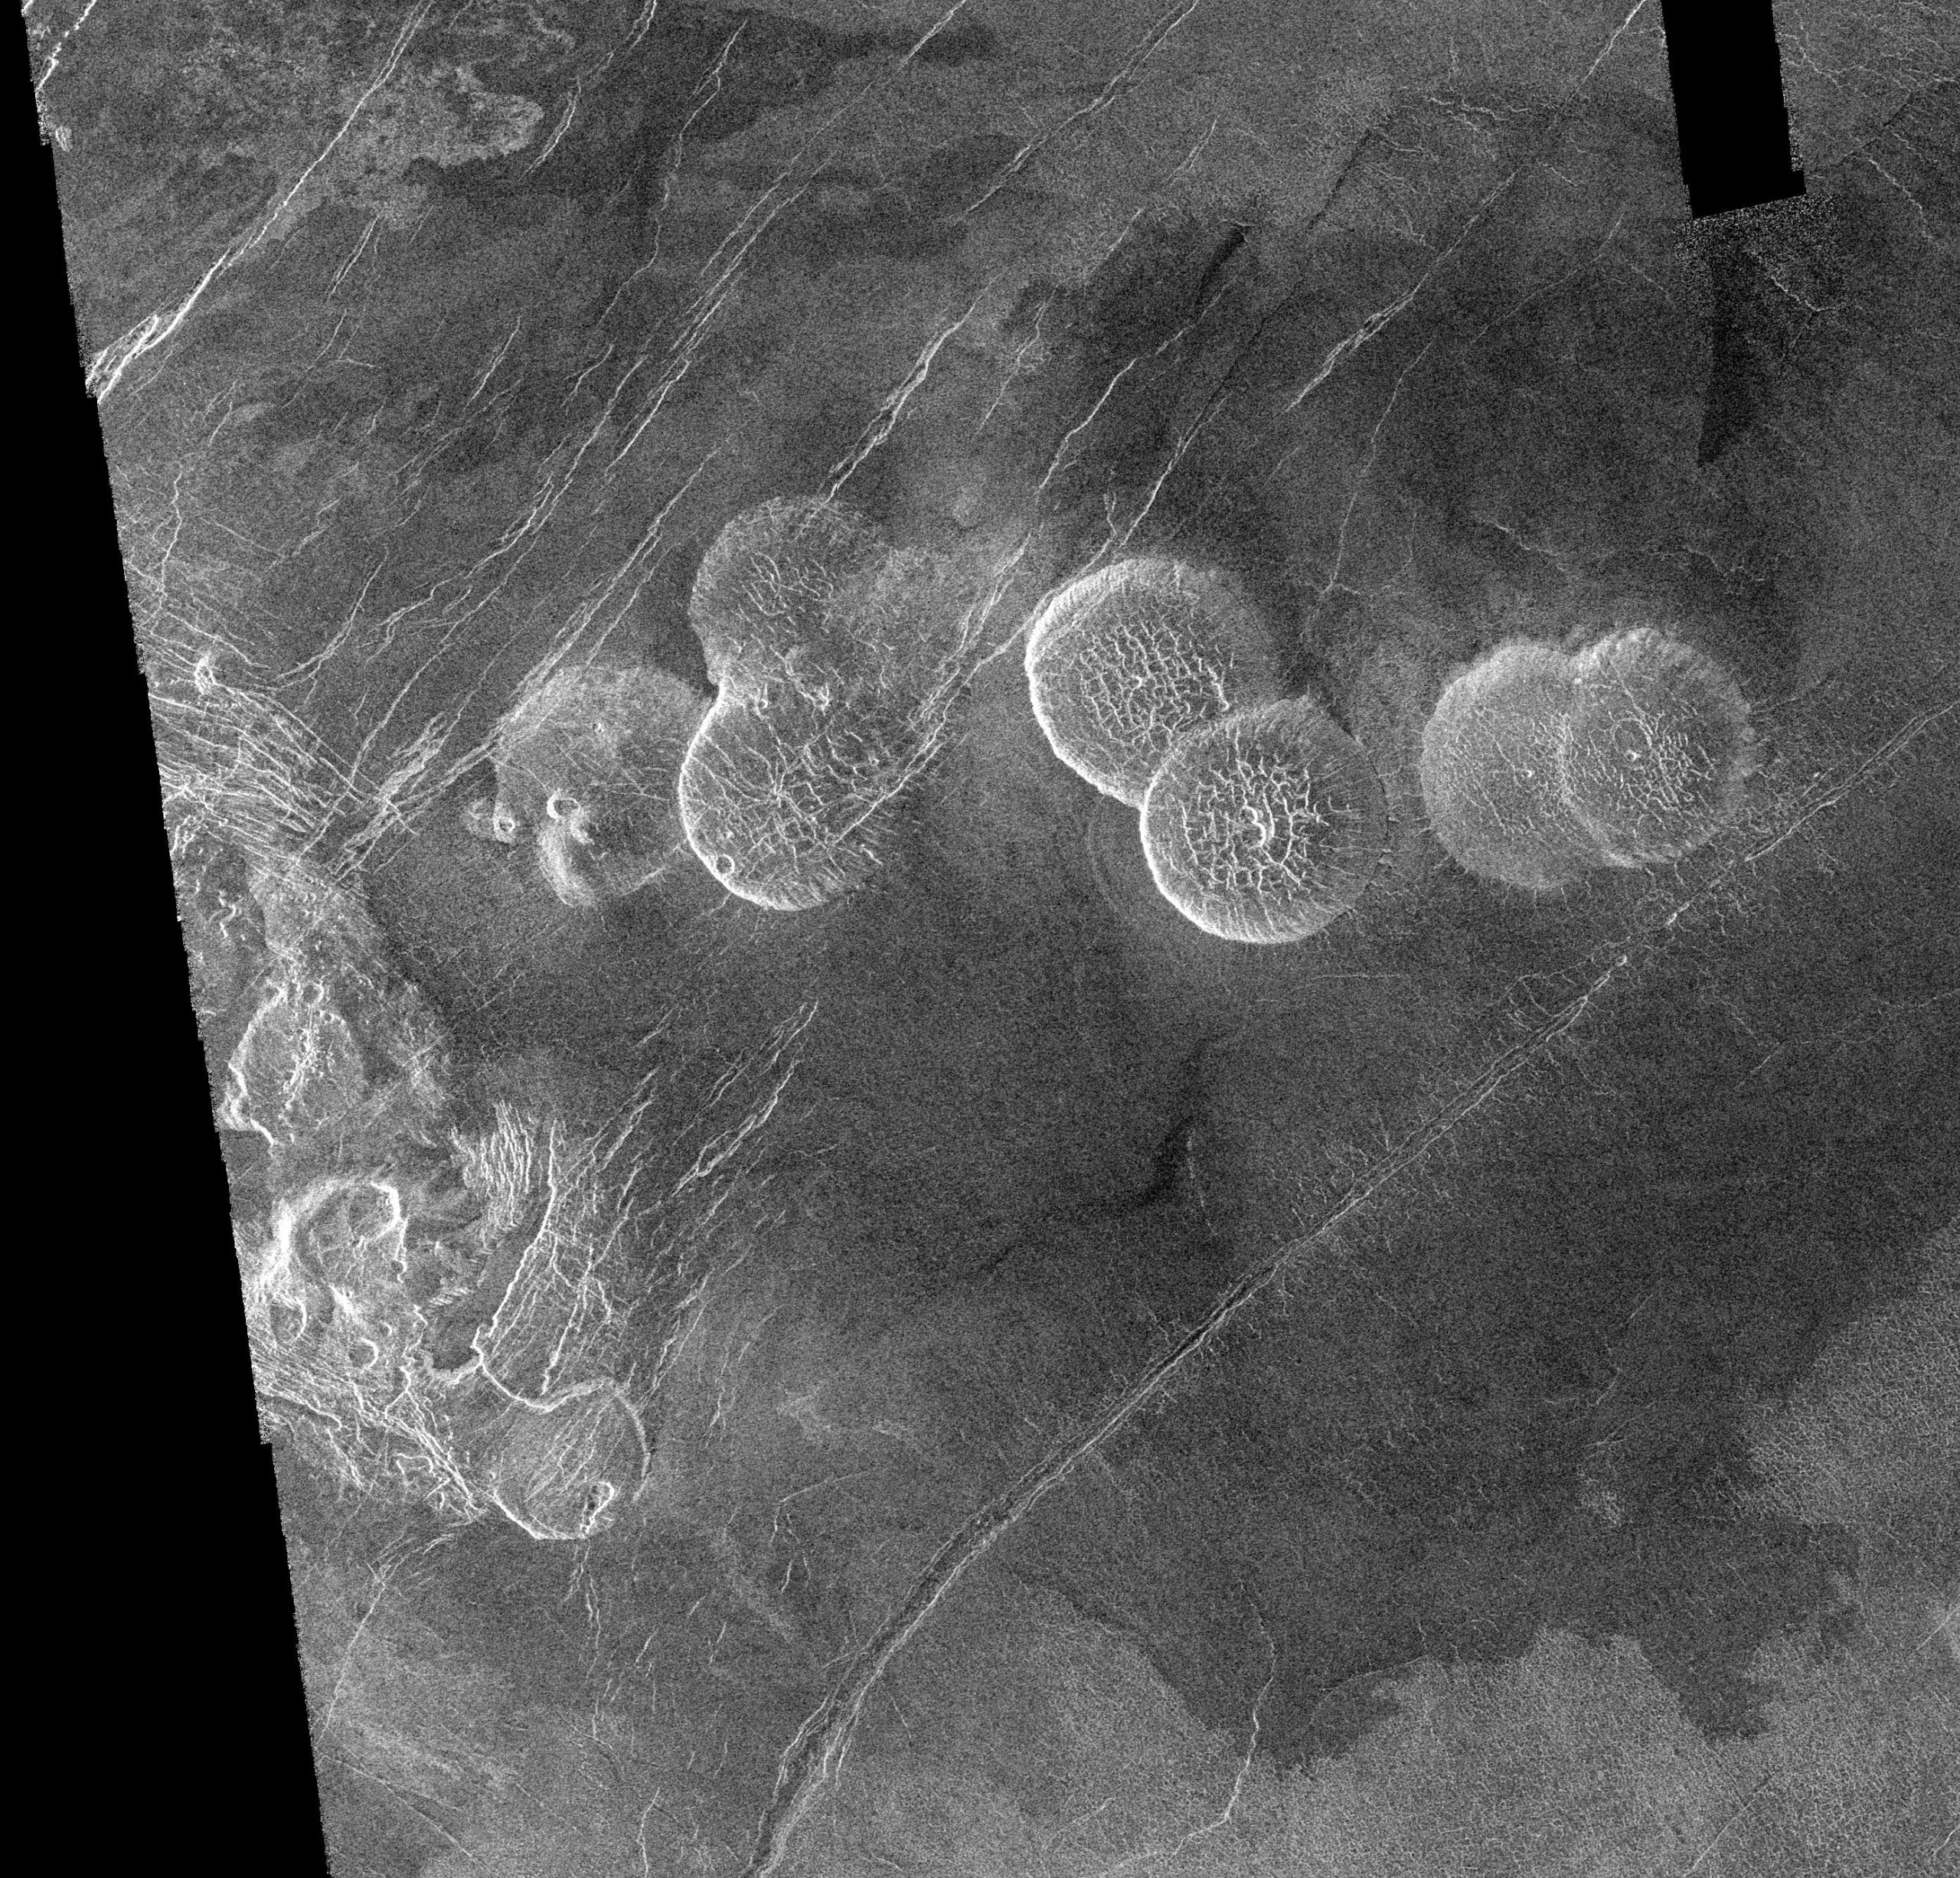
Venus – Alpha Regio by NASA/JPL, NASA JPL Media Licence.
All of the volcanism is the result of eruption of lava onto the surface of the planet. But the hot lava rising from the interior of a planet does not always make it to the surface. On both Earth and Venus, this upwelling lava can collect to produce bulges in the crust. Many of the granite mountain ranges on Earth, such as the Sierra Nevada in California, involve such subsurface volcanism. These bulges are common on Venus, where they produce large circular or oval features called coronae (singular: corona) (Figure 6.26).
The “Miss Piggy” Corona
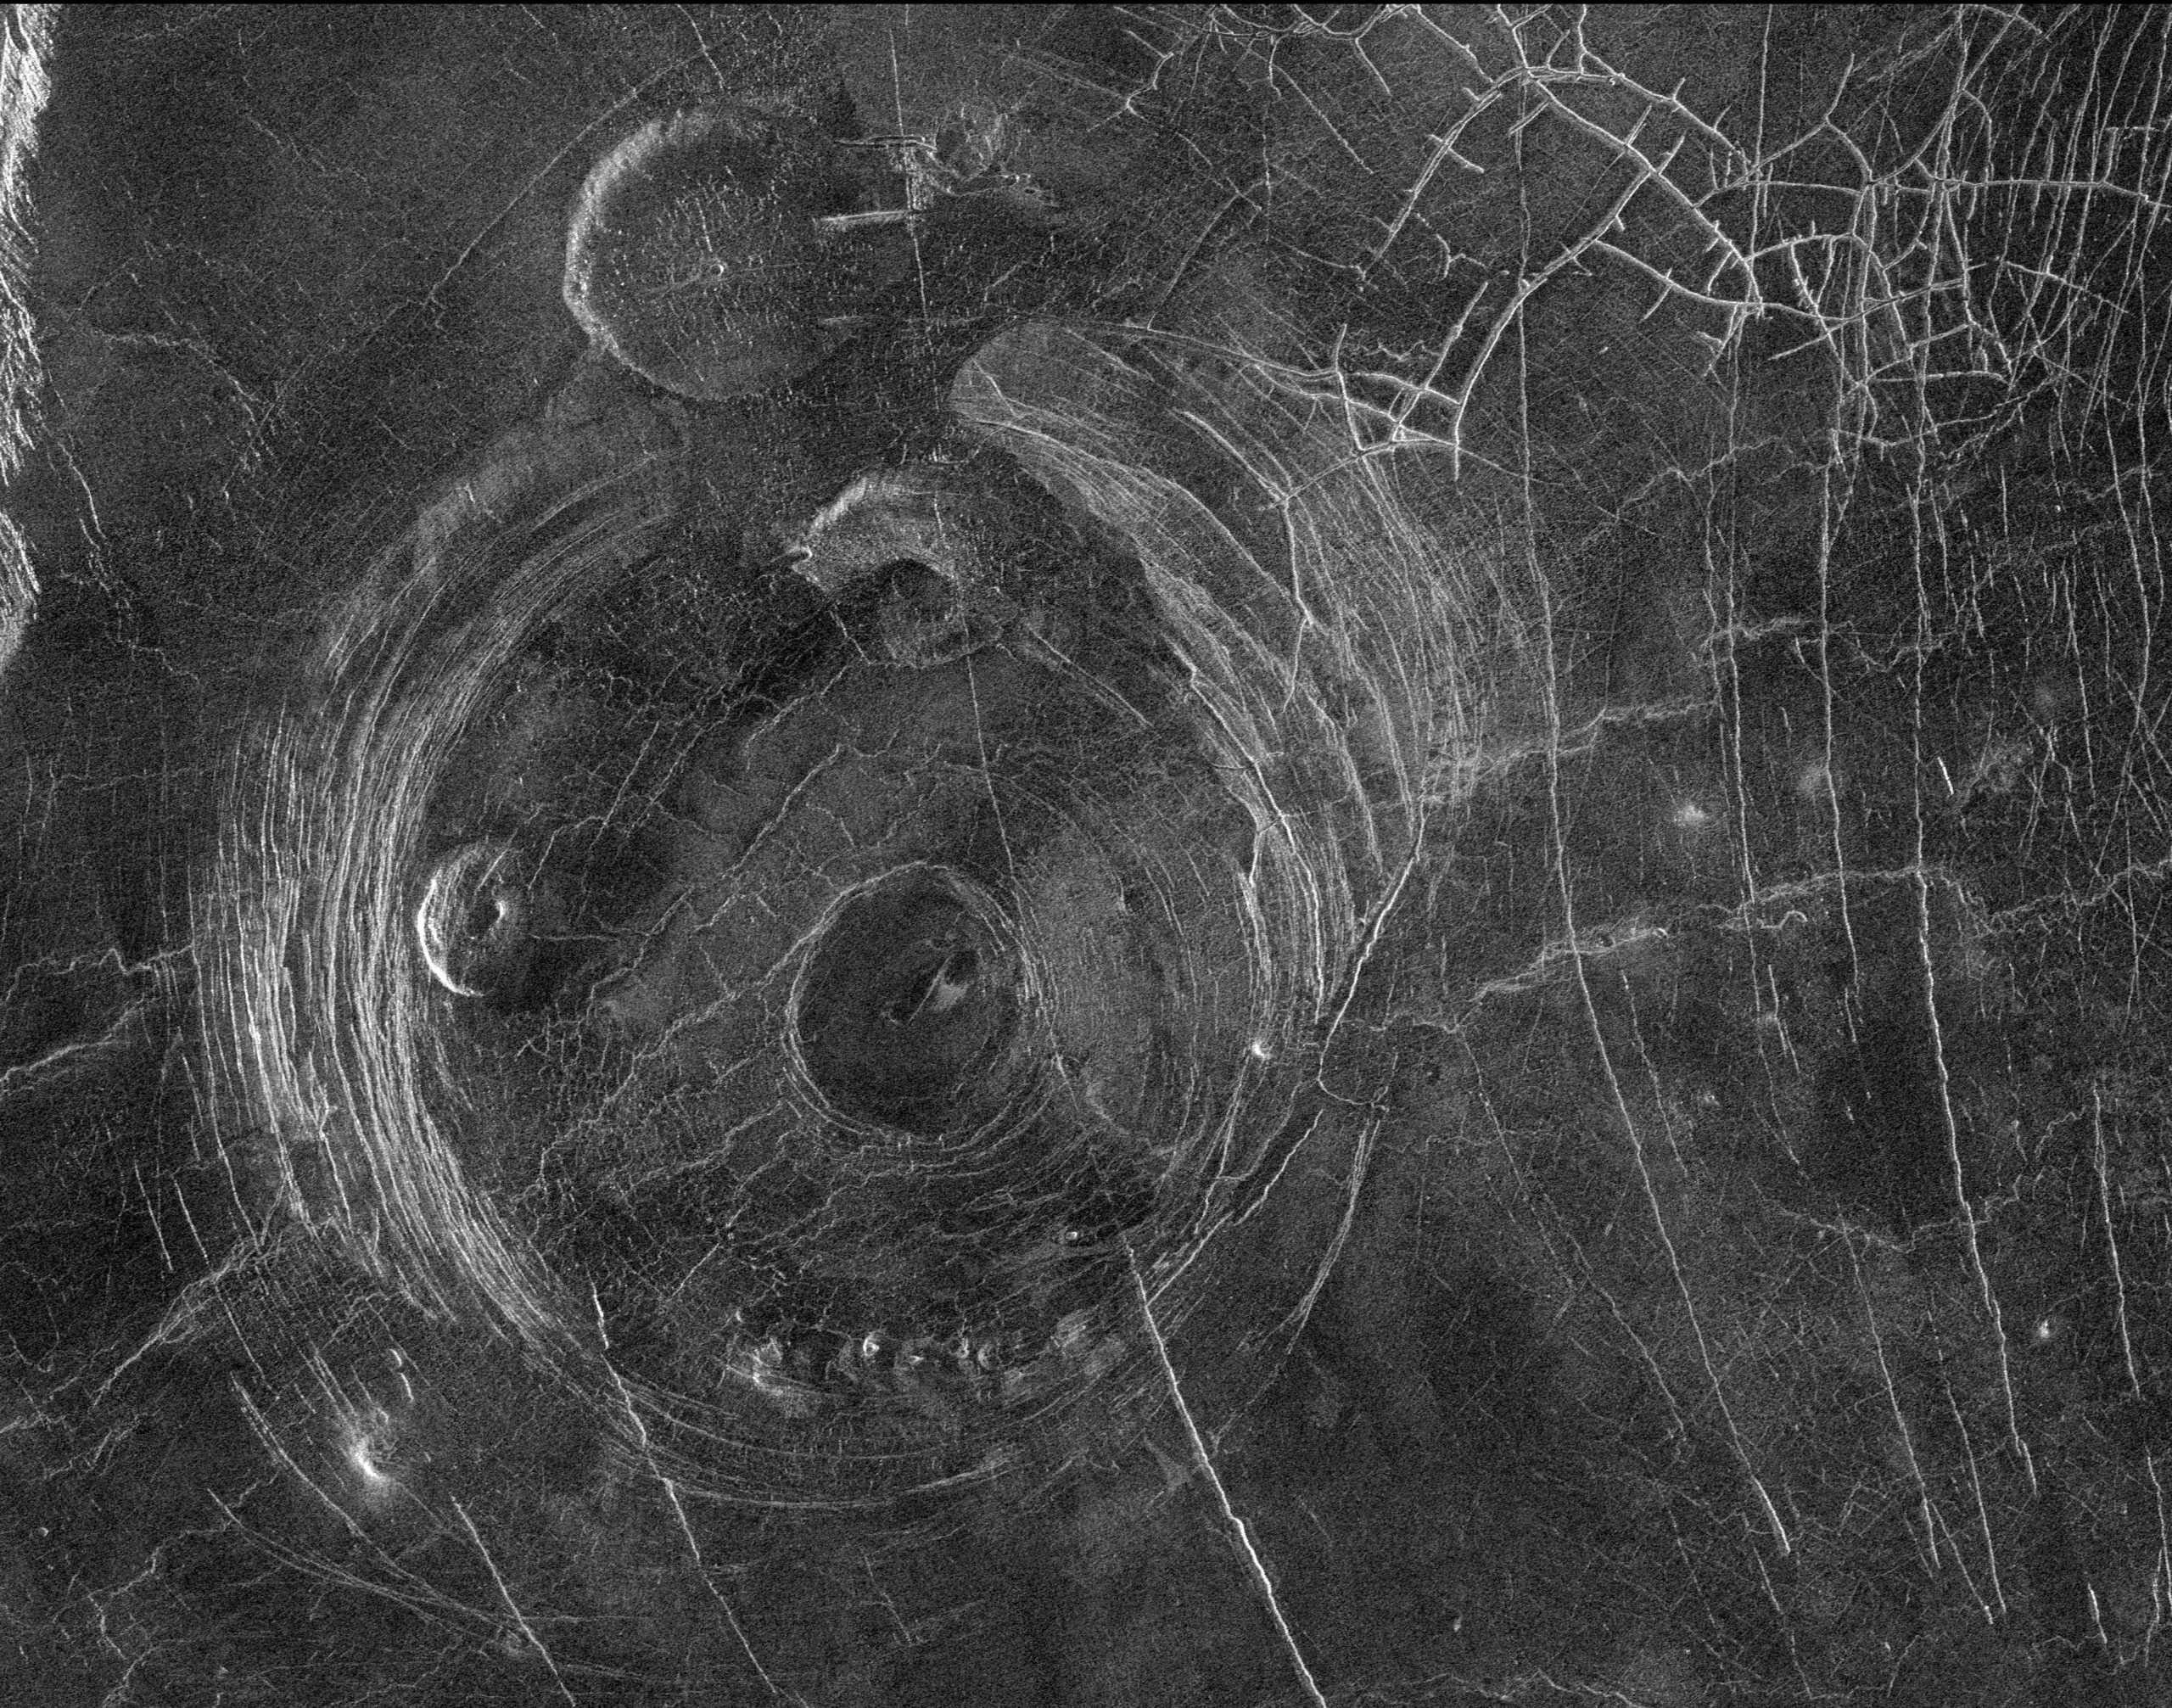
Venus – Aine Corona by NASA/JPL, NASA JPL Media Licence.
The successful Venera landers of the 1970s found themselves on an extraordinarily inhospitable planet, with a surface pressure of 90 bars and a temperature hot enough to melt lead and zinc. Despite these unpleasant conditions, the spacecraft were able to photograph their surroundings and collect surface samples for chemical analysis before their instruments gave out. The diffuse sunlight striking the surface was tinted red by the clouds, and the illumination level was equivalent to a heavy overcast on Earth.
The probes found that the rock in the landing areas is igneous, primarily basalts. Examples of the Venera photographs are shown in Figure 6.27. Each picture shows a flat, desolate landscape with a variety of rocks, some of which may be ejecta from impacts. Other areas show flat, layered lava flows. There have been no further landings on Venus since the 1970s. However, NASA has plans for a radar orbiter with much higher resolution than Magellan, that will focus on the complex structures in the Aphrodite region. Some geologists think this area shows evidence of geologic plates, with past activity analogous to the plate tectonics on Earth.
Surface of Venus
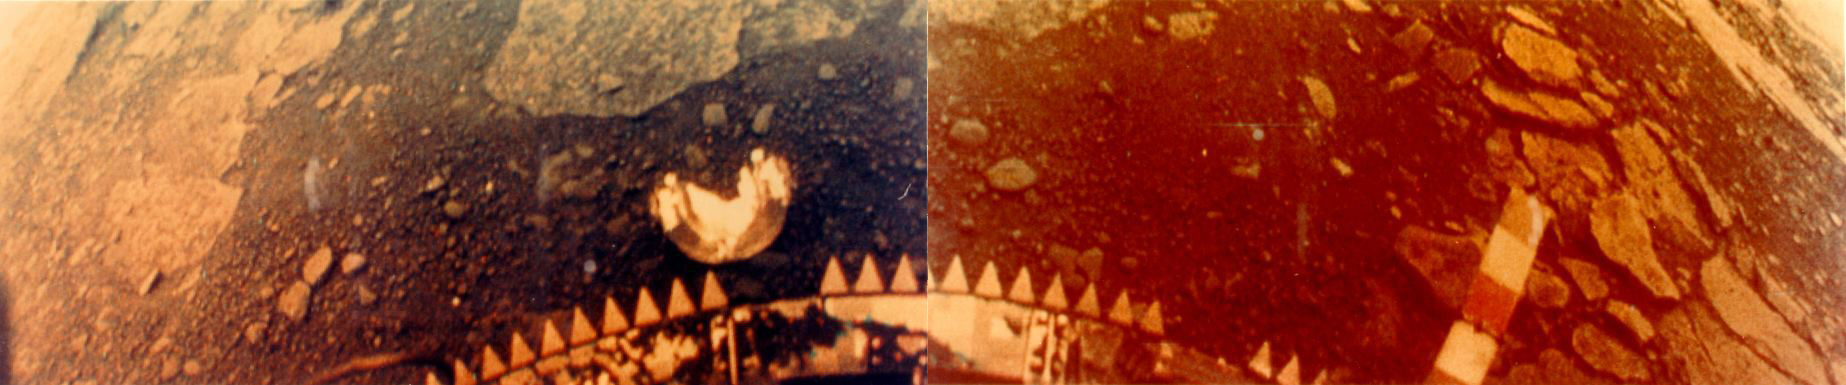
Colour version of the left & right halves of the Venera 13 image by NASA/Russian Space Agency, NASA Media Licence.
The thick atmosphere of Venus produces the high surface temperature and shrouds the surface in a perpetual red twilight. Sunlight does not penetrate directly through the heavy clouds, but the surface is fairly well lit by diffuse light (about the same as the light on Earth under a heavy overcast). The weather at the bottom of this deep atmosphere remains perpetually hot and dry, with calm winds. Because of the heavy blanket of clouds and atmosphere, one spot on the surface of Venus is similar to any other as far as weather is concerned. The most abundant gas on Venus is carbon dioxide (CO2), which accounts for 96% of the atmosphere. The second most common gas is nitrogen. The predominance of carbon dioxide over nitrogen is not surprising when you recall that Earth’s atmosphere would also be mostly carbon dioxide if this gas were not locked up in marine sediments.
Table 6.3 compares the compositions of the atmospheres of Venus, Mars, and Earth. Expressed in this way, as percentages, the proportions of the major gases are very similar for Venus and Mars, but in total quantity, their atmospheres are dramatically different. With its surface pressure of 90 bars, the venusian atmosphere is more than 10,000 times more massive than its martian counterpart. Overall, the atmosphere of Venus is very dry; the absence of water is one of the important ways that Venus differs from Earth.
| Gas | Earth | Venus | Mars |
|---|---|---|---|
| Carbon dioxide (CO2) | 0.03% | 96% | 95.3% |
| Nitrogen (N2) | 78.1% | 3.5% | 2.7% |
| Argon (Ar) | 0.93% | 0.006% | 1.6% |
| Oxygen (O2) | 21.0% | 0.003% | 0.15% |
| Neon (Ne) | 0.002% | 0.001% | 0.0003% |
The atmosphere of Venus has a huge troposphere (region of convection) that extends up to at least 50 kilometres above the surface (Figure 6.28). Within the troposphere, the gas is heated from below and circulates slowly, rising near the equator and descending over the poles. Being at the base of the atmosphere of Venus is something like being a kilometer or more below the ocean surface on Earth. There, the mass of water evens out temperature variations and results in a uniform environment—the same effect the thick atmosphere has on Venus.
Venus’ Atmosphere
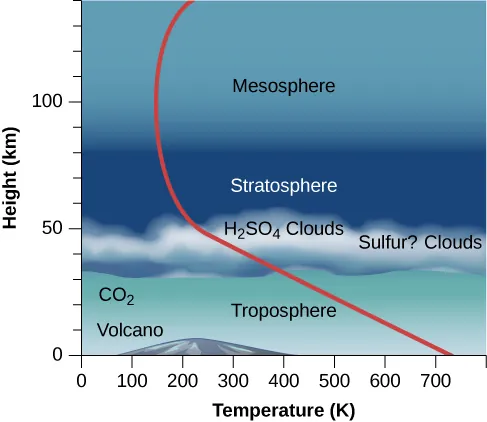
In the upper troposphere, between 30 and 60 kilometres above the surface, a thick cloud layer is composed primarily of sulfuric acid droplets. Sulfuric acid (H2SO4) is formed from the chemical combination of sulfur dioxide (SO2) and water (H2O). In the atmosphere of Earth, sulfur dioxide is one of the primary gases emitted by volcanoes, but it is quickly diluted and washed out by rainfall. In the dry atmosphere of Venus, this unpleasant substance is apparently stable. Below 30 kilometres, the Venus atmosphere is clear of clouds.
The high surface temperature of Venus was discovered by radio astronomers in the late 1950s and confirmed by the Mariner and Venera probes. How can our neighbor planet be so hot? Although Venus is somewhat closer to the Sun than is Earth, its surface is hundreds of degrees hotter than you would expect from the extra sunlight it receives. Scientists wondered what could be heating the surface of Venus to a temperature above 700 K. The answer turned out to be the greenhouse effect.
The greenhouse effect works on Venus just as it does on Earth, but since Venus has so much more CO2—almost a million times more—the effect is much stronger. The thick CO2 acts as a blanket, making it very difficult for the infrared (heat) radiation from the ground to get back into space. As a result, the surface heats up. The energy balance is only restored when the planet is radiating as much energy as it receives from the Sun, but this can happen only when the temperature of the lower atmosphere is very high. One way of thinking of greenhouse heating is that it must raise the surface temperature of Venus until this energy balance is achieved.
Let us try to reconstruct the possible evolution of Venus from an earthlike beginning to its present state. Venus may once have had a climate similar to that of Earth, with moderate temperatures, water oceans, and much of its CO2 dissolved in the ocean or chemically combined with the surface rocks. Then we allow for modest additional heating—by gradual increase in the energy output of the Sun, for example. When we calculate how Venus’ atmosphere would respond to such effects, it turns out that even a small amount of extra heat can lead to increased evaporation of water from the oceans and the release of gas from surface rocks.
This in turn means a further increase in the atmospheric CO2 and H2O, gases that would amplify the greenhouse effect in Venus’ atmosphere. That would lead to still more heat near Venus’ surface and the release of further CO2 and H2O. Unless some other processes intervene, the temperature thus continues to rise. Such a situation is called the runaway greenhouse effect.
Attribution
“10.1 The Nearest Planets: An Overview“, “10.2 The Geology of Venus“, and “10.3 The Massive Atmosphere of Venus” from Astronomy 2e by Andrew Fraknoi, David Morrison, Sidney C. Wolff, © OpenStax – Rice University is licensed under a Creative Commons Attribution 4.0 International License, except where otherwise noted.
