10.4 The Active Sun
Before the invention of the telescope, the Sun was thought to be an unchanging and perfect sphere. We now know that the Sun is in a perpetual state of change: its surface is a seething, bubbling cauldron of hot gas. Areas that are darker and cooler than the rest of the surface come and go. Vast plumes of gas erupt into the chromosphere and corona. Occasionally, there are even giant explosions on the Sun that send enormous streamers of charged particles and energy hurtling toward Earth. When they arrive, these can cause power outages and other serious effects on our planet.
Sunspots
The first evidence that the Sun changes came from studies of sunspots, which are large, dark features seen on the surface of the Sun caused by increased magnetic activity. They look darker because the spots are typically at a temperature of about 3800 K, whereas the bright regions that surround them are at about 5800 K, pictured in Figure 10.14. Occasionally, these spots are large enough to be visible to the unaided eye, and we have records going back over a thousand years from observers who noticed them when haze or mist reduced the Sun’s intensity. (We emphasize what your parents have surely told you: looking at the Sun for even a brief time can cause permanent eye damage. This is the one area of astronomy where we don’t encourage you to do your own observing without getting careful instructions or filters from your instructor.)
Sunspots
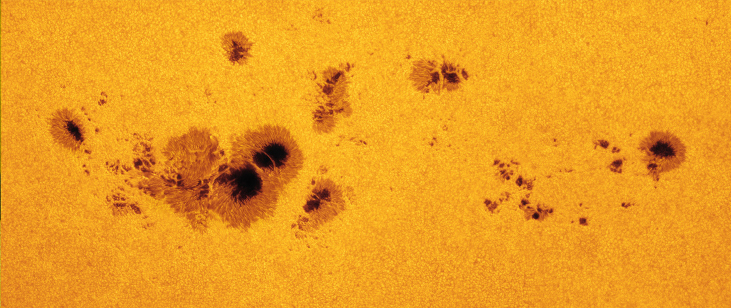
Solar Archipelago by NASA Goddard Space Flight Center, Alan Friedman, CC-BY-4.0
While we understand that sunspots look darker because they are cooler, they are nevertheless hotter than the surfaces of many stars. If they could be removed from the Sun, they would shine brightly. They appear dark only in contrast with the hotter, brighter photosphere around them.
Individual sunspots come and go, with lifetimes that range from a few hours to a few months. If a spot lasts and develops, it usually consists of two parts: an inner darker core, the umbra, and a surrounding less dark region, the penumbra. Many spots become much larger than Earth, and a few, like the largest one shown in Figure 10.14, have reached diametres over 140,000 kilometres. Frequently, spots occur in groups of 2 to 20 or more. The largest groups are very complex and may have over 100 spots. Like storms on Earth, sunspots are not fixed in position, but they drift slowly compared with the Sun’s rotation.
By recording the apparent motions of the sunspots as the turning Sun carried them across its disk as shown Figure 10.15, Galileo, in 1612, demonstrated that the Sun rotates on its axis with a rotation period of approximately 1 month. Our star turns in a west-to-east direction, like the orbital motions of the planets. The Sun, however, is a gas and does not have to rotate rigidly, the way a solid body like Earth does. Modern observations show that the speed of rotation of the Sun varies according to latitude, that is, it’s different as you go north or south of the Sun’s equator. The rotation period is about 25 days at the equator, 28 days at latitude 40°, and 36 days at latitude 80°. We call this behaviour differential rotation.
Sunspots Rotate Across Sun’s Surface

Sunspot series by SOHO/NASA/ESA, NASA Media License.
The Sunspot Cycle
Between 1826 and 1850, Heinrich Schwabe, a German pharmacist and amateur astronomer, kept daily records of the number of sunspots. What he was really looking for was a planet inside the orbit of Mercury, which he hoped to find by observing its dark silhouette as it passed between the Sun and Earth. He failed to find the hoped-for planet, but his diligence paid off with an even-more important discovery: the sunspot cycle. He found that the number of sunspots varied systematically, in cycles about a decade long.
What Schwabe observed was that, although individual spots are short lived, the total number visible on the Sun at any one time was likely to be very much greater at certain times—the periods of sunspot maximum—than at other times—the periods of sunspot minimum. We now know that sunspot maxima occur at an average interval of 11 years, but the intervals between successive maxima have ranged from as short as 9 years to as long as 14 years. During sunspot maxima, more than 100 spots can often be seen at once. Even then, less than one-half of one percent of the Sun’s surface is covered by spots. During sunspot minima, sometimes no spots are visible. The Sun’s activity reached its most recent maximum in 2014.
Sunspots are not the only features that vary during a solar cycle. There are dramatic changes in the chromosphere and corona as well. To see what happens in the chromosphere, we must observe the emission lines from elements such as hydrogen and calcium, which emit useful spectral lines at the temperatures in that layer. The hot corona, on the other hand, can be studied by observations of X-rays and of extreme ultraviolet and other wavelengths at high energies.
Plages and Prominences
As we saw, emission lines of hydrogen and calcium are produced in the hot gases of the chromosphere. Astronomers routinely photograph the Sun through filters that transmit light only at the wavelengths that correspond to these emission lines. Pictures taken through these special filters show bright “clouds” in the chromosphere around sunspots; these bright regions are known as plages, pictured in Figure 10.16. These are regions within the chromosphere that have higher temperature and density than their surroundings. The plages actually contain all of the elements in the Sun, not just hydrogen and calcium. It just happens that the spectral lines of hydrogen and calcium produced by these clouds are bright and easy to observe.
Plages on the Sun
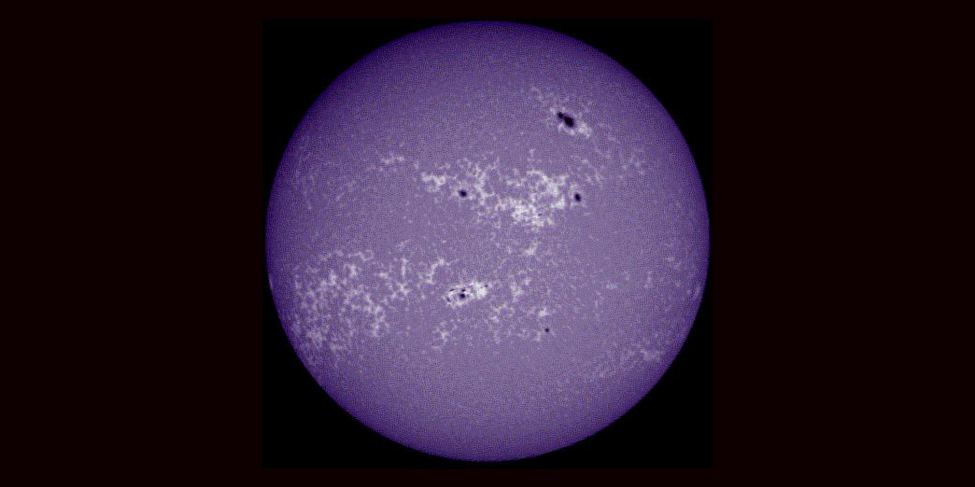
The Chromospheric Network by SOHO/NASA/ESA, NASA Media License.
Moving higher into the Sun’s atmosphere, we come to the spectacular phenomena called prominences, shown in Figure 10.17, which usually originate near sunspots. Eclipse observers often see prominences as red features rising above the eclipsed Sun and reaching high into the corona. Some, the quiescent prominences, are graceful loops of plasma (ionized gas) that can remain nearly stable for many hours or even days. The relatively rare eruptive prominences appear to send matter upward into the corona at high speeds, and the most active surge prominences may move as fast as 1300 kilometres per second (almost 3 million miles per hour). Some eruptive prominences have reached heights of more than 1 million kilometres above the photosphere; Earth would be completely lost inside one of those awesome displays shown in Figure 10.17.
Prominences

Credit a: What is a solar prominence? by SOHO/NASA, NASA Media License
Credit b: Image of a pair of similarly shaped prominences from 11 January 1998 by NASA/SDO, NASA Media License.
Flares and Coronal Mass Ejections
The most violent event on the surface of the Sun is a rapid eruption called a solar flare as pictured in Figure 10.18. A typical flare lasts for 5 to 10 minutes and releases a total amount of energy equivalent to that of perhaps a million hydrogen bombs. The largest flares last for several hours and emit enough energy to power the entire United States at its current rate of electrical consumption for 100,000 years. Near sunspot maximum, small flares occur several times per day, and major ones may occur every few weeks.
Solar Flare
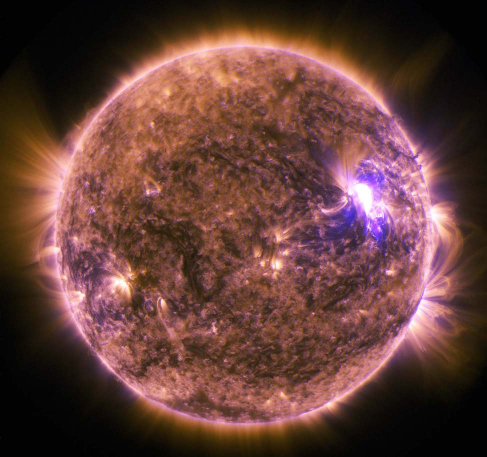
Holiday Lights on the Sun: Imagery of a Solar Flare by NASA/SDO, NASA Media License.
Flares, like the one shown in Figure 10.18, are often observed in the red light of hydrogen, but the visible emission is only a tiny fraction of the energy released when a solar flare explodes. At the moment of the explosion, the matter associated with the flare is heated to temperatures as high as 10 million K. At such high temperatures, a flood of X-ray and ultraviolet radiation is emitted.
Flares seem to occur when magnetic fields pointing in opposite directions release energy by interacting with and destroying each other—much as a stretched rubber band releases energy when it breaks.
What is different about flares is that their magnetic interactions cover a large volume in the solar corona and release a tremendous amount of electromagnetic radiation. In some cases, immense quantities of coronal material—mainly protons and electrons—may also be ejected at high speeds (500–1000 kilometres per second) into interplanetary space. Such a coronal mass ejection (CME) can affect Earth in a number of ways (which we will discuss in the section on space weather).
Flare and Coronal Mass Ejection
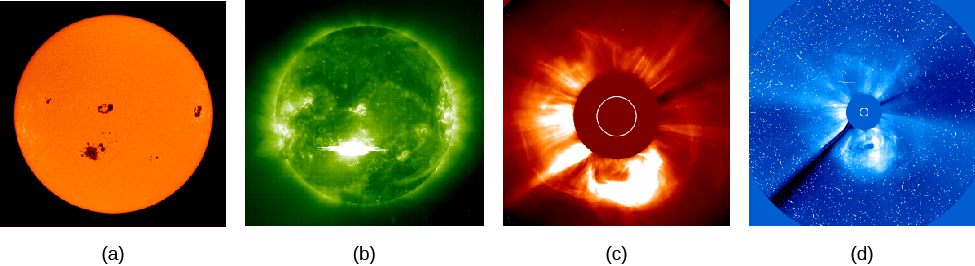
MDI, EIT 195, LASCO C2, C3 CMEs by SOHO/EIT/LASCO/MDI (NASA & ESA), NASA Media License.
Active Regions
To bring the discussion of the last two sections together, astronomers now realize that sunspots, flares, and bright regions in the chromosphere and corona tend to occur together on the Sun in time and space. That is, they all tend to have similar longitudes and latitudes, but they are located at different heights in the atmosphere. Because they all occur together, they vary with the sunspot cycle.
Solar Cycle
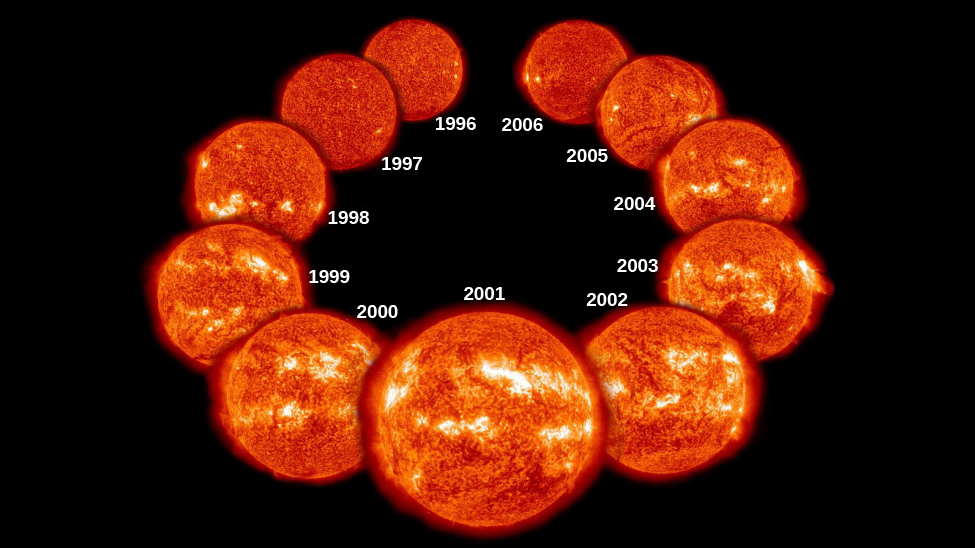
Collage of Solar Cycle 23 by ESA/NASA/SOHO, NASA Media License.
For example, flares are more likely to occur near sunspot maximum, and the corona is much more conspicuous at that time as shown in Figure 10.20. A place on the Sun where a number of these phenomena are seen is called an active region, pictured in Figure 10.21. As you might deduce from our earlier discussion, active regions are always associated with strong magnetic fields.
Solar Active Region Observed at Different Heights in the Sun’s Atmosphere

Modification of image by NASA/SDO/Goddard, NASA Media License.
Attribution
“15.2 The Solar Cycle and Sunspots” and “15.3 Solar Activity above the Photosphere” from Douglas College Astronomy 1105 by Douglas College Department of Physics and Astronomy, is licensed under a Creative Commons Attribution 4.0 International License, except where otherwise noted. Adapted from Astronomy 2e.
