11.2 Classification by Spectra
When the spectra of different stars were first observed, astronomers found that they were not all identical. Since the dark lines are produced by the chemical elements present in the stars, astronomers first thought that the spectra differ from one another because stars are not all made of the same chemical elements. This hypothesis turned out to be wrong. The primary reason that stellar spectra look different is because the stars have different temperatures. Most stars have nearly the same composition as the Sun, with only a few exceptions.
Hydrogen, for example, is by far the most abundant element in most stars. However, lines of hydrogen are not seen in the spectra of the hottest and the coolest stars. In the atmospheres of the hottest stars, hydrogen atoms are completely ionized. Because the electron and the proton are separated, ionized hydrogen cannot produce absorption lines.
In the atmospheres of the coolest stars, hydrogen atoms have their electrons attached and can switch energy levels to produce lines. However, practically all of the hydrogen atoms are in the lowest energy state (unexcited) in these stars and thus can absorb only those photons able to lift an electron from that first energy level to a higher level. Photons with enough energy to do this lie in the ultraviolet part of the electromagnetic spectrum, and there are very few ultraviolet photons in the radiation from a cool star. What this means is that if you observe the spectrum of a very hot or very cool star with a typical telescope on the surface of Earth, the most common element in that star, hydrogen, will show very weak spectral lines or none at all.
The hydrogen lines in the visible part of the spectrum (called Balmer lines) are strongest in stars with intermediate temperatures—not too hot and not too cold. Calculations show that the optimum temperature for producing visible hydrogen lines is about 10,000 K. At this temperature, an appreciable number of hydrogen atoms are excited to the second energy level. They can then absorb additional photons, rise to still-higher levels of excitation, and produce a dark absorption line. Similarly, every other chemical element, in each of its possible stages of ionization, has a characteristic temperature at which it is most effective in producing absorption lines in any particular part of the spectrum.
Astronomers use the patterns of lines observed in stellar spectra to sort stars into a spectral class. Because a star’s temperature determines which absorption lines are present in its spectrum, these spectral classes are a measure of its surface temperature. There are seven standard spectral classes. From hottest to coldest, these seven spectral classes are designated O, B, A, F, G, K, and M. Recently, astronomers have added three additional classes for even cooler objects—L, T, and Y.
At this point, you may be looking at these letters with wonder and asking yourself why astronomers didn’t call the spectral types A, B, C, and so on. You will see, as we tell you the history, that it’s an instance where tradition won out over common sense.
In the 1880s, Williamina Fleming devised a system to classify stars based on the strength of hydrogen absorption lines. Spectra with the strongest lines were classified as “A” stars, the next strongest “B,” and so on down the alphabet to “O” stars, in which the hydrogen lines were very weak. But we saw above that hydrogen lines alone are not a good indicator for classifying stars, since their lines disappear from the visible light spectrum when the stars get too hot or too cold.
In the 1890s, Annie Jump Cannon revised this classification system, focusing on just a few letters from the original system: A, B, F, G, K, M, and O. Instead of starting over, Cannon also rearranged the existing classes—in order of decreasing temperature—into the sequence we have learned: O, B, A, F, G, K, M. She classified around 500,000 stars over her lifetime, classifying up to three stars per minute by looking at the stellar spectra.
To help astronomers remember this crazy order of letters, Cannon created a mnemonic, “Oh Be A Fine Girl, Kiss Me.” (If you prefer, you can easily substitute “Guy” for “Girl.”) Other mnemonics, which we hope will not be relevant for you, include “Oh Brother, Astronomers Frequently Give Killer Midterms” and “Oh Boy, An F Grade Kills Me!” With the new L, T, and Y spectral classes, the mnemonic might be expanded to “Oh Be A Fine Girl (Guy), Kiss Me Like That, Yo!”
Each of these spectral classes, except possibly for the Y class which is still being defined, is further subdivided into 10 subclasses designated by the numbers 0 through 9. A B0 star is the hottest type of B star; a B9 star is the coolest type of B star and is only slightly hotter than an A0 star.
And just one more item of vocabulary: for historical reasons, astronomers call all the elements heavier than helium metals, even though most of them do not show metallic properties. (If you are getting annoyed at the peculiar jargon that astronomers use, just bear in mind that every field of human activity tends to develop its own specialized vocabulary. Just try reading a credit card or social media agreement form these days without training in law.)
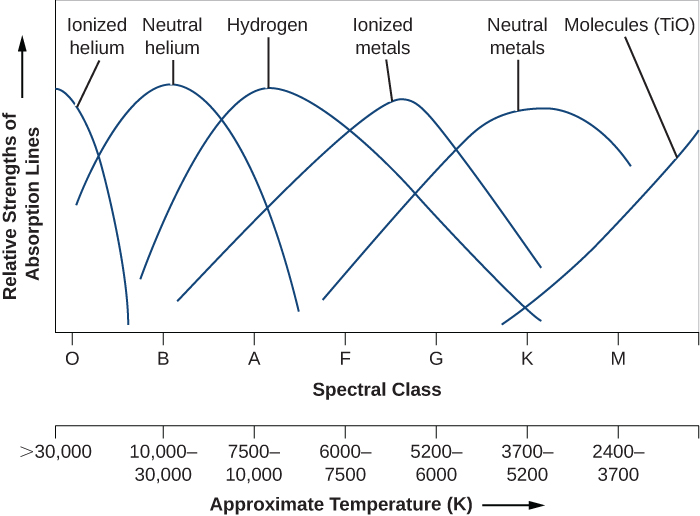
Let’s take a look at some of the details of how the spectra of the stars change with temperature. (It is these details that allowed Annie Cannon to identify the spectral types of stars as quickly as three per minute!) As Figure 11.3 shows, in the hottest O stars (those with temperatures over 28,000 K), only lines of ionized helium and highly ionized atoms of other elements are conspicuous. Hydrogen lines are strongest in A stars with atmospheric temperatures of about 10,000 K. Ionized metals provide the most conspicuous lines in stars with temperatures from 6000 to 7500 K (spectral type F). In the coolest M stars (below 3500 K), absorption bands of titanium oxide and other molecules are very strong. By the way, the spectral class assigned to the Sun is G2. The sequence of spectral classes is summarized in Table 11.2.
Absorption Lines in Stars of Different Temperatures
| Spectral Class | Colour | Approximate Temperature (K) | Principal Features | Examples |
|---|---|---|---|---|
| O | Blue | > 30,000 | Neutral and ionized helium lines, weak hydrogen lines | 10 Lacertae |
| B | Blue-white | 10,000–30,000 | Neutral helium lines, strong hydrogen lines | Rigel, Spica |
| A | White | 7500–10,000 | Strongest hydrogen lines, weak ionized calcium lines, weak ionized metal (e.g., iron, magnesium) lines | Sirius, Vega |
| F | Yellow-white | 6000–7500 | Strong hydrogen lines, strong ionized calcium lines, weak sodium lines, many ionized metal lines | Canopus, Procyon |
| G | Yellow | 5200–6000 | Weaker hydrogen lines, strong ionized calcium lines, strong sodium lines, many lines of ionized and neutral metals | Sun, Capella |
| K | Orange | 3700–5200 | Very weak hydrogen lines, strong ionized calcium lines, strong sodium lines, many lines of neutral metals | Arcturus, Aldebaran |
| M | Red | 2400–3700 | Strong lines of neutral metals and molecular bands of titanium oxide dominate | Betelgeuse, Antares |
| L | Red | 1300–2400 | Metal hydride lines, alkali metal lines (e.g., sodium, potassium, rubidium) | Teide 1 |
| T | Magenta | 700–1300 | Methane lines | Gliese 229B |
| Y | Infrared1 | < 700 | Ammonia lines | WISE 1828+2650 |
To see how spectral classification works, let’s use Figure 11.3. Suppose you have a spectrum in which the hydrogen lines are about half as strong as those seen in an A star. Looking at the lines in our figure, you see that the star could be either a B star or a G star. But if the spectrum also contains helium lines, then it is a B star, whereas if it contains lines of ionized iron and other metals, it must be a G star.
Attribution
“17.3 The Spectra of Stars (and Brown Dwarfs)” from Douglas College Astronomy 1105 by Douglas College Department of Physics and Astronomy, is licensed under a Creative Commons Attribution 4.0 International License, except where otherwise noted. Adapted from Astronomy 2e.
