11.5 The Death of a Sun-like Star
Ant Nebula

Ant Nebula by NASA, ESA and The Hubble Heritage Team (STScI/AURA)), ESA Standard License.
The Sun and other stars cannot last forever. Eventually they will exhaust their nuclear fuel and cease to shine. But how do they change during their long lifetimes? And what do these changes mean for the future of Earth?
We now turn from the birth of stars to the rest of their life stories. This is not an easy task since stars live much longer than astronomers. Thus, we cannot hope to see the life story of any single star unfold before our eyes or telescopes. To learn about their lives, we must survey as many of the stellar inhabitants of the Galaxy as possible. With thoroughness and a little luck, we can catch at least a few of them in each stage of their lives. As you’ve learned, stars have many different characteristics, with the differences sometimes resulting from their different masses, temperatures, and luminosities, and at other times derived from changes that occur as they age. Through a combination of observation and theory, we can use these differences to piece together the life story of a star.
One of the best ways to get a “snapshot” of a group of stars is by plotting their properties on an H–R diagram. We have already used the H–R diagram to follow the evolution of protostars up to the time they reach the main sequence. Now we’ll see what happens next.
Once a star has reached the main-sequence stage of its life, it derives its energy almost entirely from the conversion of hydrogen to helium via the process of nuclear fusion in its core . Since hydrogen is the most abundant element in stars, this process can maintain the star’s equilibrium for a long time. Thus, all stars remain on the main sequence for most of their lives. Some astronomers like to call the main-sequence phase the star’s “prolonged adolescence” or “adulthood” (continuing our analogy to the stages in a human life).
The left-hand edge of the main-sequence band in the H–R diagram is called the zero-age main sequence. We use the term zero-age to mark the time when a star stops contracting, settles onto the main sequence, and begins to fuse hydrogen in its core. The zero-age main sequence is a continuous line in the H–R diagram that shows where stars of different masses but similar chemical composition can be found when they begin to fuse hydrogen.
Since only 0.7% of the hydrogen used in fusion reactions is converted into energy, fusion does not change the total mass of the star appreciably during this long period. It does, however, change the chemical composition in its central regions where nuclear reactions occur: hydrogen is gradually depleted, and helium accumulates. This change of composition changes the luminosity, temperature, size, and interior structure of the star. When a star’s luminosity and temperature begin to change, the point that represents the star on the H–R diagram moves away from the zero-age main sequence.
Calculations show that the temperature and density in the inner region slowly increase as helium accumulates in the centre of a star. As the temperature gets hotter, each proton acquires more energy of motion on average; this means it is more likely to interact with other protons, and as a result, the rate of fusion also increases. For the proton-proton cycle, the rate of fusion goes up roughly as the temperature to the fourth power.
If the rate of fusion goes up, the rate at which energy is being generated also increases, and the luminosity of the star gradually rises. Initially, however, these changes are small, and stars remain within the main-sequence band on the H–R diagram for most of their lifetimes.
Example 11.1
Star Temperature and Rate of Fusion
If a star’s temperature were to double, by what factor would its rate of fusion increase?
Solution
Since the rate of fusion (like temperature) goes up to the fourth power, it would increase by a factor of 24, or 16 times.
Exercise 11.1
If the rate of fusion of a star increased 256 times, by what factor would the temperature increase?
Solution
The temperature would increase by a factor of 2560.25 (that is, the 4th root of 256), or 4 times.
Lifetimes on the Main Sequence
How many years a star remains in the main-sequence band depends on its mass. You might think that a more massive star, having more fuel, would last longer, but it’s not that simple. The lifetime of a star in a particular stage of evolution depends on how much nuclear fuel it has and on how quickly it uses up that fuel. (In the same way, how long people can keep spending money depends not only on how much money they have but also on how quickly they spend it. This is why many lottery winners who go on spending sprees quickly wind up poor again.) In the case of stars, more massive ones use up their fuel much more quickly than stars of low mass.
The reason massive stars are such spendthrifts is that, as we saw above, the rate of fusion depends very strongly on the star’s core temperature. And what determines how hot a star’s central regions get? It is the mass of the star—the weight of the overlying layers determines how high the pressure in the core must be: higher mass requires higher pressure to balance it. Higher pressure, in turn, is produced by higher temperature. The higher the temperature in the central regions, the faster the star races through its storehouse of central hydrogen. Although massive stars have more fuel, they burn it so prodigiously that their lifetimes are much shorter than those of their low-mass counterparts. You can also understand now why the most massive main-sequence stars are also the most luminous. Like new rock stars with their first platinum album, they spend their resources at an astounding rate.
Eventually, all the hydrogen in a star’s core, where it is hot enough for fusion reactions, is used up. The core then contains only helium, “contaminated” by whatever small percentage of heavier elements the star had to begin with. The helium in the core can be thought of as the accumulated “ash” from the nuclear “burning” of hydrogen during the main-sequence stage.
Energy can no longer be generated by hydrogen fusion in the stellar core because the hydrogen is all gone and, as we will see, the fusion of helium requires much higher temperatures. Since the central temperature is not yet high enough to fuse helium, there is no nuclear energy source to supply heat to the central region of the star. The long period of stability now ends, gravity again takes over, and the core begins to contract. Once more, the star’s energy is partially supplied by gravitational energy, in the way described by Kelvin and Helmholtz. As the star’s core shrinks, the energy of the inward-falling material is converted to heat.
The heat generated in this way, like all heat, flows outward to where it is a bit cooler. In the process, the heat raises the temperature of a layer of hydrogen that spent the whole long main-sequence time just outside the core. Like an understudy waiting in the wings of a hit Broadway show for a chance at fame and glory, this hydrogen was almost (but not quite) hot enough to undergo fusion and take part in the main action that sustains the star. Now, the additional heat produced by the shrinking core puts this hydrogen “over the limit,” and a shell of hydrogen nuclei just outside the core becomes hot enough for hydrogen fusion to begin.
New energy produced by fusion of this hydrogen now pours outward from this shell and begins to heat up layers of the star farther out, causing them to expand. Meanwhile, the helium core continues to contract, producing more heat right around it. This leads to more fusion in the shell of fresh hydrogen outside the core as shown in Figure 11.9. The additional fusion produces still more energy, which also flows out into the upper layer of the star.
Star Layers during and after the Main Sequence
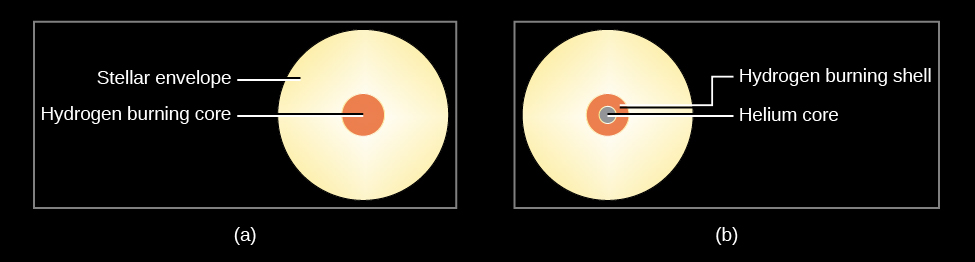
Most stars actually generate more energy each second when they are fusing hydrogen in the shell surrounding the helium core than they did when hydrogen fusion was confined to the central part of the star; thus, they increase in luminosity. With all the new energy pouring outward, the outer layers of the star begin to expand, and the star eventually grows and grows until it reaches enormous proportions as illustrated in Figure 11.10.
Relative Sizes of Stars
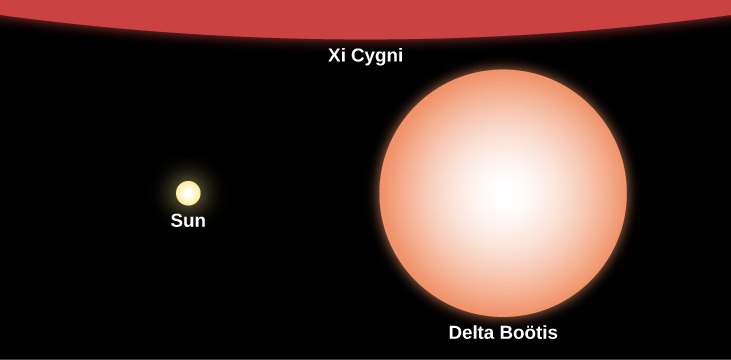
When you take the lid off a pot of boiling water, the steam can expand and it cools down. In the same way, the expansion of a star’s outer layers causes the temperature at the surface to decrease. As it cools, the star’s overall colour becomes redder.
So the star becomes simultaneously more luminous and cooler. On the H–R diagram, the star therefore leaves the main-sequence band and moves upward (brighter) and to the right (cooler surface temperature). Over time, massive stars become red supergiants, and lower-mass stars like the Sun become red giants. You might also say that these stars have “split personalities”: their cores are contracting while their outer layers are expanding. (Note that red giant stars do not actually look deep red; their colours are more like orange or orange-red.)
Just how different are these red giants and supergiants from a main-sequence star? Table 11.5 compares the Sun with the red supergiant Betelgeuse, which is visible above Orion’s belt as the bright red star that marks the hunter’s armpit. Relative to the Sun, this supergiant has a much larger radius, a much lower average density, a cooler surface, and a much hotter core.
| Property | Sun | Betelgeuse |
|---|---|---|
| Mass (2 × 1033 g) | 1 | 16 |
| Radius (km) | 700,000 | 500,000,000 |
| Surface temperature (K) | 5,800 | 3,600 |
| Core temperature (K) | 15,000,000 | 160,000,000 |
| Luminosity (4 × 1026 W) | 1 | 46,000 |
| Average density (g/cm3) | 1.4 | 1.3 × 10⁻⁷ |
| Age (millions of years) | 4,500 | 10 |
Red giants can become so large that if we were to replace the Sun with one of them, its outer atmosphere would extend to the orbit of Mars or even beyond as shown in Figure 11.11. This is the next stage in the life of a star as it moves (to continue our analogy to human lives) from its long period of “youth” and “adulthood” to “old age.” (After all, many human beings today also see their outer layers expand a bit as they get older.) By considering the relative ages of the Sun and Betelgeuse, we can also see that the idea that “bigger stars die faster” is indeed true here. Betelgeuse is a mere 10 million years old, which is relatively young compared with our Sun’s 4.5 billion years, but it is already nearing its death throes as a red supergiant.
Betelgeuse
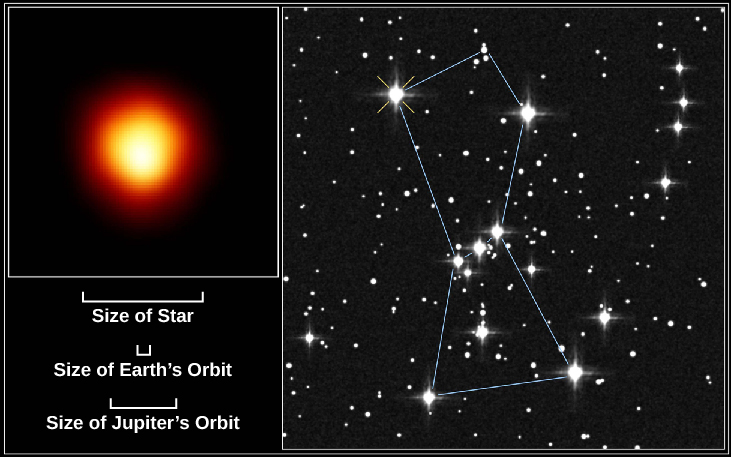
Atmosphere of Betelgeuse by Andrea Dupree (Harvard-Smithsonian CfA), Ronald Gilliland (STScI), NASA and ESA, ESA Standard License.
The “life story” we have related so far applies to almost all stars: each starts as a contracting protostar, then lives most of its life as a stable main-sequence star, and eventually moves off the main sequence toward the red-giant region.
As we have seen, the pace at which each star goes through these stages depends on its mass, with more massive stars evolving more quickly. But after this point, the life stories of stars of different masses diverge, with a wider range of possible behaviour according to their masses, their compositions, and the presence of any nearby companion stars.
Let’s begin by considering stars with composition like that of the Sun and whose initial masses are comparatively low—no more than about twice the mass of our Sun. (Such mass may not seem too low, but stars with masses less than this all behave in a fairly similar fashion. We will see what happens to more massive stars in the next section.) Because there are much more low-mass stars than high-mass stars in the Milky Way, the vast majority of stars—including our Sun—follow the scenario we are about to relate. By the way, we carefully used the term initial masses of stars because, as we will see, stars can lose quite a bit of mass in the process of aging and dying.
Remember that red giants start out with a helium core where no energy generation is taking place, surrounded by a shell where hydrogen is undergoing fusion. The core, having no source of energy to oppose the inward pull of gravity, is shrinking and growing hotter. As time goes on, the temperature in the core can rise to much hotter values than it had in its main-sequence days. Once it reaches a temperature of 100 million K (but not before such point), three helium atoms can begin to fuse to form a single carbon nucleus. This process is called the triple-alpha process, so named because physicists call the nucleus of the helium atom an alpha particle.
When the triple-alpha process begins in low-mass (about 0.8 to 2.0 solar masses) stars, calculations show that the entire core is ignited in a quick burst of fusion called a helium flash. (More massive stars also ignite helium but more gradually and not with a flash.) As soon as the temperature at the centre of the star becomes high enough to start the triple-alpha process, the extra energy released is transmitted quickly through the entire helium core, producing very rapid heating. The heating speeds up the nuclear reactions, which provide more heating, and which accelerates the nuclear reactions even more. We have runaway generation of energy, which reignites the entire helium core in a flash.
You might wonder why the next major step in nuclear fusion in stars involves three helium nuclei and not just two. Although it is a lot easier to get two helium nuclei to collide, the product of this collision is not stable and falls apart very quickly. It takes three helium nuclei coming together simultaneously to make a stable nuclear structure. Given that each helium nucleus has two positive protons and that such protons repel one another, you can begin to see the problem. It takes a temperature of 100 million K to slam three helium nuclei (six protons) together and make them stick. But when that happens, the star produces a carbon nucleus.
Stars in Your Little Finger
Stop reading for a moment and look at your little finger. It’s full of carbon atoms because carbon is a fundamental chemical building block for life on Earth. Each of those carbon atoms was once inside a red giant star and was fused from helium nuclei in the triple-alpha process. All the carbon on Earth—in you, in the charcoal you use for barbecuing, and in the diamonds you might exchange with a loved one—was “cooked up” by previous generations of stars. How the carbon atoms (and other elements) made their way from inside some of those stars to become part of Earth is something we will discuss in the next chapter. For now, we want to emphasize that our description of stellar evolution is, in a very real sense, the story of our own cosmic “roots”—the history of how our own atoms originated among the stars. We are made of “star-stuff.”
After the helium flash, the star, having survived the “energy crisis” that followed the end of the main-sequence stage and the exhaustion of the hydrogen fuel at its centre, finds its balance again. As the star readjusts to the release of energy from the triple-alpha process in its core, its internal structure changes once more: its surface temperature increases and its overall luminosity decreases. The star then continues to fuse the helium in its core for a while, returning to the kind of equilibrium between pressure and gravity that characterized the main-sequence stage. During this time, a newly formed carbon nucleus at the centre of the star can sometimes be joined by another helium nucleus to produce a nucleus of oxygen — another building block of life.
However, at a temperature of 100 million K, the inner core is converting its helium fuel to carbon (and a bit of oxygen) at a rapid rate. Thus, the new period of stability cannot last very long: it is far shorter than the main-sequence stage. Soon, all the helium hot enough for fusion will be used up, just like the hot hydrogen that was used up earlier in the star’s evolution. Once again, the inner core will not be able to generate energy via fusion. Once more, gravity will take over, and the core will start to shrink again. We can think of stellar evolution as a story of a constant struggle against gravitational collapse. A star can avoid collapsing as long as it can tap energy sources, but once any particular fuel is used up, it starts to collapse again.
The star’s situation is analogous to the end of the main-sequence stage (when the central hydrogen got used up), but the star now has a somewhat more complicated structure. Again, the star’s core begins to collapse under its own weight. Heat released by the shrinking of the carbon and oxygen core flows into a shell of helium just above the core. This helium, which had not been hot enough for fusion into carbon earlier, is heated just enough for fusion to begin and to generate a new flow of energy.
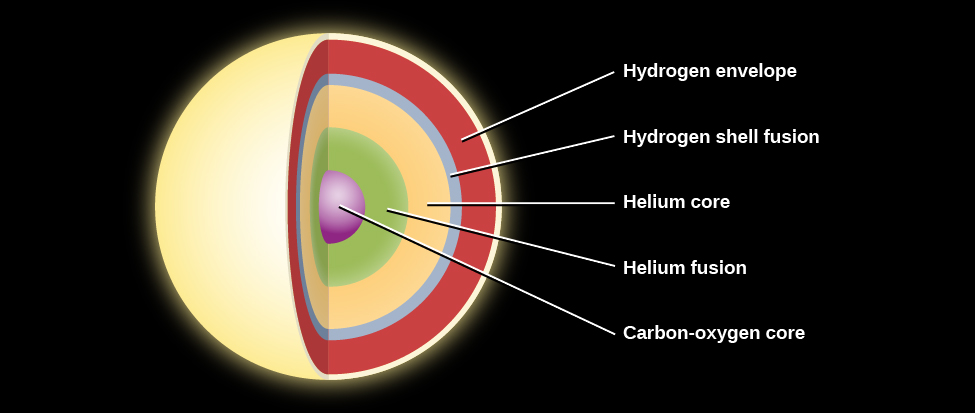
Farther out in the star, there is also a shell where fresh hydrogen has been heated enough to fuse helium. The star now has a multi-layered structure like an onion: a carbon-oxygen core, surrounded by a shell of helium fusion, a layer of helium, a shell of hydrogen fusion, and finally, the extended outer layers of the star as shown in Figure 11.12. As energy flows outward from the two fusion shells, once again the outer regions of the star begin to expand. Its brief period of stability is over; the star moves back to the red-giant domain on the H–R diagram for a short time. But this is a brief and final burst of glory.
Layers inside a Low-Mass Star before Death
Recall that the last time the star was in this predicament, helium fusion came to its rescue. The temperature at the star’s centre eventually became hot enough for the product of the previous step of fusion (helium) to become the fuel for the next step (helium fusing into carbon). But the step after the fusion of helium nuclei requires a temperature so hot that the kinds of lower-mass stars (less than 2 solar masses) we are discussing simply cannot compress their cores to reach it. No further types of fusion are possible for such a star.
In a star with a mass similar to that of the Sun, the formation of a carbon-oxygen core thus marks the end of the generation of nuclear energy at the centre of the star. The star must now confront the fact that its death is near. Table 11.6 summarizes the stages discussed so far in the life of a star with the same mass as that of the Sun. One thing that gives us confidence in our calculations of stellar evolution is that when we make H–R diagrams of older clusters, we actually see stars in each of the stages that we have been discussing.
| Stage | Time in This Stage (years) | Surface Temperature (K) | Luminosity (LSun) | Diameter
(Sun = 1) |
|---|---|---|---|---|
| Main sequence | 11 billion | 6000 | 1 | 1 |
| Becomes red giant | 1.3 billion | 3100 at minimum | 2300 at maximum | 165 |
| Helium fusion | 100 million | 4800 | 50 | 10 |
| Giant again | 20 million | 3100 | 5200 | 180 |
When stars swell up to become red giants, they have very large radii and therefore a low escape velocity. Radiation pressure, stellar pulsations, and violent events like the helium flash can all drive atoms in the outer atmosphere away from the star, and cause it to lose a substantial fraction of its mass into space. Astronomers estimate that by the time a star like the Sun reaches the point of the helium flash, for example, it will have lost as much as 25% of its mass. And it can lose still more mass when it ascends the red-giant branch for the second time. As a result, aging stars are surrounded by one or more expanding shells of gas, each containing as much as 10–20% of the Sun’s mass (or 0.1–0.2 MSun).
When nuclear energy generation in the carbon-oxygen core ceases, the star’s core begins to shrink again and to heat up as it gets more and more compressed. (Remember that this compression will not be halted by another type of fusion in these low-mass stars.) The whole star follows along, shrinking and also becoming very hot—reaching surface temperatures as high as 100,000 K. Such hot stars are very strong sources of stellar winds and ultraviolet radiation, which sweep outward into the shells of material ejected when the star was a red giant. The winds and the ultraviolet radiation heat the shells, ionize them, and set them aglow (just as ultraviolet radiation from hot, young stars produces H II regions).
The result is the creation of some of the most beautiful objects in the cosmos as seen on the gallery of Figure 11.13. These objects were given an extremely misleading name when first found in the eighteenth century: planetary nebulae. The name is derived from the fact that a few planetary nebulae, when viewed through a small telescope, have a round shape bearing a superficial resemblance to planets. Actually, they have nothing to do with planets, but once names are put into regular use in astronomy, it is extremely difficult to change them. There are tens of thousands of planetary nebulae in our own Galaxy, although many are hidden from view because their light is absorbed by interstellar dust.
Gallery of Planetary Nebulae
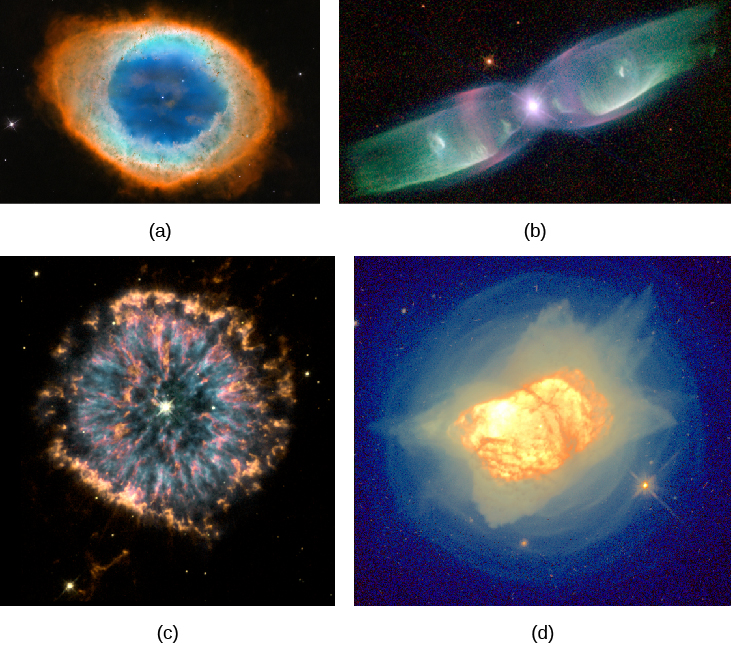
Credit a: Messier 57 (The Ring Nebula) by NASA, ESA, and the Hubble Heritage (STScI/AURA)-ESA/Hubble Collaboration, NASA Media License.
Credit b: Planetary Nebula M-29 by Bruce Balick (University of Washington), Vincent Icke (Leiden University, The Netherlands), Garrelt Mellema (Stockholm University), and NASA, NASA Media License.
Credit c: The Glowing Eye of Planetary Nebula NGC 6751 by NASA, The Hubble Heritage Team (STScI/AURA), NASA Media License.
Credit d: The Stellar Death Process: Planetary Nebula NGC 7027 by H. Bond (STScI) and NASA, NASA Media License.
As shows, sometimes a planetary nebula appears to be a simple ring. Others have faint shells surrounding the bright ring, which is evidence that there were multiple episodes of mass loss when the star was a red giant (see image (d)). In a few cases, we see two lobes of matter flowing in opposite directions. Many astronomers think that a considerable number of planetary nebulae basically consist of the same structure, but that the shape we see depends on the viewing angle as seen on Figure 11.14. According to this idea, the dying star is surrounded by a very dense, doughnut-shaped disk of gas. (Theorists do not yet have a definite explanation for why the dying star should produce this ring, but many believe that binary stars, which are common, are involved.)
Model to Explain the Different Shapes of Planetary Nebulae
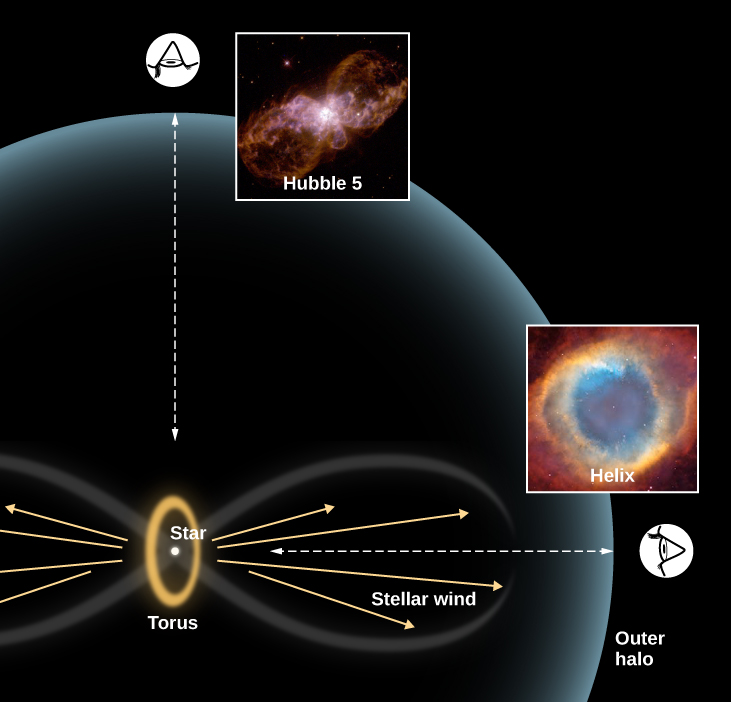
A view of Hubble 5 by Bruce Balick (University of Washington), Vincent Icke (Leiden University, The Netherlands), Garrelt Mellema (Stockholm University), and NASA/ESA,ESA Standard License.
Helix Nebula: HST/CTIO Image by NASA, ESA, C.R. O’Dell (Vanderbilt University), and M. Meixner, P. McCullough), ESA Standard License.
As the star continues to lose mass, any less dense gas that leaves the star cannot penetrate the torus, but the gas can flow outward in directions perpendicular to the disk. If we look perpendicular to the direction of outflow, we see the disk and both of the outward flows. If we look “down the barrel” and into the flows, we see a ring. At intermediate angles, we may see wonderfully complex structures. Compare the viewpoints in the two images above.
Planetary nebula shells usually expand at speeds of 20–30 km/s, and a typical planetary nebula has a diameter of about 1 light-year. If we assume that the gas shell has expanded at a constant speed, we can calculate that the shells of all the planetary nebulae visible to us were ejected within the past 50,000 years at most. After this amount of time, the shells have expanded so much that they are too thin and tenuous to be seen. That’s a pretty short time that each planetary nebula can be observed (when compared to the whole lifetime of the star). Given the number of such nebulae we nevertheless see, we must conclude that a large fraction of all stars evolve through the planetary nebula phase. Since we saw that low-mass stars are much more common than high-mass stars, this confirms our view of planetary nebulae as sort of “last gasp” of low-mass star evolution.
Attribution
“22.0 Thinking Ahead” and “22.1 Evolution from the Main Sequence to Red Giants” from Douglas College Astronomy 1105 by Douglas College Department of Physics and Astronomy, are licensed under a Creative Commons Attribution 4.0 International License, except where otherwise noted. Adapted from Astronomy 2e.
