14.3 Superclusters and Voids
After astronomers discovered clusters of galaxies, they naturally wondered whether there were still larger structures in the universe. Do clusters of galaxies gather together? To answer this question, we must be able to map large parts of the universe in three dimensions. We must know not only the position of each galaxy on the sky (that’s two dimensions) but also its distance from us (the third dimension).
This means we must be able to measure the redshift of each galaxy in our map. Taking a spectrum of each individual galaxy to do this is a much more time-consuming task than simply counting galaxies seen in different directions on the sky, as Hubble did. Today, astronomers have found ways to get the spectra of many galaxies in the same field of view (sometimes hundreds or even thousands at a time) to cut down the time it takes to finish their three-dimensional maps. Larger telescopes are also able to measure the redshifts—and therefore the distances—of much more distant galaxies and (again) to do so much more quickly than previously possible.
Another challenge astronomers faced in deciding how to go about constructing a map of the universe is similar to that confronted by the first team of explorers in a huge, uncharted territory on Earth. Since there is only one band of explorers and an enormous amount of land, they have to make choices about where to go first. One strategy might be to strike out in a straight line in order to get a sense of the terrain. They might, for example, cross some mostly empty prairies and then hit a dense forest. As they make their way through the forest, they learn how thick it is in the direction they are travelling, but not its width to their left or right. Then a river crosses their path; as they wade across, they can measure its width but learn nothing about its length. Still, as they go on in their straight line, they begin to get some sense of what the landscape is like and can make at least part of a map. Other explorers, striking out in other directions, will someday help fill in the remaining parts of that map.
Astronomers have traditionally had to make the same sort of choices. We cannot explore the universe in every direction to infinite “depth” or sensitivity: there are far too many galaxies and far too few telescopes to do the job. But we can pick a single direction or a small slice of the sky and start mapping the galaxies. Margaret Geller, the late John Huchra, and their students at the Harvard-Smithsonian Center for Astrophysics pioneered this technique, and several other groups have extended their work to cover larger volumes of space.
Margaret Geller: Cosmic Surveyor
Born in 1947, Margaret Geller is the daughter of a chemist who encouraged her interest in science and helped her visualize the three-dimensional structure of molecules as a child. (It was a skill that would later come in very handy for visualizing the three-dimensional structure of the universe.) She remembers being bored in elementary school, but she was encouraged to read on her own by her parents. Her recollections also include subtle messages from teachers that mathematics (her strong early interest) was not a field for girls, but she did not allow herself to be deterred.
Geller obtained a BA in physics from the University of California at Berkeley and became the second woman to receive a PhD in physics from Princeton. There, while working with James Peebles, one of the world’s leading cosmologists, she became interested in problems relating to the large-scale structure of the universe. In 1980, she accepted a research position at the Harvard-Smithsonian Center for Astrophysics, one of the nation’s most dynamic institutions for astronomy research. She saw that to make progress in understanding how galaxies and clusters are organized, a far more intensive series of surveys was required. Although it would not bear fruit for many years, Geller and her collaborators began the long, arduous task of mapping the galaxies, she is pictured in Figure 14.2.
Margaret Geller

Margaret J. Geller by Massimo Ramella, Smithsonian Institution Open Access (CC0).
Her team was fortunate to be given access to a telescope that could be dedicated to their project, the 60-inch reflector on Mount Hopkins, near Tucson, Arizona, where they and their assistants took spectra to determine galaxy distances. To get a slice of the universe, they pointed their telescope at a predetermined position in the sky and then let the rotation of Earth bring new galaxies into their field of view. In this way, they measured the positions and redshifts of over 18,000 galaxies and made a wide range of interesting maps to display their data. Their surveys now include “slices” in both the Northern and Southern Hemispheres.
As news of her important work spread beyond the community of astronomers, Geller received a MacArthur Foundation Fellowship in 1990. These fellowships, popularly called “genius awards,” are designed to recognize truly creative work in a wide range of fields. Geller continues to have a strong interest in visualization and has (with filmmaker Boyd Estus) made several award-winning videos explaining her work to nonscientists (one is titled So Many Galaxies . . . So Little Time). She has appeared on a variety of national news and documentary programs, including the MacNeil/Lehrer NewsHour, The Astronomers, and The Infinite Voyage. Energetic and outspoken, she has given talks on her work to many audiences around the country, and works hard to find ways to explain the significance of her pioneering surveys to the public.
“It’s exciting to discover something that nobody’s seen before. [To be] one of the first three people to ever see that slice of the universe [was] sort of being like Columbus. . . . Nobody expected such a striking pattern!”—Margaret Geller
The largest universe mapping project to date is the Sloan Digital Sky Survey (see the feature box Astronomy and Technology: The Sloan Digital Sky Survey at the end of this section). A plot of the distribution of galaxies mapped by the Sloan survey is shown in Figure 14.3. To the surprise of astronomers, maps like the one in the figure showed that clusters of galaxies are not arranged uniformly throughout the universe, but are found in huge filamentary superclusters that look like great arcs of inkblots splattered across a page. The superclusters resemble an irregularly torn sheet of paper or a pancake in shape—they can extend for hundreds of millions of light-years in two dimensions, but are only 10 to 20 million light-years thick in the third dimension. Detailed study of some of these structures shows that their masses are a few times 1016MSun, which is 10,000 times more massive than the Milky Way Galaxy.
Sloan Digital Sky Survey Map of the Large-Scale Structure of the Universe
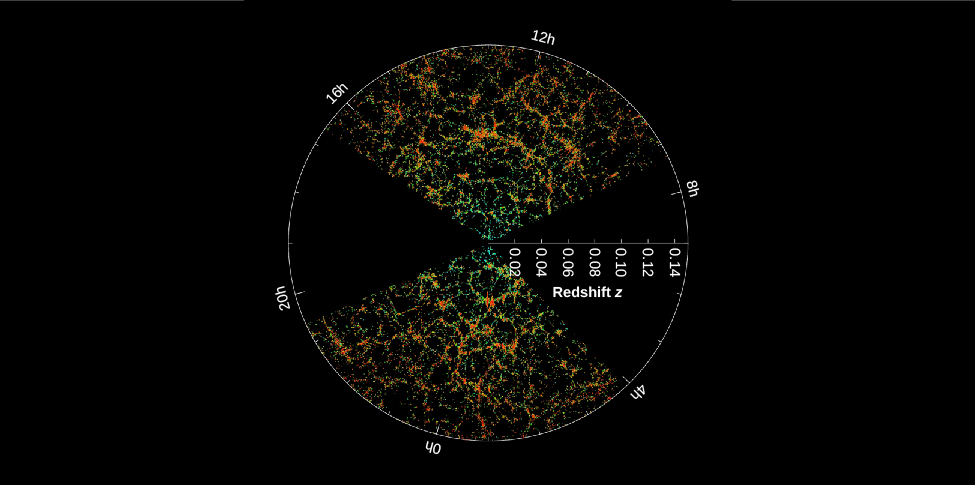
A slice through the SDSS 3-dimensional map of the distribution of galaxies by M. Blanton and the Sloan Digital Sky Survey, NASA Media License.
Separating the filaments and sheets in a supercluster are voids, which look like huge empty bubbles walled in by the great arcs of galaxies. They have typical diametres of 150 million light-years, with the clusters of galaxies concentrated along their walls. The whole arrangement of filaments and voids reminds us of a sponge, the inside of a honeycomb, or a hunk of Swiss cheese with very large holes. If you take a good slice or cross-section through any of these, you will see something that looks roughly like Figure 14.3.
Before these voids were discovered, most astronomers would probably have predicted that the regions between giant clusters of galaxies were filled with many small groups of galaxies, or even with isolated individual galaxies. Careful searches within these voids have found few galaxies of any kind. Apparently, 90 percent of the galaxies occupy less than 10 percent of the volume of space.
Example 14.1
Galaxy Distribution
To determine the distribution of galaxies in three-dimensional space, astronomers have to measure their positions and their redshifts. The larger the volume of space surveyed, the more likely the measurement is a fair sample of the universe as a whole. However, the work involved increases very rapidly as you increase the volume covered by the survey.
Let’s do a quick calculation to see why this is so.
Suppose that you have completed a survey of all the galaxies within 30 million light-years and you now want to survey to 60 million light-years. What volume of space is covered by your second survey? How much larger is this volume than the volume of your first survey? Remember that the volume of a sphere, V, is given by the formula V = 4/3 πR3, where R is the radius of the sphere.
Solution
Since the volume of a sphere depends on R3 and the second survey reaches twice as far in distance, it will cover a volume that is 23 = 8 times larger. The total volume covered by the second survey will be (4/3)π × (60 million light-years)3 = 9 × 10²³ light-years3.
Exercise 14.1
Suppose you now want to expand your survey to 90 million light-years. What volume of space is covered, and how much larger is it than the volume of the second survey?
Solution
The total volume covered is (4/3)π × (90 million light-years)3 = 3.05 × 1024 light-years3. The survey reaches 3 times as far in distance, so it will cover a volume that is 33 = 27 times larger.
Even larger, more sensitive telescopes and surveys are currently being designed and built to peer farther and farther out in space and back in time. The new 50-meter Large Millimeter Telescope in Mexico and the Atacama Large Millimeter Array in Chile can detect far-infrared and millimeter-wave radiation from massive starbursting galaxies at redshifts and thus distances more than 90% of the way back to the Big Bang. These cannot be observed with visible light because their star formation regions are wrapped in clouds of thick dust. And in 2018, the 6.5-meter-diameter James Webb Space Telescope is scheduled to launch. It will be the first new major visible light and near-infrared telescope in space since Hubble was launched more than 25 years earlier. One of the major goals of this telescope is to observe directly the light of the first galaxies and even the first stars to shine, less than half a billion years after the Big Bang.
At this point, you may be wondering what exactly in the Sloan Sky Map above is expanding. We know that the galaxies and clusters of galaxies are held together by their gravity and do not expand as the universe does. However, the voids do grow larger and the filaments move farther apart as space stretches.
Astronomy and Technology: The Sloan Digital Sky Survey
In Edwin Hubble’s day, spectra of galaxies had to be taken one at a time. The faint light of a distant galaxy gathered by a large telescope was put through a slit, and then a spectrometer (also called a spectrograph) was used to separate the colours and record the spectrum. This was a laborious process, ill suited to the demands of making large-scale maps that require the redshifts of many thousands of galaxies.
But new technology has come to the rescue of astronomers who seek three-dimensional maps of the universe of galaxies. One ambitious survey of the sky was produced using a special telescope, camera, and spectrograph atop the Sacramento Mountains of New Mexico. Called the Sloan Digital Sky Survey (SDSS), after the foundation that provided a large part of the funding, the program used a 2.5-meter telescope (about the same aperture as the Hubble) as a wide-angle astronomical camera. During a mapping program lasting more than ten years, astronomers used the SDSS’s 30 charge-coupled devices (CCDs)—sensitive electronic light detectors similar to those used in many digital cameras and cell phones—to take images of over 500 million objects and spectra of over 3 million, covering more than one-quarter of the celestial sphere. Like many large projects in modern science, the Sloan Survey involved scientists and engineers from many different institutions, ranging from universities to national laboratories.
Every clear night for more than a decade, astronomers used the instrument to make images recording the position and brightness of celestial objects in long strips of the sky. The information in each strip was digitally recorded and preserved for future generations. When the seeing was only adequate, the telescope was used for taking spectra of galaxies and quasars—but it did so for up to 640 objects at a time.
The key to the success of the project was a series of optical fibers, thin tubes of flexible glass that can transmit light from a source to the CCD that then records the spectrum. After taking images of a part of the sky and identifying which objects are galaxies, project scientists drilled an aluminum plate with holes for attaching fibers at the location of each galaxy. The telescope was then pointed at the right section of the sky, and the fibers led the light of each galaxy to the spectrometer for individual recording, shown in Figure 14.4.
Sloan Digital Sky Survey
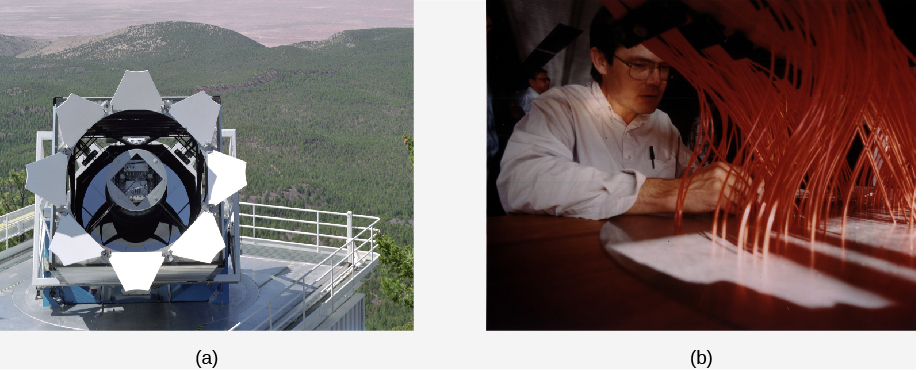
Credit a: Telescope and mountains by Sloan Digital Sky Survey, SDSS Image Usage Policy.
Credit b: Plug Plate Array by Sloan Digital Sky Survey, SDSS Image Usage Policy.
About an hour was sufficient for each set of spectra, and the pre-drilled aluminum plates could be switched quickly. Thus, it was possible to take as many as 5000 spectra in one night (provided the weather was good enough).
The galaxy survey led to a more comprehensive map of the sky than has ever before been possible, allowing astronomers to test their ideas about large-scale structure and the evolution of galaxies against an impressive array of real data.
The information recorded by the Sloan Survey staggers the imagination. The data came in at 8 megabytes per second (this means 8 million individual numbers or characters every second). Over the course of the project, scientists recorded over 15 terabytes, or 15 thousand billion bytes, which they estimate is comparable to the information contained in the Library of Congress. Organizing and sorting this volume of data and extracting the useful scientific results it contains is a formidable challenge, even in our information age. Like many other fields, astronomy has now entered an era of “Big Data,” requiring supercomputers and advanced computer algorithms to sift through all those terabytes of data efficiently.
One very successful solution to the challenge of dealing with such large datasets is to turn to “citizen science,” or crowd-sourcing, an approach the SDSS helped pioneer. The human eye is very good at recognizing subtle differences among shapes, such as between two different spiral galaxies, while computers often fail at such tasks. When Sloan project astronomers wanted to catalog the shapes of some of the millions of galaxies in their new images, they launched the “Galaxy Zoo” project: volunteers around the world were given a short training course online, then were provided with a few dozen galaxy images to classify by eye. The project was wildly successful, resulting in over 40 million galaxy classifications by more than 100,000 volunteers and the discovery of whole new types of galaxies.
Attribution
“28.3 The Distribution of Galaxies in Space” from Douglas College Astronomy 1105 by Douglas College Department of Physics and Astronomy, is licensed under a Creative Commons Attribution 4.0 International License, except where otherwise noted. Adapted from Astronomy 2e.
