The History and Definition of GIS
Defining GIS: Layers and Multiplicities
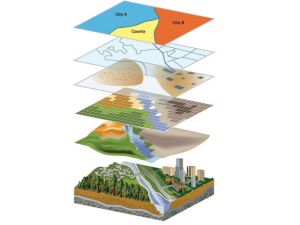
There is no unified definition of geographic information systems (GIS). “Geographical information” can refer to many things, including but not limited to the location of a given entity or an indication of what might be found at a particular location. The word “system”is an important indicator of its many components, including some combination of “computer hardware, software, geospatial data and other information” (Bonnell and Fortin, 2014: x). Geospatial data are data that include a location, which can be geocoded, mapped, and analyzed through GIS software as a series of digital layers (Gieseking, 2018). The layers typically represent specific themes that can be arranged through a foundational GIS technique called “overlay,” which enables users to superimpose data sets and rearrange them to examine or represent spatial relationships (see Fig. 1). For an example of how overlay can produce transparent layers with attribute data highlighting traditional Indigenous territories and languages, see Native Land Digital.
Although often used interchangeably, mapping and spatial analysis are two distinct approaches that are often combined in synergistic ways through GIS-based research. GIS (as a tool of spatial analysis) was initially misunderstood to be computerized cartography; however, it is now recognized that spatial analysis generates more information or knowledge than can be expressed from maps or data alone. The integrative functionality of GIS, which goes beyond traditional mapping, means that it should also be understood as a process that involves dynamic change. GIS processes typically include some variation of data input, storage, transformation, analysis, modeling, and communication, although research design begins much earlier than data input. Outputs of GIS-based research may include digital maps, atlases, other spatial imagery, graphs, reports, scholarly publications, websites, news media, and art.
As social and technological developments have occurred, so indeed have the capacities and definitions of GIS (Schuurman, 2009: 281). There is general consensus that, rather than being end products, GIS are integrative research tools that combine geospatial inquiry, analysis, and knowledge mobilization (Gregory & Ell, 2007; Gieseking, 2018). The past decade has highlighted enhanced capabilities for interactivity, multimedia storytelling, and interdisciplinary, art-science collaborations, examples of which will be addressed later in this module as well as throughout the course. These capacities mark a shift from earlier positivistic uses and definitions of GIS that were more heavily grounded in quantitative, scientific, and modernistic approaches such as spatial analysis and modeling.
Indeed, in academic and community settings, GIS has become a useful storytelling tool that (re-)locates and (re-)narrates place and helps situate diverse histories within particular spatial and temporal relationships. In calling GIS a storytelling tool, we are doing at least two things: 1) recognizing that data, analytical techniques, and digital maps can be part of storytelling and other knowledge mobilization practices; and 2) challenging the positivist and “Gods eye view” assumptions in GIScience by highlighting the qualitative, humanistic, contextual, emotional, and material aspects of GIS. This is not to suggest that scientific techniques, knowledges, and analysis are not important or useful in GIS-based storytelling, but rather that DH GIS presents openings for more diverse and inclusive storytelling about place.
Brief Histories of GIS: Uses, Waves and Legacies
When considering how GIS is used for historical inquiry and storytelling, it is also valuable to consider some of the histories of GIS, as well as the debates that responded to and shaped its use. Indeed, as Nadine Schuurman’s GIS entry for the Dictionary of Human Geography states, “the diversity of GIS use is rooted in its history” (280). Despite the relative recency of GIS compared to other geospatial tools, histories of GIS are extensive and a detailed overview would take up more space than this module provides. Here, we will touch briefly upon some of these histories, with specific reference to the waves of critiques and debates that shaped how GIS has been taken up across the humanities and social sciences. See the Further Reading section for more in-depth literature on these histories.
The history of GIS as a tool of geographic information management and manipulation includes Canada as a forerunner, specifically through the development of the Canada Geographic Information System (CGIS). CGIS director and developer, Roger Tomlinson, summarized how the first computerized GIS came to be in a blog post (paraphrased from a chapter by Tomlinson & Toomey, 1999):
At the heart of the innovations that led to the Canada Geographic Information System was the fundamental idea of using computers to ask questions of maps and to render useful information from them. To do this, maps had to be in digital form. This led to the idea that many digital maps could be stitched together to represent the whole of Canada and that the maps could be linked intelligently to digital databases of statistics, such as the Census.
As Bonnell and Fortin explain in their introductory chapter to Historical GIS Research in Canada, the CGIS was initially devised in the 1960s (and developed throughout the 1970s) as a land and geospatial data management tool for the Canada Land Inventory (CLI). Like many GIS projects today, it served as a repository that housed thousands of maps covering millions of square kilometres of land and water. The CGIS shaped how land and water (and thus its inhabitants) were categorized, the legacies of which are still used and felt in the present. Critical approaches to the histories of GIS in Canada must therefore include an understanding of not just what GIS afforded, but to whom, what, and where. Despite the intent of developers, early GIS-based initiatives like the CGIS undoubtedly shaped the historical geographies of colonialism, including the more harmful effects of displacement and dispossession.
“Advancements” in geospatial methods and analysis were inseparable from other social and geographical forces, including (sub)urbanization, modernism, and capitalism. For example, one of the core methodologies of GIS, the concept of overlay, was developed in the 1960s and is typically attributed to Ian Harg, a landscape architect. Harg came up with the technique while searching for a highway route that would facilitate suburban development. Overlay continues to be a foundational component of GIS design, enhanced through more recent tools like transparency/opacity sliders. As is frequently the case, however, a solution to a particular problem (for example, Harg’s problem of optimal routes for suburbanization or spatially organizing large swaths of land) exacerbated other systemic problems that often deepened social inequality.
One example is the role of GIS in the redlining of American neighbourhoods. Redlining refers to a racist New Deal policy that enabled the Federal Housing Administration to refuse to insure mortgages in predominantly Black neighbourhoods, resulting in further segregation through the unequal allocation of services to particular communities (Rothstein, 2017). While many critical scholars have used GIS as a tool to expose the racist and classist underpinnings of urban policy, GIS was – and continues to be – a political tool used by some institutions to further entrench social inequalities (including gerrymandering, gentrification, and redlining). To learn more about redlining in the US through a GIS-based collaboration, visit Mapping Inequality: Redlining in New Deal Americavia the Digital Scholarship Lab portal, led by scholars at the University of Richmond (see also Heppler, 2018, for a journal article describing the project).
In addition to shaping urban renewal and segregation, historians of GIS also point to its early use as a military technology. Caren Kaplan explains that, as well as being used for neighbourhood classification and targeted marketing, GIS was one of the most pervasive tools of militarization in U.S. contemporary culture. GIS has therefore been used to create and uphold systems of militarism, and in so doing has had serious and often harmful effects on the places, people, and practices shaped by military presence (in both physical and digital ways). Critical geographers have warned against accepting GIS uncritically, or “as-is”; doing so might only reinforce militarization, corporatization, and colonialism that shaped its origins (Gieseking, 2018: 642).
A critical historical approach to GIS must therefore include questions about how GIS was used, funded, operationalized in the past and the legacies that continue today. Like all tools of knowledge production, any use of GIS for research is always political, even if the purpose of using GIS is to challenge its past uses and promote social change or inclusivity. In the next section, we will examine some of the waves and debates that have shaped DH GIS research over the past few decades and into the present.
1990s-2000s: Key waves (of critiques)
GIS is now widely used across the humanities and social sciences, but its origins in primarily quantitative, scientific, and data-heavy research environments has led to waves of critiques. Although GIS critiques occurred long before and after the 1990s, Nadine Schuurman highlights the 1990s as the decade that marked a noticeable change in intensity of debate. The first wave, from roughly 1990 to 1994, has also been characterized by a focus on positivism, which foregrounded observable, scientific “fact” as “authentic” knowledge while denying other forms of non-scientific knowledge (Barnes, 2009; Sui, 1994). This wave was marked by notable tensions between (GIS and non-GIS) scholars and GIS practitioners. Around 1995, as initiatives to examine the social effects of GIS (as well as the use of GIS to study social phenomena) emerged, historians of GIS have noted greater collaboration between critics and practitioners. Toward the end of the decade, alongside other shifts in social theory and technological change, debates shifted somewhat to address the effects of GIS technology in the broader world and for particular communities.
Since the 2000s, there has been a more dedicated shift to collaborative, public, and participatory GIS projects (see Boll-Bosse and Hankins, 2018). Community-oriented mapping and GIS projects in the digital humanities (what Gieseking calls “DH GIS”) have proliferated with an increasing focus on place-based research, art-science collaborations, and projects intended to promote social change. As GIS software becomes increasingly user-friendly and (in some cases) open-access, more crowd-sourced HGIS projects have also emerged. Built-in applications for adding photographs or commentary to a particular location on a digital map, for example, provide opportunities for more nuanced, situated, and inclusive storytelling. Of course, these are not without their challenges: at least some GIS training and expertise is still required to manage the platforms for DH GIS projects, and privacy and ethics issues must be navigated with care. Although much more can be written about GIS in the last two decades, we will instead highlight the shift toward participatory and storytelling approaches through the incorporation of examples of DH GIS projects throughout this course.
