Lab 5 – Spatial Storytelling for the Digital Humanities: Capstone Project
Introduction
So far, this course has introduced you to some of the theories and methods behind the use of spatial data and maps for storytelling in the digital humanities. While the focus has been on history, we hope that you can see how these theoretical considerations and techniques could also apply to other areas of the humanities. Now, it is time to take what you have learned and use it to create a digital humanities project of your own.
Throughout this course, you have been shown examples of storymaps; that is, digital narratives which include maps as a key component. As the capstone project for this course, you will design your own digital spatial narrative.
Capstone Project Requirements
Submit a digital spatial narrative of around 1500 words. You may choose the topic, but it should be related to the humanities in some way, and of course, must have a spatial component. If you are stuck for ideas, take a look at the examples in Appendix 1 for some inspiration. The style of this narrative should be suitable for publication as a research blog; you may use informal language, but should be sure to back up your text with appropriate sources. If you are uncertain what constitutes a research blog, the Network in Canadian History & Environment (NiCHE) have many examples on their website [https://niche-canada.org/], including this example which you saw in the archives lab, about dendrochronology and other-than-human archives [https://niche-canada.org/2021/03/03/learning-to-read-the-more-than-human-archives-dendrochronology-and-talkative-trees/].
Format
You may submit your research blog as a text document with integrated maps and images. Please format it to look as you would want it to appear to readers accessing the text online. Alternately, you may submit an actual online blog post, or a storymap built with the tools listed in Appendix 2. Please note that these tools require an account to use, so creating a storymap, while excellent experience for those of you interested in current trends in spatial storytelling techniques, is not mandatory.
Critical Content
This course has discussed the power of spatial narratives, both to cause and to repair or make amends for harm, at great length. The text and mapping in your narrative must in some way acknowledge these structures and relationships of power, and show critical reflection on these topics. We would suggest that a key component of such critical reflection is translating awareness into action! As such, you may wish to create your narrative with specific goals, such as decolonization or increased accessibility, in mind. Your reflection can include (but must not be limited to) a discussion of your own power in creating this narrative. In particular, you may wish to reflect on your positionality and connection to the topic, and how your choices regarding aesthetics and narrative devices contribute to the narrative’s goals.
Maps
Your research blog must contain at least three maps that you have built using GIS software. This could include maps you have georeferenced and overlain on a base map, or maps of points and polygons that you have created. You are welcome to include screenshots of maps that are created in google maps or google earth, but at least one of your maps should be created using another platform, such as QGIS, or one of the storymapping tools in Appendix 2. If you are making maps in QGIS, you may wish to consider applying some of the cartography tips in Appendix 3.
Additional storytelling tools
You are welcome, and indeed encouraged, to make use of graphics and multimedia files to help tell your story. These could include historical maps, images, videos, and sound recordings. You could even include sketch maps or other maps not created with GIS software, if these are able to make a point better than a GIS map would. If you are submitting your “blog” as a text document, you may wish to include links to the multimedia files, along with a placeholder image to show where they would be embedded in an actual published blog post.
Sources
You should cite at least six sources for your blog. At least two of these must be primary sources, which is to say, documents written or created by observers of or participants in the event you are discussing, rather than the writings of others describing or analyzing that topic later. Primary sources could include things like historical travel narratives, or in more modern terms, social media posts created during an event.
In addition to these six sources, you should cite the sources for all of your spatial data, images, and multimedia files.
Appendix 1: Spatial Narrative Examples
There are many examples of spatial narratives told using ESRI technology in ESRI’s StoryMap Gallery [https://storymaps-classic.arcgis.com/en/gallery/#s=60]. StoryMapJS also has some examples of projects built with their platform on their website [https://storymap.knightlab.com/#examples]. These are not necessarily humanities projects, but do give you some idea of the possibilities of spatial storytelling.
Moving closer to the humanities, a number of projects by Nipisisng University’s Centre for Understanding Semi-Peripheries (CUSP) have been discussed throughout this course, and can be accessed from the centre’s portal [https://cusp.maps.arcgis.com/apps/MapSeries/index.html?appid=6475de8ff85a4c7b9a2b4be500d99605]. These projects exist in the overlap between the fields of history and geography (described as either historical geography or environmental history, depending on who you ask), and some are more obviously related to the humanities than others.
Finally, there is an extensive list of digital humanities GIS projects at this blog [http://anterotesis.com/wordpress/mapping-resources/dh-gis-projects/]. At the time of writing, the blog post had last been updated in April of 2021, so some links may not be up to date.
Appendix 2: Storymapping Tools
Google Earth
If you have a google account, you can create a combined digital tour and slideshow using Google Earth. This was discussed briefly in the lab on spatializing historical narratives. Google provides a tutorial if you would like to explore this option [https://www.google.com/earth/outreach/learn/create-a-map-or-story-in-google-earth-web/].
StoryMapJS
StoryMapJS [https://storymap.knightlab.com/] is a free tool developed by Chicago’s Northwestern University, which allows you to create slightly more complex story maps than are possible with Google Earth. Particularly useful is the ability to embed your story maps into a webpage. It is also possible to customize your basemap. StorymapJS requires a Google account, because the maps it creates will be stored on your Google Drive. The home page has several examples of maps built using this platform for you to explore.
There are many online tutorials for this platform; this series includes both text and video instructions [https://grantstracks.com/category/tutorials/mapping/].
ESRI StoryMaps
Additionally, it is possible for you to create some basic story maps using ESRI’s platform. Note that you will need to create an account, and that the free version has limited functionality. However, you will be able to upload shapefiles created using QGIS. This is the most customizable of the free storymapping options, which can be both a blessing and a curse – it is possible to make your maps look exactly how you want them to, but it takes some time to figure out all the options. ESRI’s beginner tutorial is available here [https://storymaps.arcgis.com/stories/cea22a609a1d4cccb8d54c650b595bc4]
Appendix 3: Effective Maps
Symbology
One important aspect of making maps that communicate well is your choice of symbols. This is a complex topic, and can be more akin to graphic design or applied psychology than geography or humanities research! In brief, people looking at a map will make assumptions about what the symbols mean, based on their shape, size, and color. For example, they might assume that a large area of blue represents water, while green is forest and grey is urban. They might assume that in a set of lines of different thicknesses, the thickest line represents the biggest or most important feature. They might equally assume that red points indicate something bad, while green points indicate something good. These assumptions aren’t universal, and there may be times when it is necessary to ignore them, but in general, trying to work with them rather than against them can help you communicate information more effectively.
If you need a reminder of how to change your map symbols, refer to the spatializing historical narratives lab.
Map Objects
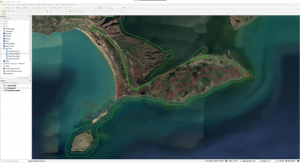
Consider the screenshot shown in figure 1 without reading the caption. Do you know what the map is showing you, or what I want you to understand from it? Unless you have looked at maps of this location before, probably not! This is why it’s important to include additional information on your map, not just spatial data. The caption included with the figure is one way to do this – it gives you hints about what the different lines on the map mean. A legend would be more effective in this regard, however, as it makes a visual link between the different symbols and the information you want the reader to take from them. Further, a scale might help readers understand how large of an area you are showing them. Depending on how you are using your map, it can also be prudent to include information such as the date the map was created, who created it, what coordinate system it uses, and where the data came from. This information could be part of the caption, or it could go on the map itself.
Read on for information on adding map objects in QGIS!
- First, finish adding the layers to your map, and make sure you’re happy with the symbology.
- In the Project menu at the top of the screen, click “New print layout” and give the layout a title.
- This will open a new window containing a blank page, which is equivalent to the page you would print your map on.
- In the Add Item menu at the top of the screen, click “Add Map”, and then use your mouse cursor to draw a rectangle on your page. This rectangle will contain the map you have created.
- You can use this menu to add other items, like a scale bar, which tells readers how distances on your map relate to real life distances. You can add text using the “Add Label” option.
- To edit the properties of a map object, such as colours, font sizes, and backgrounds, right click on the object and choose “Item Properties”. You will need to explore the various options available to you in the panel that opens.
- Legends will automatically contain all the layers shown on your map, with the names as written in the layer panel of QGIS. To edit these, in the legend’s properties, uncheck the box which says “Auto update”. You can then edit individual legend items by double clicking on them.
- You can export your map in several formats from the Layout menu at the top of the page. “Export as Image…” might be particularly useful if you want to include the map as an image in a text document.
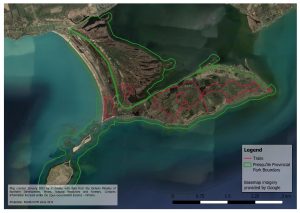
Figure 2 is a finished map layout, with the suggested information included. It is by no means a work of art, or even particularly good cartography, but it would be far more useful to a casual reader than figure 1!