HGIS
Historical GIS (HGIS)
“Historical GIS takes the power of geographic analysis and applies it to the realm of historical research.” (Bonnell and Fortin, 2014, xi)
HGIS involves the application of geographic information systems (GIS) for historical inquiry (Bonnell and Fortin, 2014). Although its potential has existed for much longer, HGIS emerged as a research tool in the late 1990s and early 2000s. HGIS is perhaps most used within the subdisciplines of spatial history and historical geography.
Richard White, writing about the Spatial History Projectat Stanford University, reflects that spatial history (and HGIS) is “not about producing illustrations or maps to communicate things that you have discovered by other means. It is a means of doing research; it generates questions that might otherwise go unasked, it reveals historical relations that might otherwise go unnoticed, and it undermines, or substantiates, stories upon which we build our own versions of the past” (2010). The functionality of GIS enables researchers to interpret historical phenomena in different ways, challenging taken-for-granted assumptions about past places and phenomena, thereby also raising new questions about the present and future.
Historical GIS: Openings for spatial-temporal storytelling
Until the past few decades, historians tended to prioritize time over space and place, leaving out much of the detail that might add spatial nuance to historical accounts. In Placing History: How Maps, Spatial Data, and GIS are Changing Historical Scholarship, Anne Kelly Knowles cites Edward Soja’s (1989) critique that historians tended to write history as if it was “packed solidly on the head of a pin,” while acknowledging that geographers had also tended to neglect time in their analyses (Knowles, 2008: ix). Part of this, Knowles explains, is matter of method and form; maps, as major geographical tools, have not been very effective at representing time, and historians’ privileging of written narratives do not easily capture spatial relationships.
As a research tool, GIS presents an opportunity to reimagine the spatial and temporal relationships that shape historical processes, events, and materialities. For the digital and spatial humanities, GIS enables a multiplicity of ways to both explore and incorporate historical data, including but also extending beyond digital mapping. Historical GIS has become a valuable tool for achieving breadth and depth of scale (allowing GIS users to move between local and regional, national, or global scales), storing information that was previously not mappable (e.g., objects and places that move or take new shapes over time), and creating a new form of archive or repository for other communities (including but not limited to scholars) to use in the future.
From a storytelling perspective, historical GIS presents an opportunity to tell more complex stories. The layering capacities of GIS, both in terms of what can be layered as well as how(moving layers around, adding transparency/opacity sliders, timelines, multi-media and the incorporation of multi-sensory knowledges). As such, new kinds of storytelling emerge through the convergence of historical and geospatial narratives that combine textual, auditory, visual, tactile, and digital knowledges.
Collaboration is a fundamental characteristic of HGIS, which requires some degree of openness to diverse knowledges and forms of communication, often engaged through interdisciplinary and cross-cultural relationships. Responses to questions like “what is data?”, “what is an archive?”, and “what is a field?”, fluctuate and may be highly contested across disciplinary traditions. Opening up those lines of inquiry through HGIS can lead to new understandings and appreciations for diverse knowledges. This collaborative component can also lead to the creation of new methods, theories, and lines of inquiry.
Using GIS for historical inquiry and storytelling: Challenges and considerations
One of the key challenges with HGIS research is how to deal with the uncertainty of locational accuracy with historical sources. Another is how to assess quality of locational information in general, but more specifically given the highly interdisciplinary nature of HGIS projects. Anne Kelly Knowles flagged this concern in 2005, using the example of the differences between how GIScientists and historians evaluate sources:
GIScientists use the quantitative measures of statistical models, while most historians gauge the quality of a given source and the limits of its interpretive power qualitatively, in light of their experience with similar sources and their understanding of the historical context within which the source was created. […] We need more flexible modes for capturing the nuance and web of qualifications that convey historians’ sense of their sources.” (10)
Of course, much has changed since 2005, but the point about how information is gathered, synthesized, and evaluated still remains in all research; more specifically, these questions continue to guide interdisciplinary HGIS projects, increasingly explored across the digital and spatial humanities.
Bonnell and Fortin’s (2014) book also highlights the challenges of obtaining access to historical and other relevant geospatial information. For example, copyright legislation, access to information barriers, privacy laws, and other institution-specific regulations shape whether or how (and how much) historical information and materials can be obtained for historical-GIS projects. These regulations also shift depending on who (or what) is in control of collections, records, or other information systems at the time and who is allowed to access them.
Furthermore, although many GIS applications can reduce the need for human involvement, HGIS work will always be shaped by the input and availability of particular assemblages of human experts, methods, and skills. For example, researchers who have institutional access to an online database or who know how to fill out an Access to Information and Privacy (ATIP) request, may not face the same barriers as those who have not received specialized training, thus highlighting that access is a multi-layered issue. It is also important to consider the availability of people on the other end of those requests and training opportunities (archivists, administrative assistants, curators, IT personnel, professors, map librarians, and so on). During the Covid-19 global pandemic, for instance, reduced operational capacity and the cancellation of in-person visits to archives and libraries, required many researchers to change their research plans and focus more explicitly on what could be obtained through digital collections, which came with their own openings and drawbacks.
Another important consideration for spatializing historical narratives through HGIS is the deeply political nature of how places and spaces are defined, including broader critical questions about which knowledges are privileged in dominant definitions. Places, toponyms (place names), and the meanings and boundaries attributed to particular locations, have always been contested. As we have discussed in previous modules, inequitable systems of colonialism and patriarchy led to the foregrounding of some place-based knowledges (e.g., Eurocentric, visual, Cartesian, or objective) while diminishing, erasing, or silencing others (e.g., non-white, Indigenous, multi-sensory, multi-versal, subjective). No matter the historical moment, locational “accuracy” is never guaranteed, partly because no place, and no single definition of place, is truly static or objective.
The above challenges are not listed to dissuade the use of GIS in the digital humanities; rather, they are included to encourage more reflexive, critical, and rigorous DH GIS research. As discussed earlier, GIS has enriched storytelling initiatives in many ways, changing not just what stories are told about place but how, by whom, and for what purpose. In the following section, we outline two examples of collaborative, GIS-based storytelling projects which are different in scope but connected through a shared interest in historical geographies and environmental histories.
Examples of Collaborative Storytelling through HGIS
Nipissing University’s Centre for Understanding Semi-Peripheries Portal: Reconfiguring the Region
At Nipissing University’s Centre for Understanding Semi-Peripheries (CUSP), researchers from a wide variety of disciplines and communities collaborate on historical “storymaps” that a) act as repositories for historical data on environmental issues, b) create opportunities for spatial and temporal analysis, and c) communicate research findings to a wider public. These storymaps draw on digitized archival materials, including scanned historical maps, photographs, fieldnotes, video, and audio recordings, as well as geospatial datasets that vary depending on the topic.
We encourage you to visit the main portal (linked above) to see how CUSP collaborators have used HGIS storymapping functions to mobilize historical geographical research projects. These appear along the left column on the introductory page. For this module, however, we will focus on one in particular: Reconfiguring the ‘Region’: Research Trajectories and Field Approaches of Robert Swanton Platt(Fig. 1).
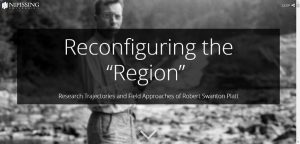
The Reconfiguring the “Region” storymap was primarily designed to visualize the extensive field photograph collections and digitally re-map the research trajectories of University of Chicago geographer, Robert S. Platt (1891-1964). Platt was a key scholar in the defining of “region” as a foundational cultural, economic, and environmental concept within geography. His 1935 article, “Field Approach to Regions,” was a starting point for understanding geographies of the past, and his focus on Northern Ontario as a case study inspired the development of an HGIS prototype.
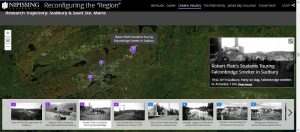
Led by Kirsten Greer (History and Geography, Nipissing University) and Megan Jee (GIS specialist), CUSP collaborators from Nipissing University and beyond used HGIS storymapping tools (ESRI’s ArcGIS Storymaps) to retrace Platt’s research movements and impact, which spanned the United States, Canada, Bermuda, and Barbados, among others. The team used Platt’s archived photographs to re-map and re-imagine his 1934 field trip from Toronto to James Bay, as well as other stages of his academic and family life.
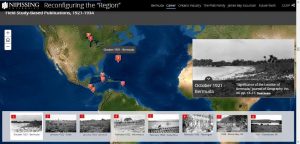
Mapping out the central locations in his academic publications also provide a glimpse into Platt’s scholarly “footprint.” As shown in the screenshot below, visualizing the places he traversed in the name of research is perhaps more impactful than just listing them. This is especially the case when the map is viewed within the historical context of travel and related technologies of the 1930s. Furthermore, the mapped routes raise critical questions about the power relations involved in academics’ mobilities and their varied effects on the people and other beings who actually lived in places under investigation.
More broadly, the storymap might spark new questions about foundational but often contested concepts like “region,” and the changing cultures of fieldwork in interdisciplinary scholarship over time. The Platt storymap offers other researchers an opportunity to use the photographs (and related media) for their own purposes, such as documenting landscape change over time and interpreting gendered and race-based histories of fieldwork, which Greer’s team highlights in a section on the Platt family.
Don River Valley Historical Mapping Project
The Don River Valley Historical Mapping Project, a collaborative digital environmental history project led by Jennifer Bonnell and Marcel Fortin, provides another example of how HGIS can be a powerful storytelling device. In this case, the creators used HGIS to explore environmental histories that are shaped by “the relationship between the developing city and the river valley at its eastern periphery” (Bonnell & Fortin, 2014: 45). The project documents how Toronto’s Don River Valley has changed dramatically over time, particularly since European settlement in the nineteenth and twentieth centuries, and the effects of this historical change on the watershed today.
Visit the project here: https://www.arcgis.com/apps/webappviewer/index.html?id=6055c7fbccdf44ac911a4e13b34a825c
As Bonnell and Fortin note in the “About” section on the platform, the project involved scanning a plethora of historical documents related to Toronto and the Don River watershed, including but not limited to historical and geological maps, fire plans, and city planning documents. Using GIS as the main tool for synthesis and interpretation, these historical documents were “placed” with other digitized, geospatial datasets. At the time, these included: “1) changes to the river channel and shoreline of Toronto harbour, 1858-1918; 2) industrial development in the Lower Don River Watershed, 1857-1951 (as points, and in some cases polygons); 3) historical mill sites in the Don River Watershed, 1825; 18524) land ownership in the watershed, 1860 and 1878; and 4) points of interest in the watershed.” The HGIS offers multiple basemap layers from which to choose (or layer), as well as a timeline slider for tracking temporal change, a swipe option for quick comparison of layers)
Whereas the CUSP storymaps in the first example started with the question of how to retrace the research trajectories of a particular geographer through his fieldnotes and photographs, the Don Valley River Historical Project did not begin with a single research question or problem. Rather, it was designed to produce “a body of data that would be accessible to a broad range of researchers from different disciplines for use in a variety of different projects” (44). Whether worked into the initial design or emerging later in the process, both projects highlighted another purpose of HGIS projects: to develop a collaborative, community-oriented, and user-friendly repository of information that can be used for diverse projects rooted in place-based historical narrative.
For more information on the research design, techniques, and outputs, read Bonnell and Fortin’s open-access chapter, “Reinventing the Map Library: The Don Valley River Historical Project,” in their 2014 edited book, Historical GIS Research in Canada.
