11.2 Sales Metrics for eCommerce
Eight Sales Metrics for eCommerce
There are eight key metrics for assisting in forecasting future sales.
- Average order value
- Customer lifetime value (CLV)
- Sales growth
- Product performance
- Lead conversion rate
- Sell-through rate
- Sales funnel performance
- Sales pipeline performance
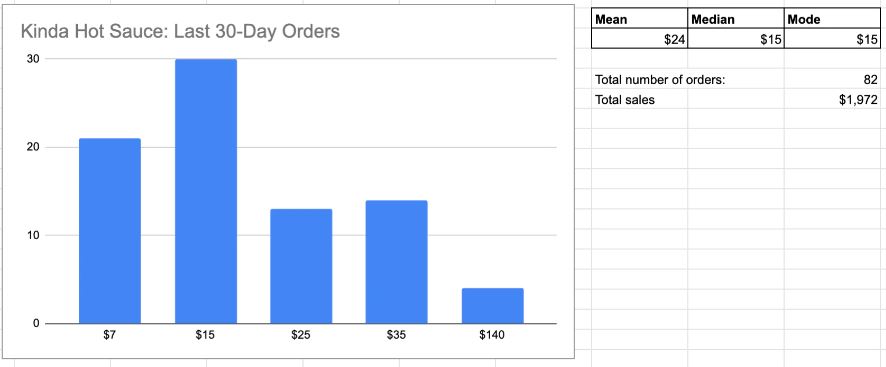
1. Average order value
Average order value is a metric that reveals how much people are spending during a typical visit to your ecommerce store. You can find this total by dividing the total revenue generated by the total number of sales in a time period. When you do your sales forecasting, you can assume that future customers will spend about the same amount per purchase as your current customers. Average order value is particularly useful as a factor in calculating customer lifetime value.
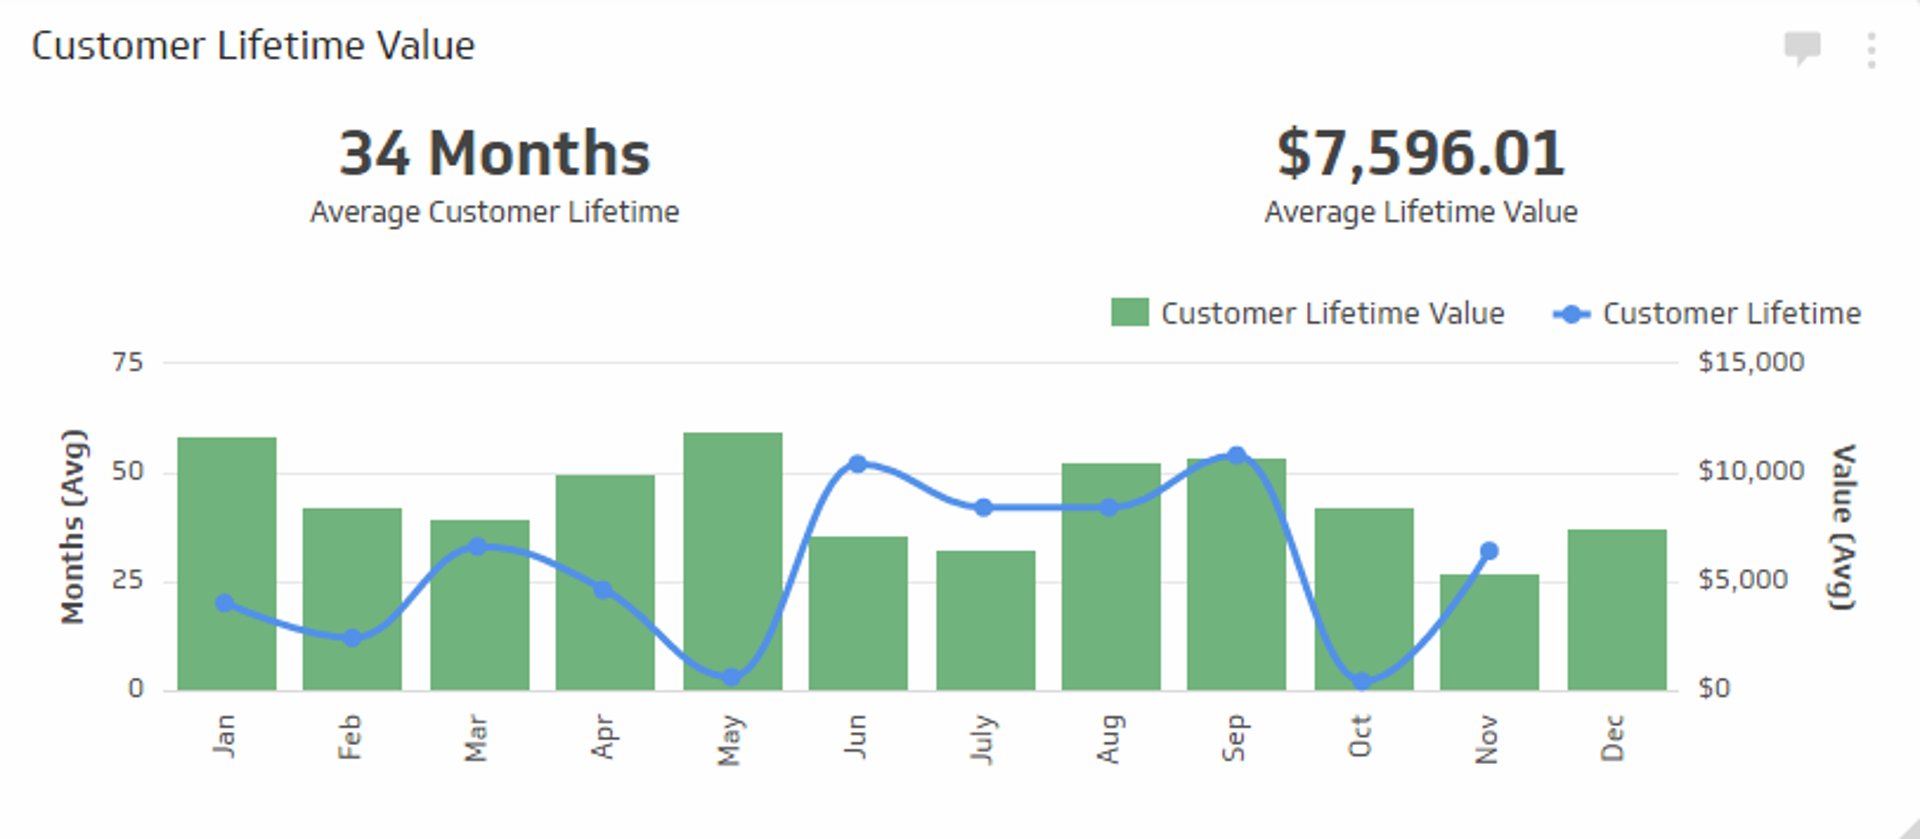
2. Customer lifetime value (CLV)
The customer lifetime value (CLV) metric represents your prediction for how much money a particular customer will spend with your business over their entire relationship with your company. You start by studying how much they’ve spent with you in prior sales cycles and then use predictive analytics to estimate how much they might spend in each future sales cycle.
3. Sales growth
The sales growth metric looks at sales reports over a sustained period of time. It compares historical data with current sales performance to determine how much sales have grown or declined over time. You can promote sales growth by expanding your customer base and sales channels and by rolling out new products.

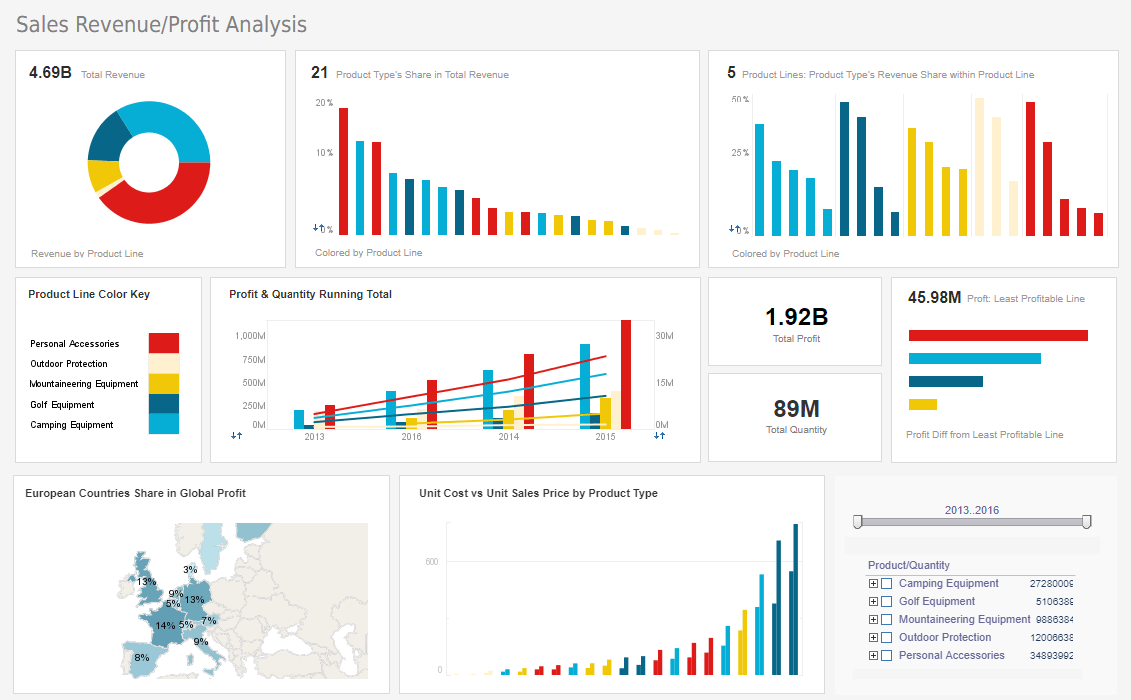
4. Product performance
The product performance metric breaks down sales by individual products. This is useful because the topline number on sales reports doesn’t always paint a complete picture. Your company’s revenue could be evenly divided among all the products it sells, or one product could be generating the majority of sales while the other SKUs lag behind. Knowing which products sell the best allows you to appropriately allocate marketing resources.
5. Lead conversion rate
A referral to your ecommerce store is known as a lead. A lead conversion is when that lead results in an actual sale. Your lead conversion rate may reveal information about the customer experience once a user is on your website or browsing your ecommerce store. You can determine whether you’re converting enough leads, and, if you aim to improve, you can drill down on conversion rate optimization to get better results.
6. Sell-through rate
Your sell-through rate is the rate at which you can sell off your existing inventory. To find your quarterly sell-through rate, divide the amount of inventory you sold in a quarter by the amount of inventory you acquired during that quarter. If you added 1,000 pieces of inventory and sold 850 pieces, you have an 85% sell-through rate. If you added 1,000 pieces of inventory, but only sold 318, your sell-through rate is 31.8%. Your target sell-through rate depends on your industry, but a goal of 80% or higher is ideal.

7. Sales funnel performance
Your company’s sales funnel is the series of customer interactions that turn prospects into paying customers. The sales funnel begins the moment a prospective customer becomes aware of your brand, and it continues when they visit your site and eventually buy your products. Sales funnel analytics go beyond a customer’s behaviour on your website. You’ll have to study the success of ad campaigns and social media posts to find out what’s feeding your sales funnel with the most valuable prospects. You can also use analytics to identify sales funnel leaks—instances where a potential client begins the customer journey, but doesn’t complete a purchase.
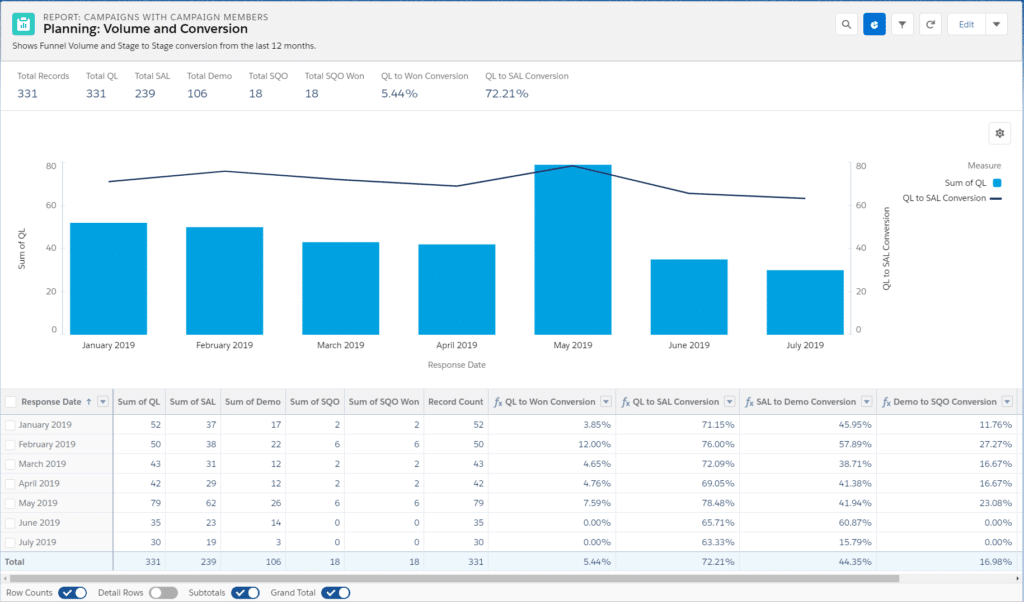
8. Sales pipeline performance
A sales pipeline is a means of organizing and studying potential customers as they move through your company’s sales funnel. There are seven stages in a sales pipeline: prospecting, lead qualification, demonstration, proposal, negotiation and commitment, opportunity won, and post-purchase. Your sales pipeline velocity is the speed at which a prospect moves through your pipeline and becomes a paying customer. Use sales pipeline analysis to track the customer experience and generate sales forecasts and sales targets based on current conditions.

“Sales Analytics 101: Everything You Need To Know” by Shopify Staff is licensed under a Creative Commons Attribution 4.0 License unless otherwise noted.
