11.1 Sales Analytics and Sales Metrics
If your company reported its best-ever quarterly sales results, your first instinct would probably involve a good number of fist pumps. But then you’d pivot to an important question:
What happened to make the quarter so successful? The answer would be found in sales data analysis based on specific metrics. You’d take those key sales metrics, study them, and form actionable insights to steer future business decisions.
What is Sales Analytics?
Sales analytics is the process of compiling and analyzing sales data in a way that compares sales expectations with actual sales results. For instance, you could compare the year’s sales revenue with your company’s historical sales data and look for upward or downward trends. Similarly, you could study your customers’ average purchase value or your sales reps’ lead conversion rates, and then compare actual results to expected performance. The goal is to leverage information about sales trends to craft a data-driven sales strategy. All members of a sales organization are stakeholders in the process and share the goal of increasing revenue. Sales analytics help to gain important customer insight!
Companies large and small use sales analytics tools to understand their businesses. Sales analytics allow you to analyze your customers’ purchasing habits, your product performance, and your sales team’s performance. Armed with sales analytics metrics, your company’s sales reps, marketers, and product managers can strategize future initiatives and improve their overall sales and marketing efforts.
Many businesses have limited resources to pour into sales and marketing. By amassing sales analytics, you can maximize those resources. For instance, a sales analytics tool may scan your website traffic and reveal that your ecommerce store records most of its purchases from computers running Microsoft Windows during daytime business hours. This could lead you to conclude that a lot of people buy your products while they’re at work. You could then orient your sales funnel to capture those profitable customers—perhaps by purchasing sponsored posts on a business-centric social network like LinkedIn or by pursuing cross-selling opportunities with a B2B vendor. If, at any point, you notice your product sales diminishing, you can also use analytics to change course and try something new.
Metrics Used by Salespeople
The key metric, or measure, salespeople are evaluated on are the revenues they generate. Sometimes the average revenue generated per customer and the average revenue generated per sales call are measured to determine if a salesperson is pursuing customers that are the most lucrative. How many prospects and suspects a salesperson has in the pipeline are two other measures. The more potential buyers there are in the pipeline, the more revenue a salesperson is likely to generate.
Conversion ratios are an extremely important metric. Conversion ratios measure how good a salesperson is at moving customers from one stage in the selling cycle to the next. For example, how many leads did the salesperson convert to suspects? A 10:1 ratio means it took ten leads for the salesperson to get one suspect who agreed to move to the next step. A salesperson with a 5:1 ratio only needs to pursue five leads to get a suspect. So, if the representative can make only ten sales calls in a day, then the salesperson with the 5:1 ratio will have produced two suspects versus just one suspect for the other salesperson. As a result, the second rep will have more suspects in the pipeline at the end of the day. Similarly, how many suspects did the salesperson convert to prospects and finally to customers? If all the other conversion ratios (suspect-to-prospect ratio and prospect-to-customer ratio) are the same for the two salespeople, then the rep with the 5:1 ratio will close twice as many sales as the one with a 10:1 ratio.
Salespeople can track their conversion ratios to identify which stages of the sales cycle they need to work on. For example, the sales representative with 10:1 ratio can study what the rep with the 5:1 ratio is doing in order to try to improve his efficiency and sales levels. His conversion ratios also tell him how many sales calls he has to make each day or week to generate a sale and how many calls must be made on leads, suspects, and prospects to convert them.
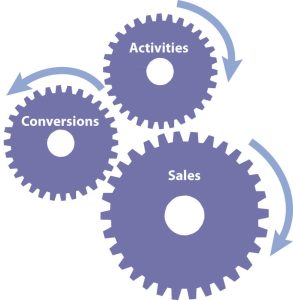
How many sales calls of each type a representative has to make in a certain period of time are activity goals. As Figure 11.1.1.1 “How Activities and Conversions Drive Sales” illustrates, activities and conversions drive sales. More calls translate into more conversions, and more conversions translate into more sales. You can think of it as sort of a domino effect.
A win-loss analysis is an “after the battle” review of how well a salesperson performed given the opportunities she faced. Each sales opportunity after the customer has bought something (or decided to buy nothing) is examined to determine what went wrong and what went right. (Keep in mind that to some extent, all salespeople think back through their sales call to determine what they could have said or done differently and what they should say or do again in the future.) When several professionals are involved in the selling process, a win-loss analysis can be particularly effective because it helps the sales team work together more effectively in the future. Like a team watching a film after a football game, each member of the sales team can review the process for the purpose of improvement. When the results are fed to managers, the analysis can help a company develop better products. A marketing manager who listens carefully to what salespeople say during a win-loss analysis can develop better advertising and marketing campaigns. Communicating the same message to the entire market can help shorten the sales cycle for all a company’s sales representatives.
Another important metric used by many salespeople is how much money they will make. Most salespeople are paid some form of incentive pay, such as a bonus or commission, which is determined by how much they sell. A bonus is paid at the end of a period of time based on the total amount sold, while a commission is typically thought of as a payment for each sale. A bonus plan can be based on how well the company, the individual salesperson, or the salesperson’s team does. Some salespeople are paid only on the basis of commission, but most are paid a salary plus a commission or a bonus.
Commissions are more common when sales cycles are short and selling strategies tend to be more transactional than relationship oriented. Perhaps one exception is financial services. Many financial services salespeople are paid a commission but expected to also build a long-lasting relationship with clients. Some salespeople are paid only salary. As might be expected, these salespeople sell very expensive products that have a very long sales cycle. If they were only paid on commission, they would starve before the sale was made. They may get a bonus to provide some incentive, or if they receive a commission, it may be a small part of their overall compensation.
Metrics Used by Sales Managers
The sales manager is interested in all the same metrics as the salesperson, plus others. The metrics we discussed earlier can be used by the sales manager to evaluate salespeople, promote them, or pinpoint areas in which they need more training. Sales managers also use sales cycle metrics to make broader decisions. Perhaps everyone needs training in a particular stage of the sales process, or perhaps the leads generated by marketing are not effective, and new marketing ideas are warranted. Sales cycle metrics at the aggregate level can be very useful for making effective managerial decisions.
Sales managers also look at other measures such as market share, or how much of the market is buying from the firm versus its competitors; sales by product or by customer type; and sales per salesperson. Sales by product or by product line, especially viewed over time, can provide the sales executive with insight into whether a product should be divested or needs more investment. If the sales for the product line are declining but the product’s market share is holding firm, then the entire market is shrinking. A shrinking market can mean the firm needs to look for new markets or develop new offerings.
Time is yet another element that sales managers look at. If the firm’s sales are declining, is the company in a seasonal slump it will come out of, or does the firm have a serious, ongoing problem? Sales executives are also constantly concerned about what the firm’s sales are doing relative to what was forecasted for them. Forecasts turn in to sales quotas, or minimum levels of sales performance for each salesperson. In addition, forecasts turn into orders for raw materials and component parts, inventory levels, and other expenditures of money. If the forecast is way off, then money is lost, either because the company ran out of products or because too much was spent to build up inventories that didn’t sell.
Example: Sales Data Sales Managers Utilize
In the tables below, you can see a sample of data a sales manager may review. As you can see, most of the sales teams are performing near quota. But what about the Midwest? Selling 7 percent more is a good thing, but an astute manager would want to know why sales were short by over $200,000. Inventory can be balanced against the Southeast’s shortfall, but that adds cost to ship from the plant to Atlanta, then to Chicago. Accurate forecasts would have put that product in the Midwest’s Chicago warehouse to start with.
Example of the Sales Data Sales Managers Utilize
Table 11.1.1 Analysis by U.S. Region
Region |
Quota ($) |
Actual ($) |
Difference ($) |
Performance |
|---|---|---|---|---|
| Northeast | 4,167,000 | 4,147,400 | -19,600 | 99.5% |
| Southeast | 3,588,250 | 3,425,100 | -163,150 | 95% |
| Midwest | 3,472,500 | 3,698,875 | 226,375 | 107% |
| Northwest | 5,093,000 | 5,209,880 | 116,880 | 102% |
| Southwest | 5,112,750 | 5,120,250 | 7,500 | 100% |
| Western | 4,861,500 | 4,948,920 | 87,420 | 102% |
| Total | 26,295,000 | 26,550, 425 | 225,425 | 101% |
Table 11.1.2 Analysis by Salesperson (Southwest Region)
Salesperson |
Quota ($) |
Actual ($) |
Difference ($) |
Performance |
|---|---|---|---|---|
| Becky (Atlanta-South) | 868,000 | 851,000 | -17,000 | 98% |
| Juan (South Florida) | 804,000 | 810,000 | +6,000 | 101% |
| Jerry (Carolinas) | 592,000 | 416,000 | -176,000 | 70% |
| Mack (Alabama/Miss.) | 370,000 | 372,000 | +2,000 | 103% |
| Earl (Atlanta-North) | 609,000 | 631,000 | +22,000 | 104% |
| Dave (Tennessee) | 345,000 | 345,000 | 0 | 100% |
| Total | 3,588,000 | 3,425,000 | -163,000 | 95% |
Tables such as this provide information that managers use to evaluate sales performance against expected sales, or quota.
Similarly, a manager would be concerned about Jerry’s lack of sales. That one salesperson accounts for the entire region’s shortfall against quota. Was the shortfall due to Jerry’s inability to sell, or did something happen in the territory? For example, if a hurricane came ashore in the Carolinas or if Jerry had a health problem arise, the manager’s concern would be different than if Jerry lost a major account or had a history of failing to reach quota.
Sales executives don’t just focus on sales, though. They also focus on costs. Why? Because many sales executives are held accountable not only for their firms’ sales levels but also for profit levels. Money has to be spent to sell products, of course: If the firm spends too little, the sales force will be unable to perform effectively. If the budget to attend trade shows is cut, for example, the quantity and quality of leads salespeople get could fall—and so could their sales. But if the firm spends too much on trade shows, the cost per lead generated increases with no real improvement in the sales force’s productivity. Perhaps the “additional” leads are duplicates or take too much time to follow up on.
Customer satisfaction is another important metric. Salespeople and their bosses want satisfied customers. Dissatisfied customers not only stop buying a company’s products, they often tell their friends and family members about their bad purchasing experiences. Sometimes they go so far as to write blogs or bad product reviews on web sites such as Epinions.com. Some research studies have shown that average customer satisfaction scores are less important than the number of complaints a company gets. Perhaps it’s because of the negative word-of-mouth that unhappy customers generate.
In addition to tracking complaints, companies measure customer satisfaction levels through surveys. An average score of 3 on a scale of 1 to 5 could mean two things. The score could mean that everyone is, on average, happy and therefore gave the company a rating of 3.0. Or the score could mean that half of the customers are wildly enthusiastic and gave the company a 5 while the other half was bitterly disappointed and rated the company a 1. If the latter is the case, then half of the company’s customers are telling their friends about their negative experience and discouraging many others from buying. Sometimes companies hire firms like TeleSight, an organization capable of tracking satisfaction scores for an entire industry. Using a service like this, the sales executive can not only track the company’s customer satisfaction scores but also see how they compare with the scores of the industry overall
“Sales Analytics 101: Everything You Need To Know” by Shopify Staff is licensed under a Creative Commons Attribution 4.0 License unless otherwise noted.
“13.3 Sales Metrics (Measures)” from Principles of Marketing – H5P Edition by [Author removed at request of original publisher] is licensed under a Creative Commons Attribution-NonCommercial-ShareAlike 4.0 International License, except where otherwise noted.
