Discrimination
Discrimination means treating people differently on the basis of characteristics which are not relevant to their character or their ability to perform a task. Discrimination may be intentional, the result of consciously articulated prejudice or dislike; it may be unintentional, the result of unconscious bias; and it may be due to a network of institutional arrangements and cultural practices which result in systemic discrimination.
We may give preferential treatment to those who are similar to ourselves (endophilia), or we may treat unfairly those who are different (exophobia).[1]
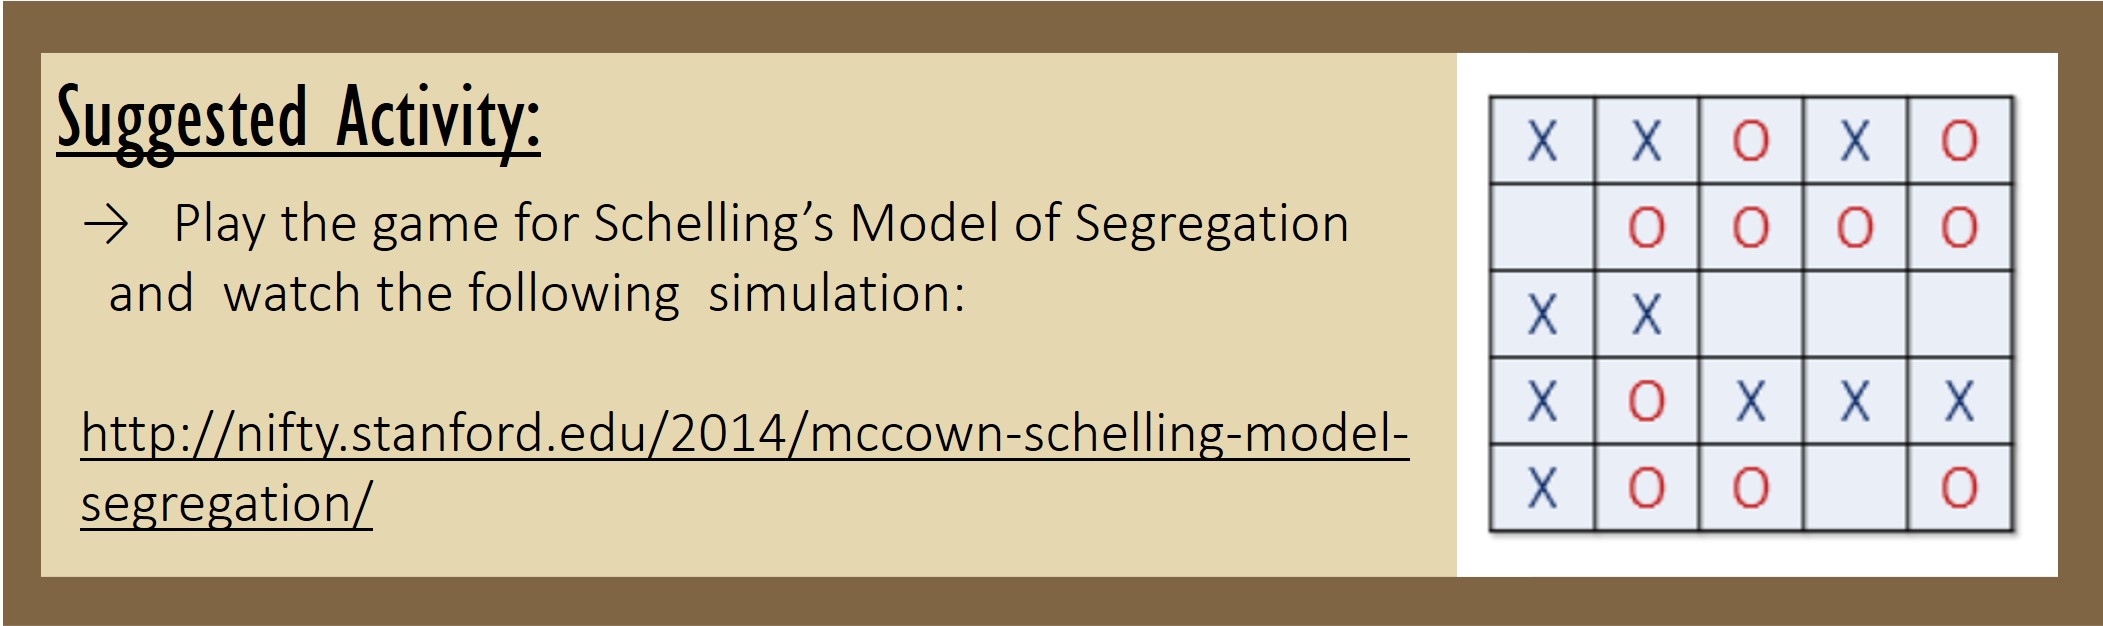
Thomas Schelling (1971) has shown that even small degrees of endophilia, such as wanting 30 percent of one’s neighbours to have the same cultural background as oneself, can lead to highly unequal or highly segregated outcomes. Using nickels and dimes representing people of two different races, and laying the nickels and dimes on a chessboard, he showed that if dissatisfied people are allowed to move to vacant squares, and the game continues until each player is satisfied, then even a slight preference for having neighbours similar to oneself can lead to a highly segregated distribution of nickels and dimes.
Speaking of segregation, in a 2018 poll only 30% of Canadian respondents said they had spent time on a reserve, with 38% never having even driven through a reserve. 68% of those interviewed said they had no Indigenous friends or acquaintances.[2]
Ironically, endophilia and exophilia may be more common in places where the population is already very homogeneous. Doug Saunders, columnist for the Globe and Mail, has observed that anti-immigration sentiment is most prevalent in places where there are hardly any immigrants or minorities. “With very few exceptions, the only places where you’ll find more than fringe levels of support for candidates opposed to immigration are places where less than 5 percent of the population are from immigrant or racial-minority families….White people living in “majority-minority” cities – those who could be said to be numerically or culturally “threatened” – do not vote for such candidates in more than minuscule numbers.”[3]
Who we hang around with makes a systemic difference. A lot of jobs are found by word-of-mouth. Employers tend to recruit from the same agencies and areas they always have. And minorities may be tempted to avoid risk of rejection by applying only to employers already known to hire minorities. What we just said about jobs also applies to educational programs, housing, recreational opportunities and more.

Systemic discrimination tends to self-perpetuate. As noted by John Hartwick (2015)[4], some people say:
“I’m not racist, but other people are, so
– having minority neighbours will lower the value of my property
– inviting minority children to my child’s birthday party will hurt my child socially
– hiring minority employees will hurt my business”
This problem is not solved (except by morally courageous people) until society becomes more diverse and minorities obtain more status and purchasing power.
The model of Lanny Zrill (2007) is useful here. Zrill described the choice of immigrants regarding whether to conform in language, dress, names of children etc. to their new, host country or whether to continue traditions from the home country. There is a tipping point: if immigrants are likely to interact with sufficiently many people born in the host country, they will choose to conform. If they are ghettoized, they are better off preserving customs from their home country.
Similarly, if majority persons are unlikely to do business or attend school with minority persons, they may find it in their best immediate, material interest to keep minorities out of their neighbourhoods, schools, and workplaces.
The 2020 worldwide Black Lives Matter protests, triggered by the killing of George Floyd, highlighted the degree to which exophilia and endophilia are systemic in law enforcement and other social institutions. During that time, a police car dash-cam video[5] emerged of Athabasca Chipewyan First Nation Chief Allan Adam being suddenly knocked over and beaten by a police officer arriving on the scene, while he was calmly standing and cooperating with the first police officer. Before the public saw the video, the RCMP told the public that they had reviewed the video and “it was determined that the [police officer’s] actions were reasonable.”
Discrimination can literally mean the difference between life and death. It also has an impact on employment and earnings.
Lower Earnings for Minorities
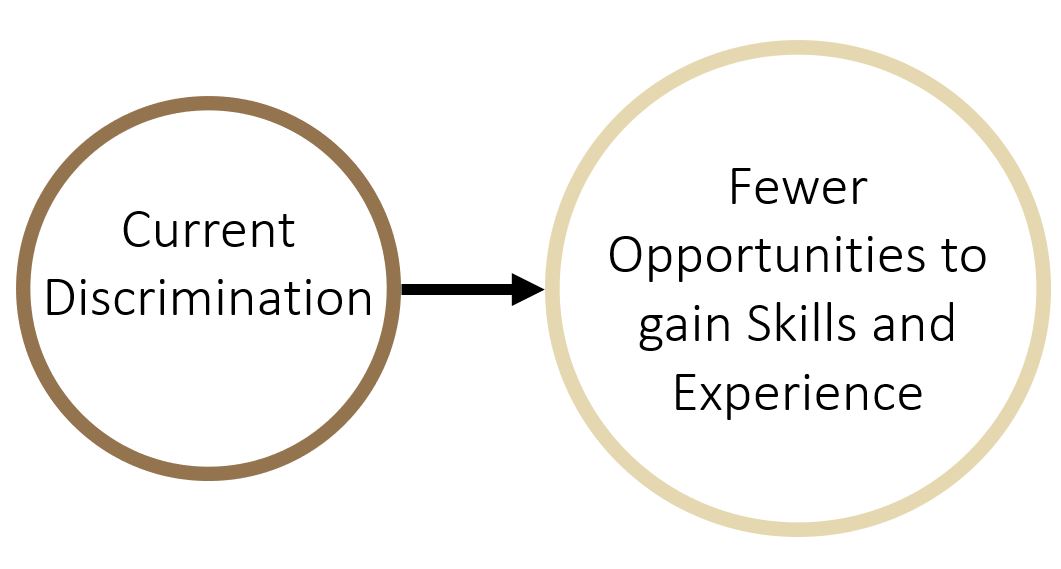
Schiller (1973) noted that the earnings gap between non-minorities and minorities is not just due to lower wages for minorities. Minority workers are “hired less often, for fewer hours, for less desirable jobs, and at lower wages.”
What can explain this package? There may have been past discrimination which accounts for minorities having poorer housing, education and health backgrounds, which affects their employability. There may be present-time discrimination against minorities. Discrimination in the present leads to minorities achieving less experience and less skill accumulation due to lack of opportunity, leading to reduced job opportunities in the future.
In our next Chapter we’ll use econometric techniques to measure the extent of discrimination. In this Chapter we use economic theory to describe and explain discrimination. Our first economic model of discrimination is the model of employer preference.
Model 1: Discrimination as an expression of employers’ preferences
This model, first put forward by Gary Becker in his 1957 book entitled The Economics of Discrimination, assumes that many employers dislike visible minorities. Their demand for minority workers is less than their demand for majority workers, so they will pay minorities a lower wage.

When only a small fraction of the minority workforce is employed in an industry, the marginal employer in that industry is not very prejudiced. The prejudiced employers are holding out by not hiring minority workers. The marginal employer is not very prejudiced and pays the minority workers a wage that is close to the wage of the non-minority workers.
When many of the minority workers available are employed in an industry, the marginal employer is more prejudiced, and won’t hire unless there is a substantial wage gap.
Charles and Guryan (2008) used US state data between 1972 and 2004 to confirm that the hourly wage for Black employees relative to White employees was negatively correlated with the prejudice of the marginal, rather than the average, White person who participated in the General Social Survey.[6].
That is, the marginal employer sets the pay rate. The more prejudiced is the marginal employer, the lower the wages of the minority workers. The greater the fraction of minority workers who are already employed, the higher the prejudice of the marginal employer, because the less prejudiced employers are already employing minority workers.
When only a small fraction of minority people are working in an industry, the marginal employer is not very prejudiced, and the pay gap should not be high.
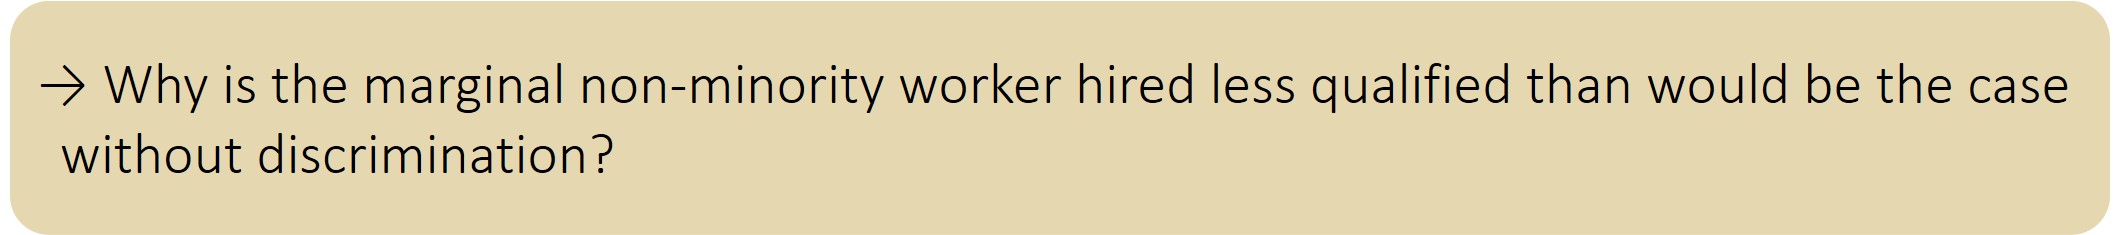
Inasmuch as minority employees are just as capable as the non-minority employees, employers who refuse to hire minorities are artificially restricting their own access to employees and artificially raising the wages of the non-minority employees they hire. The non-minority workers benefit from this, but the employers do not. Employers are paying a higher wage than otherwise, to workers who are less qualified than otherwise.
In this model, non-minority workers have a strong stake in maintaining the status quo, so that they can continue to earn a wage that is higher than it otherwise would be.
Minority workers obviously suffer from being shut out of opportunities to work, likely forced into occupations they would not have chosen, and competing for the limited number of jobs available to them.
The employers who are not prejudiced may preferentially hire minority workers, because their wage is lower.
Arrow (1972) showed that the employers who are not prejudiced will be able to earn more profits than employers who are prejudiced, driving the prejudiced employers out of business.
What do we have so far?
Many employers reluctant to hire minorities → lower wages for minorities → Some employers preferring to hire minorities because of their lower wages → employers who hire minorities drive employers who do not out of business
But we do not observe discriminating employers always forced out of business by more profitable non-discriminating competitors. This could be because the labour market is not competitive: employers have market power and are able to underpay even non-minority workers. Another explanation for the persistence of discriminating employers is that they are rewarded for their discriminating behaviour by customer loyalty, employee loyalty, or favours from the local government.
In a 2020 paper, Ricard Gil and Justin Marion study racial segregation in movie theatres in American cities of the mid-South and West Coast during the decade 1945-55. They find that in Washington DC, where theatres were desegregated in 1953, theatre revenues fell after desegregation. Their analysis leads them to conclude that the decline in revenue was because White customers were unhappy with the theatres for desegregating.
To sum up, in the Becker-Arrow model, prejudiced employers, supported by prejudiced customers, pay minority workers less. Minority workers are hurt and non-minority workers benefit. Employers are ok, but customers are hurt in that they are paying more for products, or even buying products of lower quality (if the marginal non-minority employee is less skilled than the minority worker who could have been hired instead).
Model 2: Employers discriminating stratgically
In his 1971 chapter The Economics of Racism, Michael Reich argues against the Becker/Arrow model. He does not believe that discrimination represents a cost to employers and a benefit to non-minority workers. Reich believes that racism benefits employers, who use it to “divide and conquer” the working class. In his model, firms have a strategic interest in maintaining a wage gap between minority and non-minority workers. Implicit in his argument is the belief that firms have market power, power to pay both categories of worker a wage below the workers’ value of the marginal product. Non-minority workers will not complain because at least their wage is higher than the wage of visible minorities.

Robin Diangelo, author of White Fragility: why it’s so hard for white people to talk about racism, agrees: “If poor whites were focused on feeling superior to those below them in status, they were less focused on those above.”[7] You may be able to name some politicians who exploit this dynamic.
Because the working class is divided racially:
- Union growth is inhibited. Cooperation between unions is inhibited.
- Low wages are blamed, not on employers, but on minorities who work for a lower wage than non-minorities.
- Low wage majority workers are less dissatisfied with their poverty when they observe minority workers in worse condition.
- Low wage majority workers sometimes take out their frustrations in violence against minorities.
- Again, because workers are divided, they do not cooperate to get better public services even when they live in the same neighborhood.
- Low wage majority workers, who are more likely to live near minorities than near high wage workers, live in areas with low tax revenues and low-quality public services.
- Low wage majority workers are more likely to tolerate poor public services so long as they are better than the public services which minorities get.
You can see from the points above that workers in the majority group are likely to be worse off because of the discrimination which privileges them with higher wages than minorities receive.
Reich wondered how to measure racism, particularly White:Black racism. Many authors measure the difference in wages between African Americans and White Americans, after accounting for worker characteristics such as education, health, age, and other factors. But Reich believes that the only reason these characteristics are different in the first place is because of past discrimination. Thus, he measures racism by the overall difference in wages between the two races.

Reich collected statistics for various standard metropolitan areas in the United States in 1960. He found that, after accounting for differences in cities’ average incomes, industrial structure, occupational structure, and region, the degree of racism in a city could predict several things. The greater the degree of racism, i.e. the lower was the median Black wage compared to the White wage, the smaller the percentage of the labour force that was unionized. The more racism there was in a city, the greater the inequality of educational achievement among White men ages 25-29. And the more racism there was in a city, the more unequally income would be distributed among Whites: the top 1% of White earners would receive a larger fraction of White-earned income, and the city’s Gini coefficient would be higher.
Model 3: Discriminating to acquire assets
I would like to propose a third way of looking at discrimination, where discrimination is used to justify stealing a group’s land, homes, or freedom. The underlying racism (or sexism etc.) serves the purpose of justifying and facilitating expropriation or enslavement.
As Diangelo (2018, p. 16) asserts, “The idea of racial inferiority was created to justify unequal treatment; belief in racial inferiority is not what triggered unequal treatment. Nor was fear of difference. As Ta-Nehisi Coates states, ‘But race is the child of racism, not the father.’”[8]
Let’s consider how racism fits into a model of the demand and supply for a resource like Indigenous land. Recall that the cost of producing or acquiring one more unit of something traces out its Supply Curve. Similarly, the benefit to consumers from each new unit of the good traces out its Demand Curve.
When there are large numbers of producers and consumers trading freely in a market, the price that prevails balances the marginal cost and the marginal benefit to the people participating in the market.
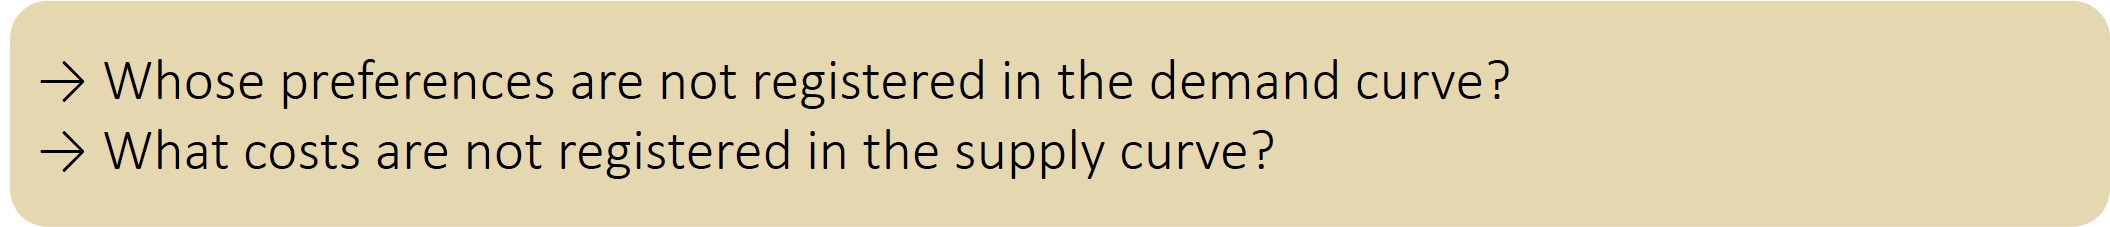
Let’s think about drawing a Demand and Supply diagram, from the point of view of settlers only, for the activity of dispossessing Indigenous peoples. It makes sense to consider settlers’ point of view inasmuch as their numbers and their decisions have driven the dispossession.
How might we draw the marginal benefit to settlers of dispossessing Indigenous peoples? Let’s put acres of land expropriated on the horizontal axis, and marginal benefits, measured in dollars, on the vertical axis. We must hold the number of settlers constant to isolate the relationship between quantity expropriated and marginal benefit, and when we do we expect to see a downward-sloping line, because the first acre is most desperately wanted and evokes the highest willingness-to-pay.
Observe the graph below. This demand curve would shift to the right as more settlers arrived: more land would be desired at any price level.
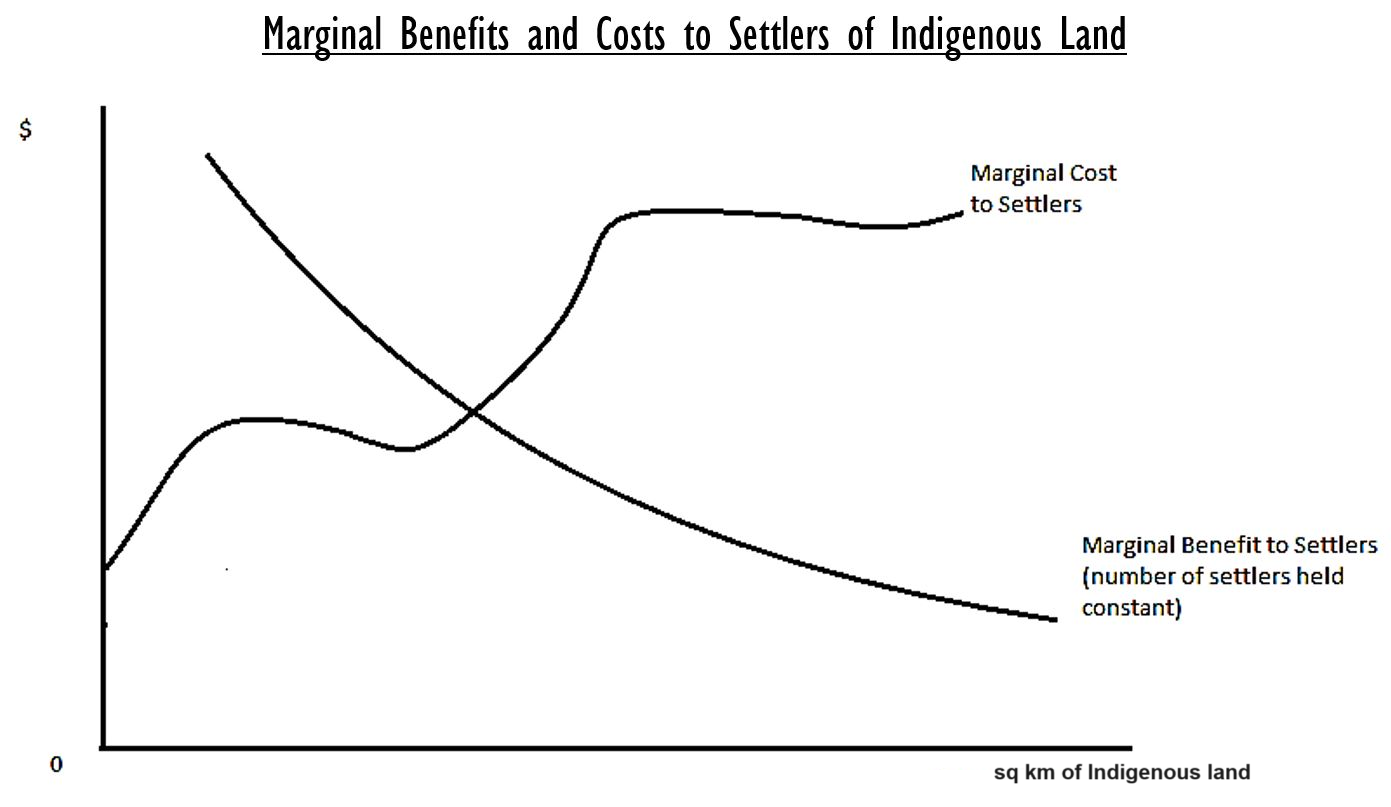
On the supply side, we graph the marginal cost of expropriating the land. This would generally rise as the lands which are easiest to expropriate are expropriated first, and the more difficult and expensive lands, later. There may be some regions on the horizontal axis where the marginal cost falls; at these points, due to intimidation of Indigenous peoples, Indigenous peoples vacate areas and make expropriation easier. There also may be some regions where marginal costs surge, shooting up vertically. These could represent points where an Indigenous group is pushed to the point of resistance, either violent resistance or a nonviolent diplomatic campaign. There could be points in time where the government, or non-Indigenous citizens, or foreign governments and citizens are finally outraged by what has happened and take actions to protect Indigenous rights.
At what times in Canada’s history have there been major changes in the marginal cost of acquiring Indigenous land?
In the model we have just created, discrimination and the racism underlying it can be understood in three ways.
- First, there is racism and discrimination in the complete disregard for the Indigenous people who are being impacted by the expropriation.
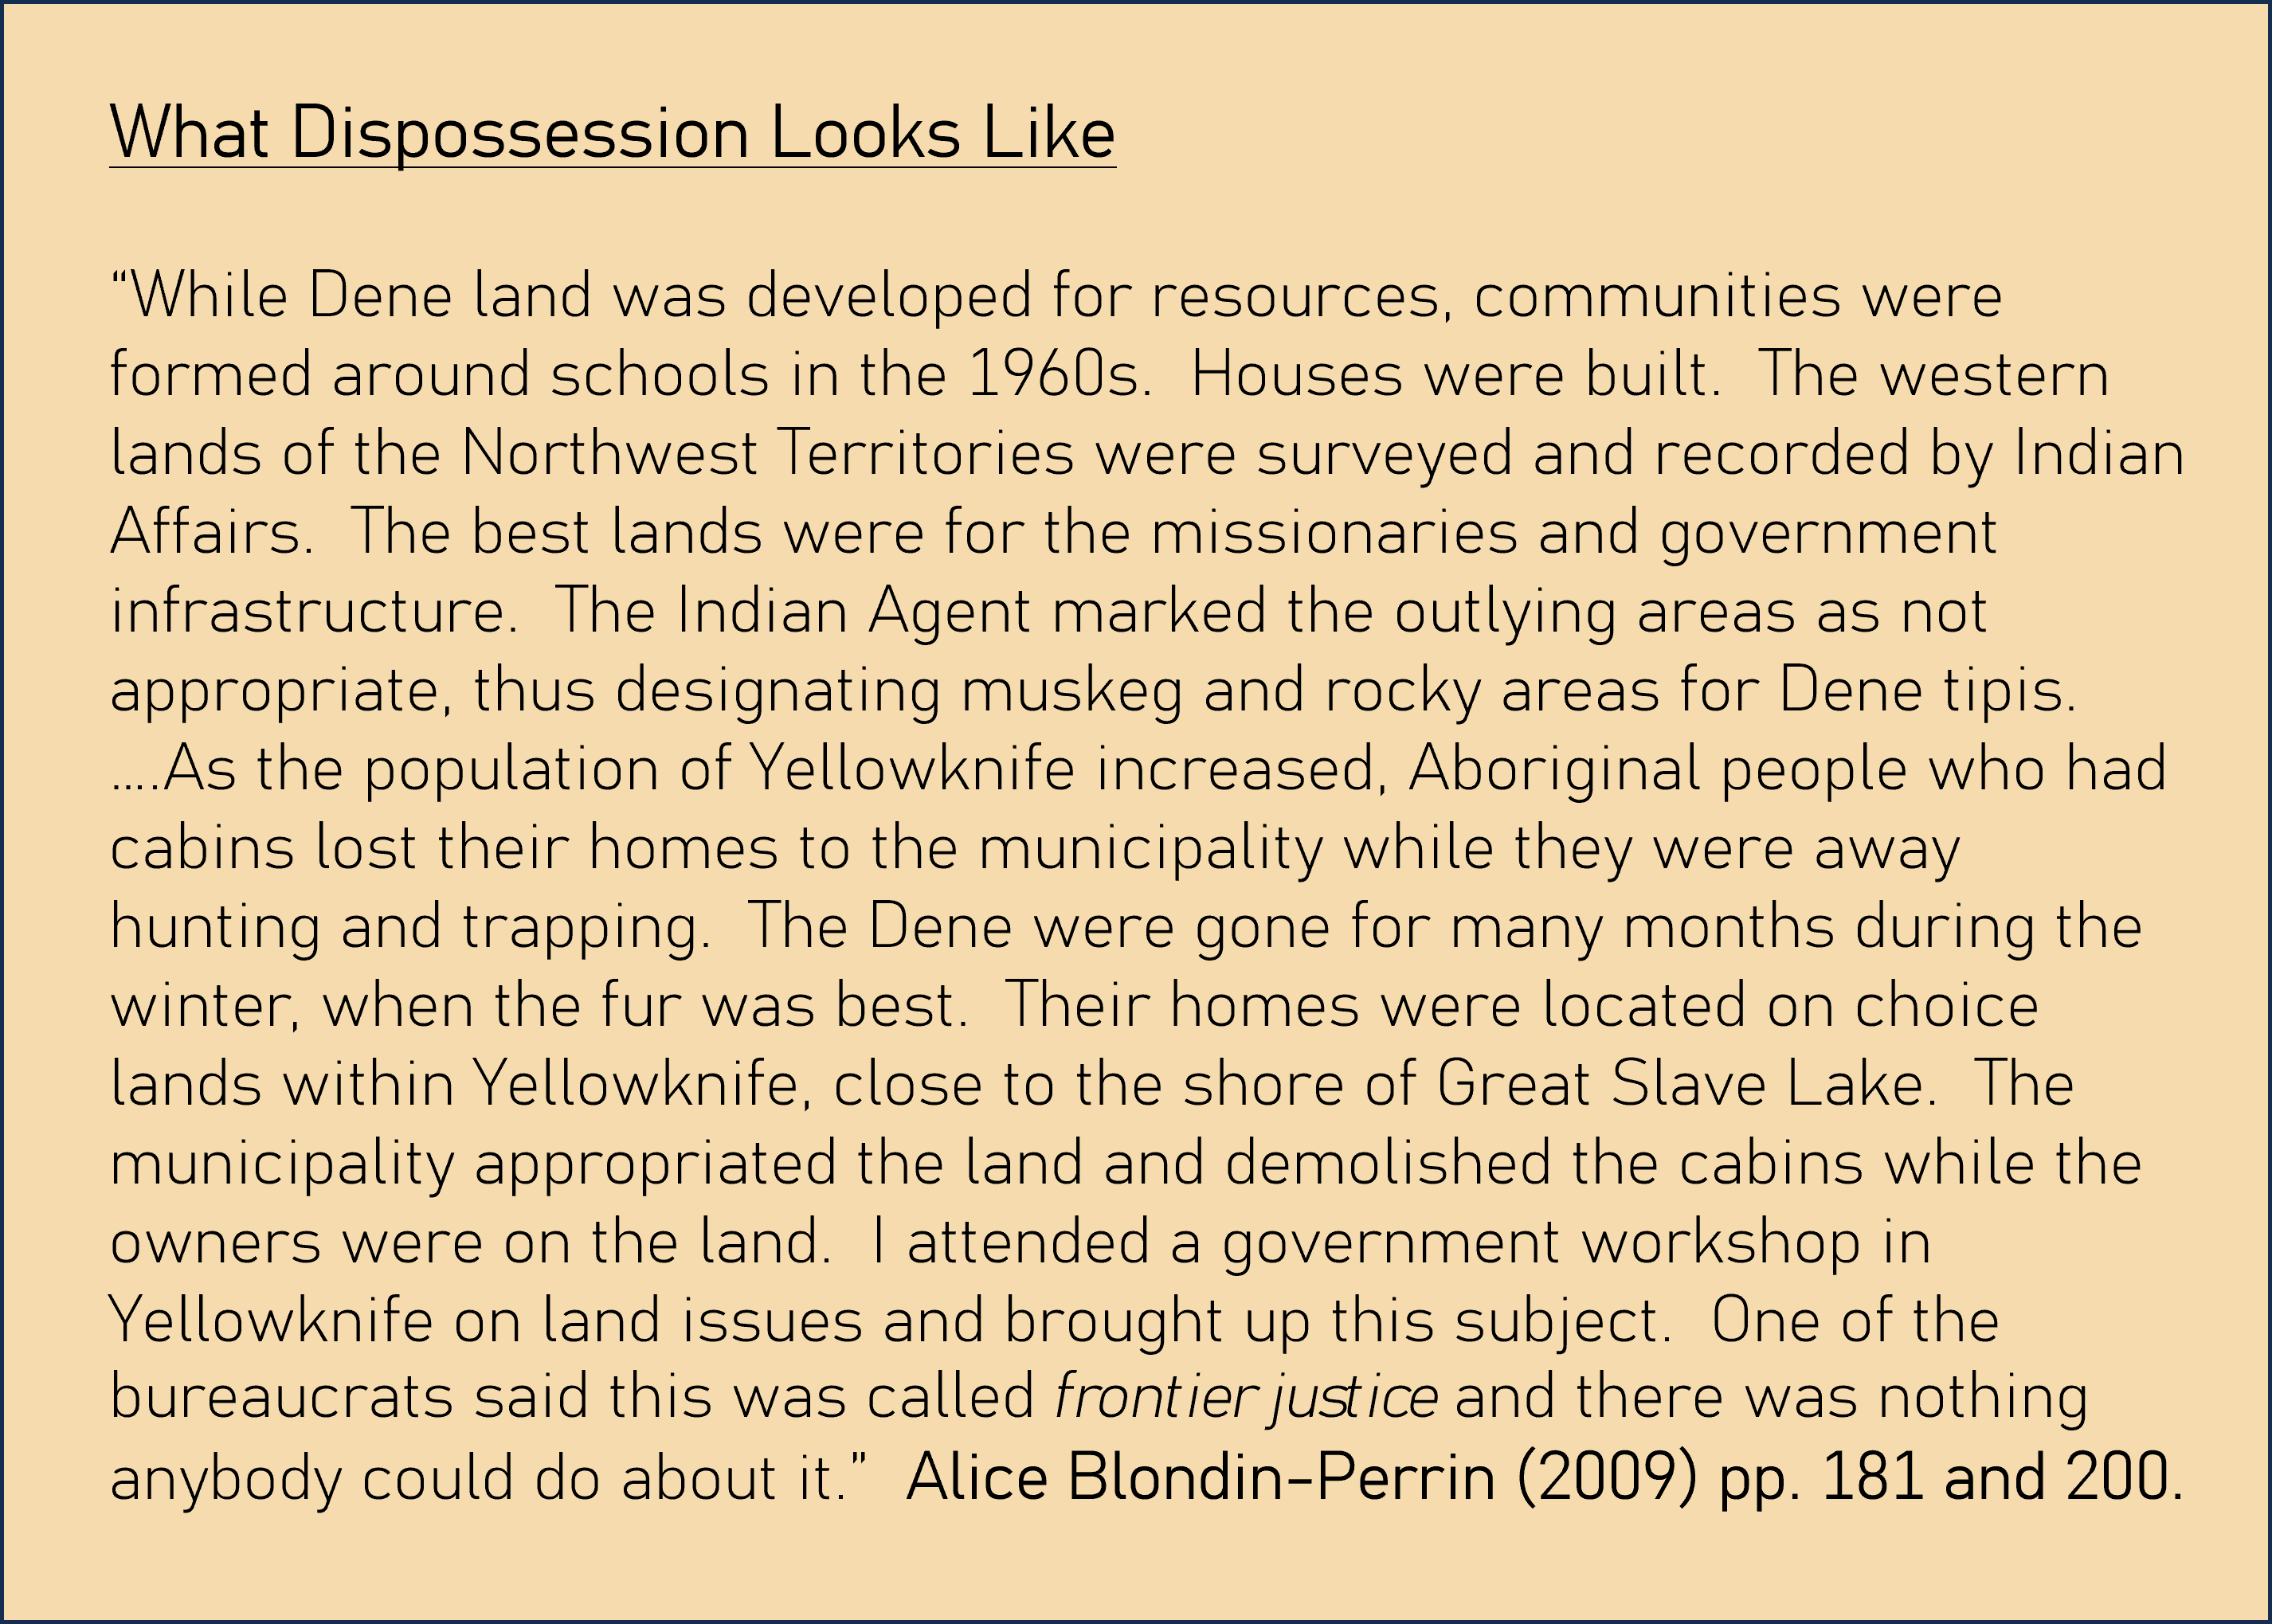
- Second, we could think of racism and discrimination as a technology people adopt to reduce the cost of dispossession and shift the supply curve down and to the right. The more people who are racist, the easier it is to bend the laws that might exist or create new ones that facilitate expropriation. Racism reduces the psychic or emotional cost to the perpetrator of having to do something nasty to acquire land, because the racist worldview rationalizes away the nastiness. Indigenous people themselves might subconsciously absorb the racist attitudes and lose the will to resist.
- In the third way of looking at racism, racism is a byproduct of expropriation, an external cost – to the settlers – of expropriation. A racist way of thinking is a moral injury that is incurred as a consequence of pushing forward with one’s own desire for land, and justifying one’s actions afterward. This racism has long-lasting consequences, damaging for generations the opportunity to relate to and learn from Indigenous peoples.
Many non-Indigenous Canadians say that they should not be held responsible for what happened to the lands and the lives of the Indigenous peoples of Canada.
Any fraudulent or coercive land transactions happened long ago. To quote Diangelo (2018) once more:
“While I am aware that race has been used unfairly against people of color, I haven’t been taught to see this problem as any responsibility of mine; as long as I personally haven’t done anything I am aware of, racism is a non-issue. This freedom from responsibility gives me a level of racial relaxation and emotional and intellectual space that people of color are not afforded as they move through their day.”
Yet, if we have benefited from the racism of the past, if we enjoy any privilege inherent in existing institutions, traditions, and expressions of culture without working to include the marginalized, then we perpetuate the injustice.
Model 4: A social Kuznets Curve
When we consider the history of Indigenous: Settler relations in Canada, we might describe an initial respect and mutual consideration, based on the idea that each could be a trading partner and military ally of the other. Later, however, with trading routes and political borders established, and many more settlers having arrived, racism on the part of the settlers began to increase. After more than a century of severe discrimination, settler attitudes began to improve. The most recent period represents the most rapid repudiation of racist thinking and policies.
This suggests a racism: time function or a racism: economic development function in the shape of an inverted U – the classic pattern known as the Kuznets Curve.
[98]
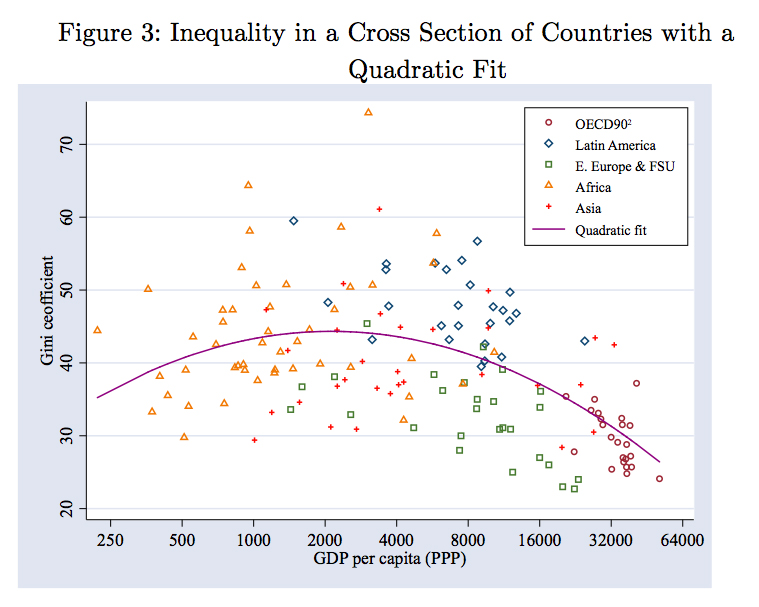
Simon Kuznets, writing in 1955, proposed a U-shaped relationship between a country’s GDP per person and the degree of income inequality within the country. Figure 3 on the next page is an international Kuznets curve created by Gallup (2012) using 2010 data.[9] While Gallup has found a fairly convincing Kuznets curve across countries in 2010, he concludes that a Kuznets curve does not well represent patterns of inequality for individual countries over time.
The Kuznets curve has been used to correlate pollution with economic development, specifically local, non-accumulating pollution such as smog. At low levels of economic development, there is not much industry and not much pollution. As industrialization occurs, pollution is tolerated for the sake of economic development. In the third stage, voters feel sufficiently economically secure to be willing to pay for environmental cleanup.
Model 5: Forest Succession as a metaphor for power struggles
Our final model is exposited by Professor Robin Wall Kimmerer, a botanist, author, and Potawatomi knowledge keeper. It is based on the Land, specifically on the way forests regenerate after experiencing fire, avalanche, clear-cutting, and other disruptive events.
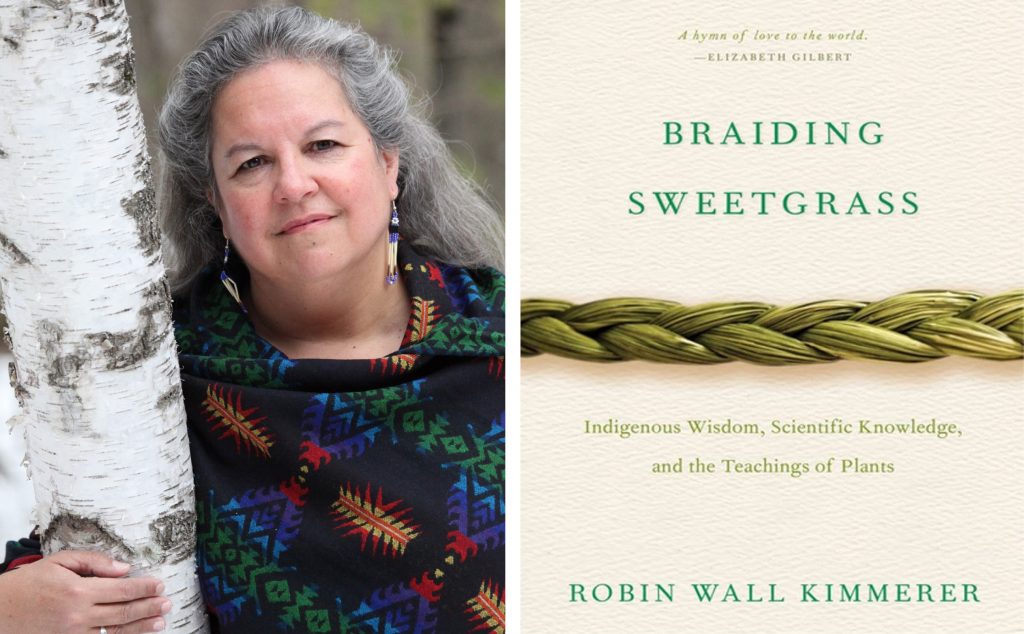
Whereas the Kuznets model associates inequality with a stage of economic development that is eventually passed, the Kimmerer model associates power struggles and inequality with a stage of an ecological cycle which passes and then returns. Colonization and exploitation follow a natural pattern. This understanding is not meant at all to validate colonization and exploitation.
In her 2013 work Braiding Sweetgrass: Indigenous wisdom, scientific knowledge, and the teachings of plants, Kimmerer offers many lessons on holistic living, sustainable economics, and the circle of life, based on her observations of plants and ecosystems. In the chapter titled “Old-Growth Children”, she draws parallels between Indigenous:settler history and the stages of forest succession:
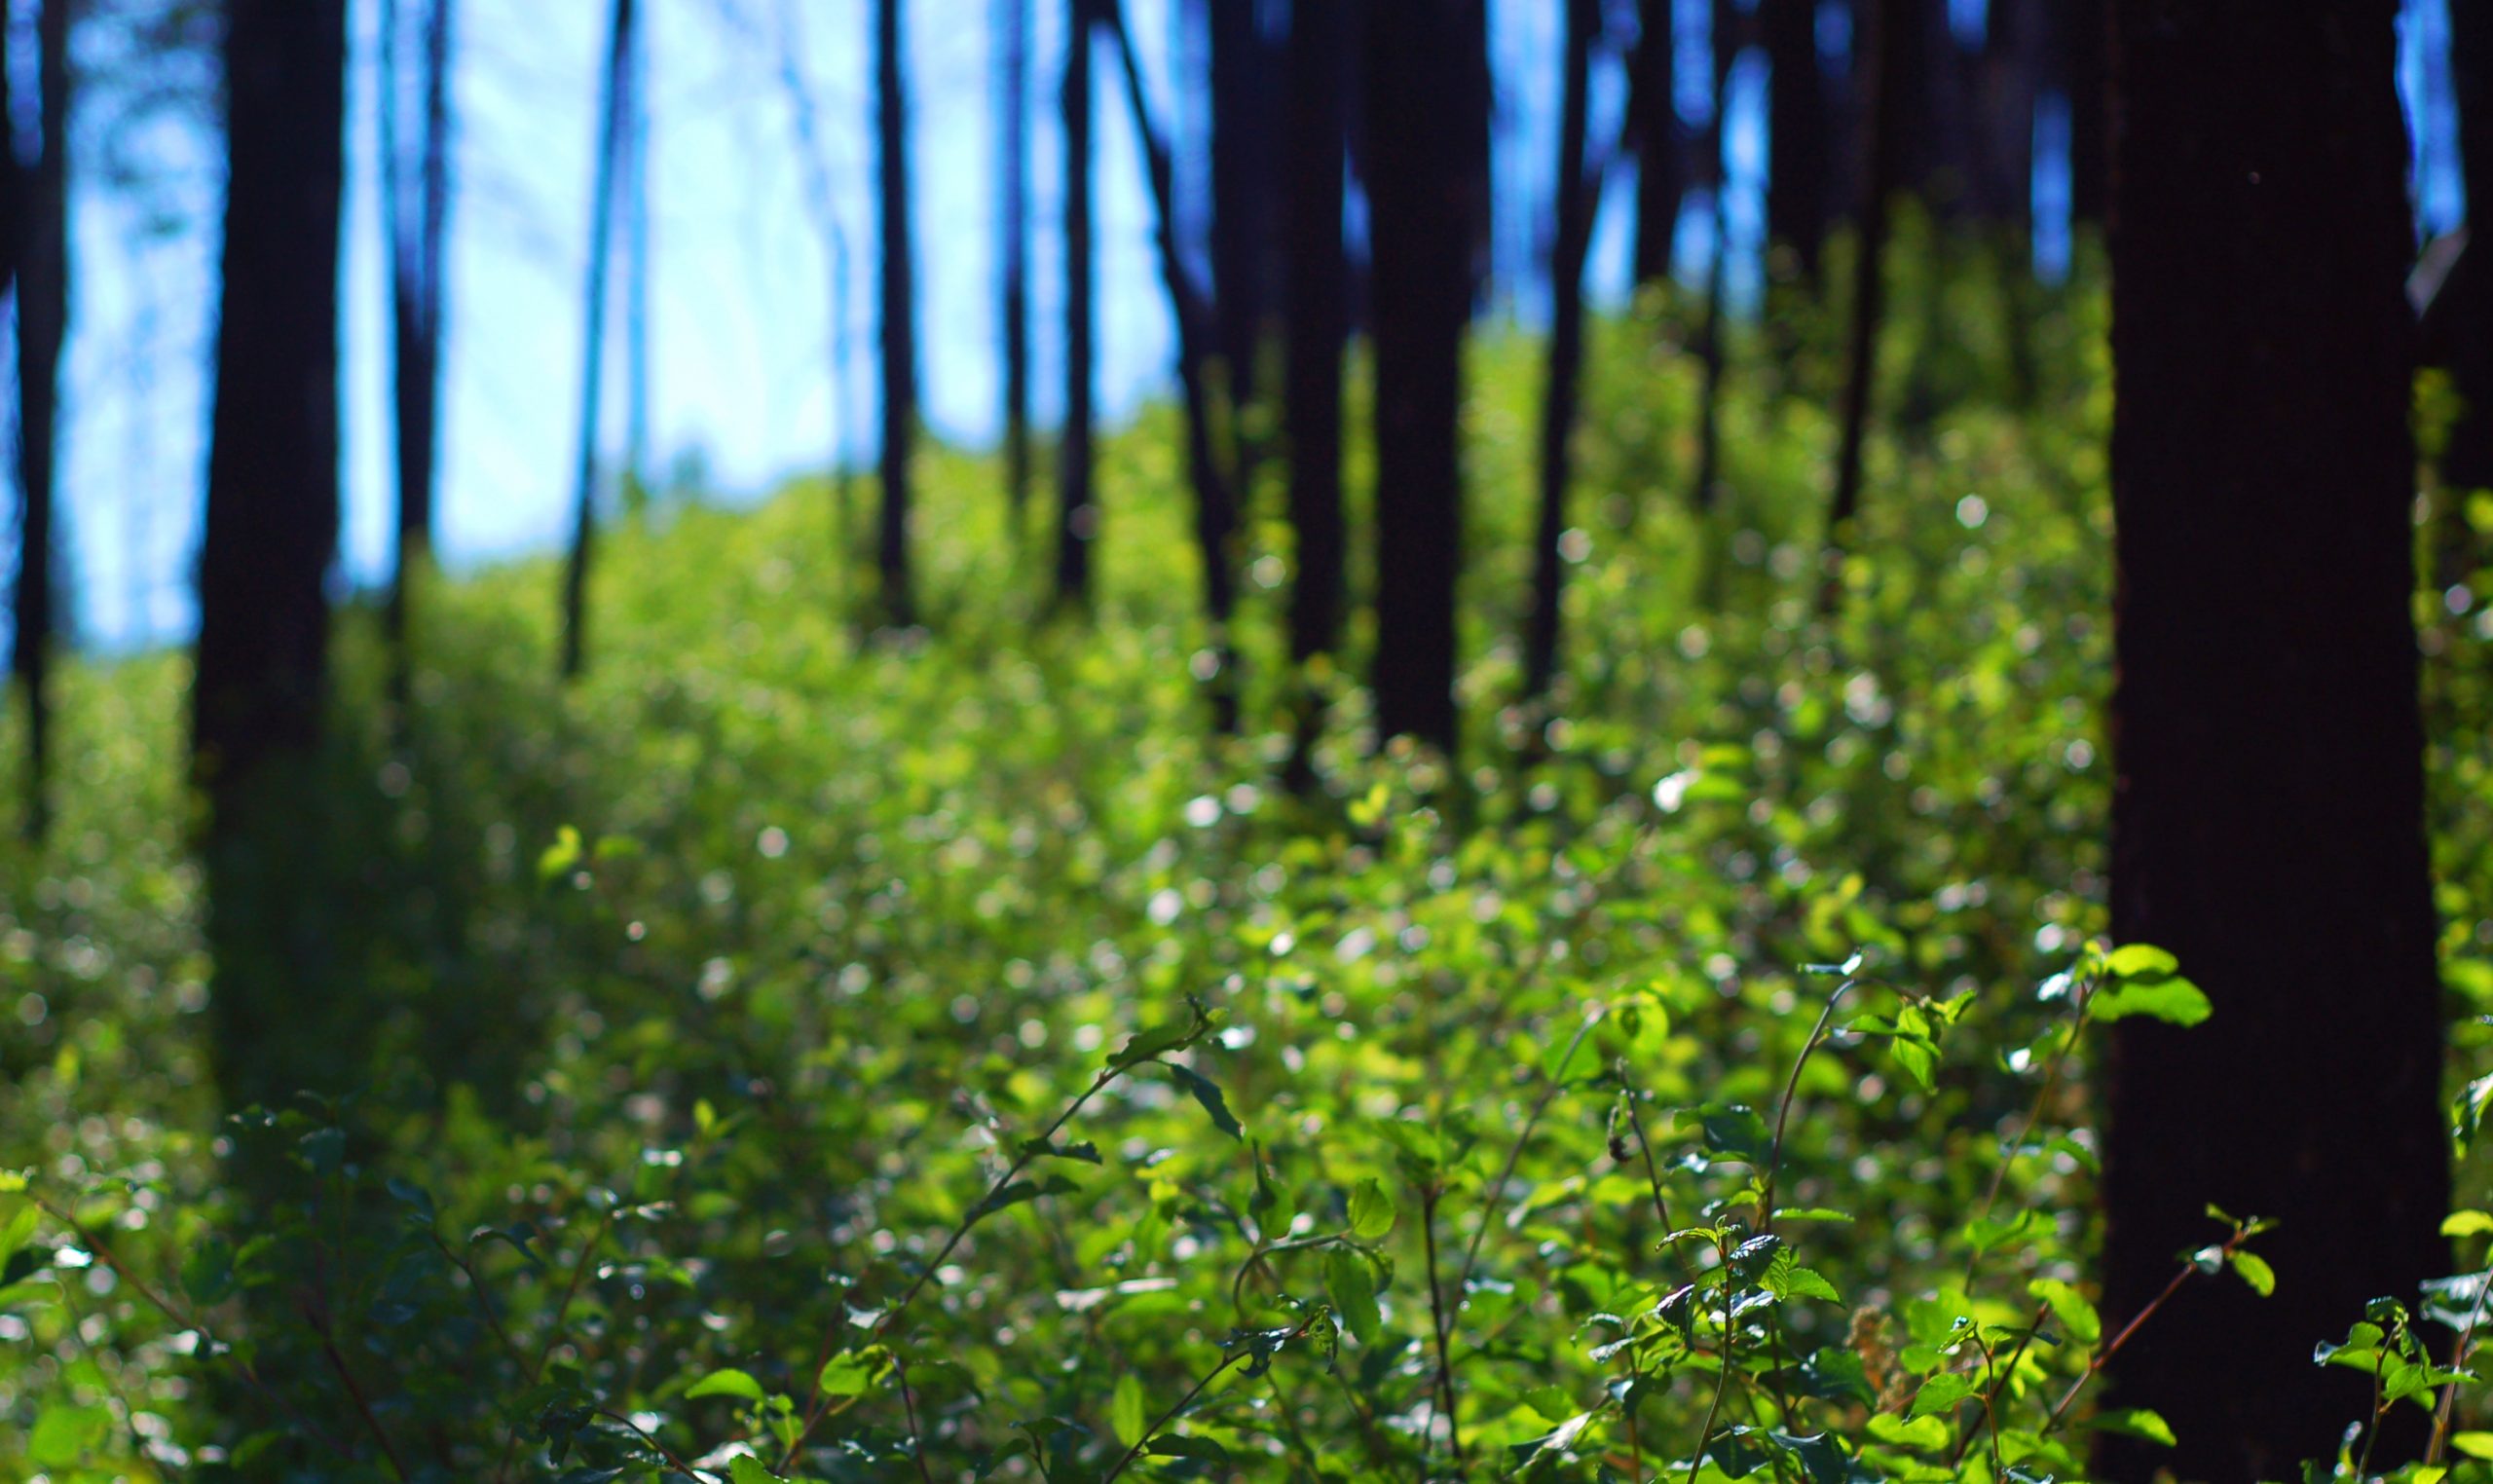
Forest succession begins with disruption. “After land is clear-cut, everything changes. Sunshine is suddenly abundant. The soil has been broken open by logging equipment, raising its temperature and exposing mineral soil beneath the humus blanket.”
How does this remind you of first contact with Europeans and Indigenous? Of later years? Can anything good come of this?
How does this remind you of the early traders and their Indigenous partners? Of settlers?
“The key to success is to get more of everything than your neighbor, and to get it faster.”
Think of this in relation to colonial powers and their mercantilist strategies.
“That life strategy works when resources seem to be infinite.”
For whom?
“But pioneer species, not unlike pioneer humans, require cleared land, hard work, individual initiative, and numerous children. In other words, the window of opportunity for opportunistic species is short. Once trees arrive on the scene, the pioneers’ days are numbered…”
In socioeconomic terms, who or what are the trees? How do they limit opportunistic growth?
“…so [the pioneers] use their photosynthetic wealth to make babies that will be carried by birds to the next clear-cut. As a result, many [pioneer species] are berry makers: salmonberry, elderberry, huckleberry, blackberry.”
What might this berry-making represent?
“The pioneers produce a community based on the principles of unlimited growth, sprawl, and high energy consumption, sucking up resources as fast as they can, wresting land from others through competition, and then moving on.”
What harm do pioneers do? What do pioneers create that is positive for the environment and the future forest?
“When resources begin to run short, as they always will, cooperation and strategies that promote stability… will be favoured by evolution. The breadth and the depth of these reciprocal symbioses are especially well developed in old-growth forests, which are designed for the long haul.”
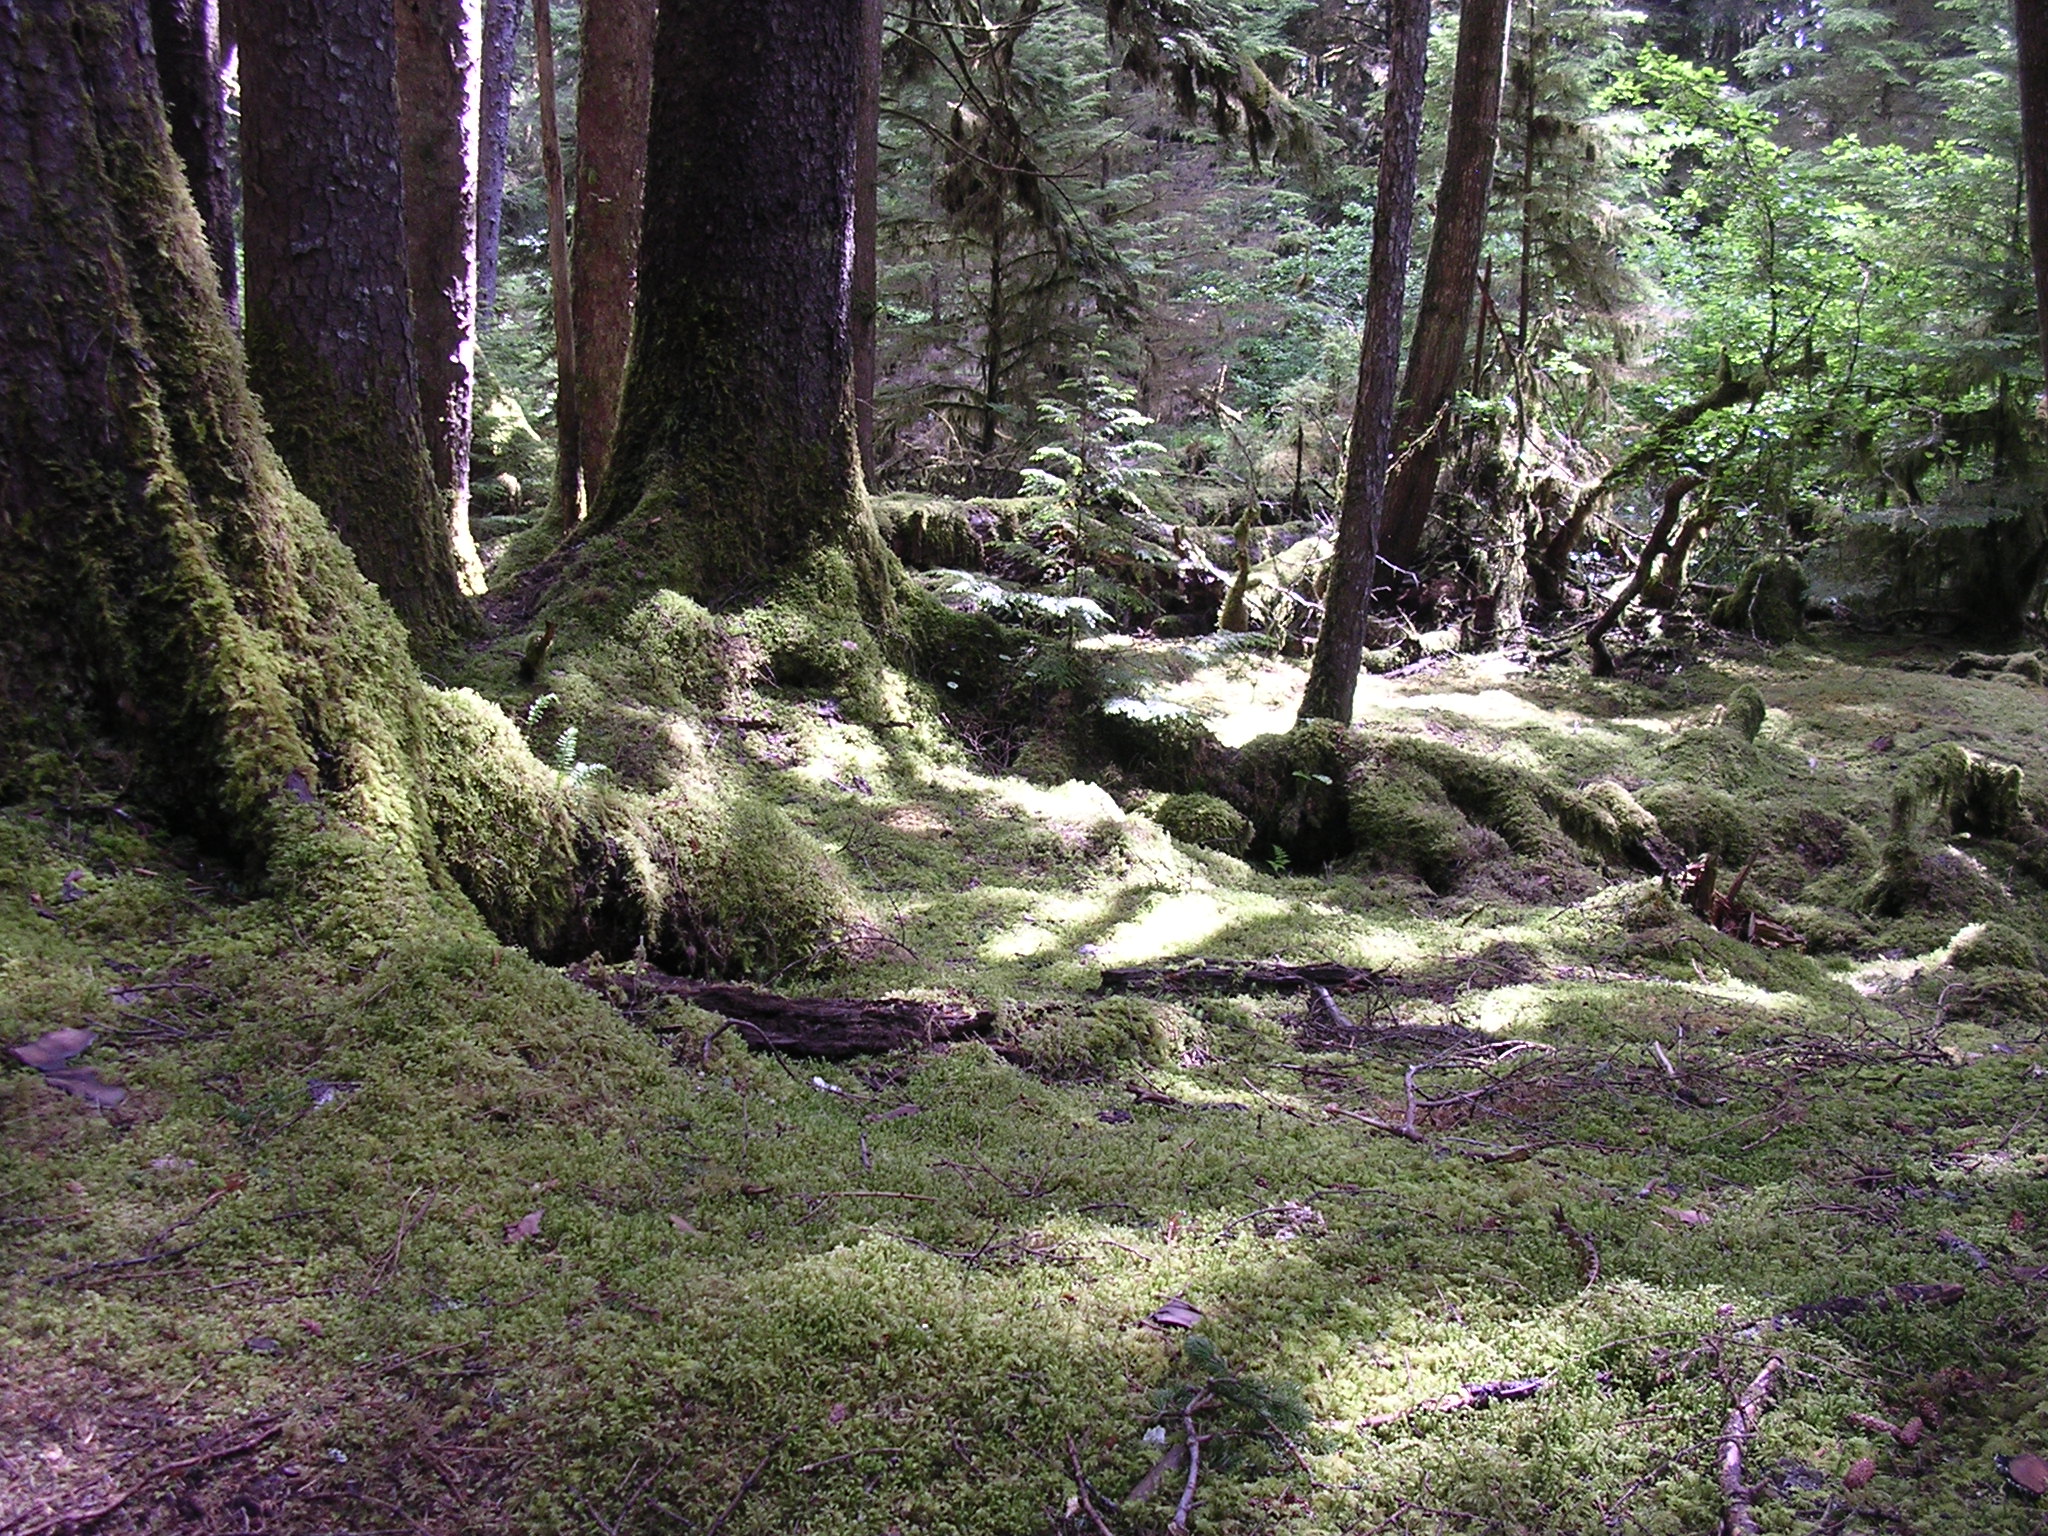
“The old-growth forest is as stunning in its elegance of function as in its beauty. Under conditions of scarcity, there can be no frenzy of uncontrolled growth or waste of resources. The “green architecture” of the forest structure itself is a model of efficiency, with layers of foliage in a multilayered canopy that optimizes capture of solar energy. If we are looking for models of self-sustaining communities, we need look no further than an old-growth forest. Or the old-growth cultures they raised in symbiosis with them.”
And yet…
though the old-growth forest seems to represent an ideal equilibrium in wet climates, not all old-growth forests represent sustainable equilibria. They may be naturally susceptible to fire; they may even require fire for their long-term survival.
Indigenous people used fire to intentionally burn forest in some landscapes. Today, controlled burns are part of many forest management and habitat restoration programs. In a controlled burn, the time of year for the burn, the area to be burned, the weather, and the boundaries of the area to be burned are carefully chosen to control the heat, the speed, the extent, and the impact of the burn.
Sometimes a controlled burn is intended to eliminate the accumulation of dry branches, leaves, and seed cones on the forest floor that could otherwise fuel a very hot and rapidly-moving fire should something – like a lightening strike, an electricity cable, or a cigarette butt – provide a spark. Sometimes the purpose of a controlled burn is to restore particular plant species (like big bluestem grass and prairie orchids), and the creatures that feed on them (like monarch butterflies and bison). “A lot of ecosystems are adapted to fire, and need disturbances, like grazing and fire, to be maintained,” according to Sam Knight of the Nature Conservancy of Canada.[10]. The fire serves to check the growth of species that tend to take over the ecosystem. It returns nutrients to the soil, makes the soil more receptive to rain, allows more sunlight to penetrate to the level of the soil, and triggers the release of seeds from seed cones.
As Kimmerer acknowledges, there is a natural balance between early successional stages (forest disruption, pioneer species), and later successional stages (forest maturation, old-growth forest).
Let’s Discuss
- What is the economic equivalent of an old-growth forest? What are the benefits provided?
- Review the benefits of forest fire. What is the economic equivalent of a controlled burn?
- How might human behaviour result in something other than a natural balance of young and old forests? Of young and old economies?
- Is there a role for human leadership and ethical decision-making in this model?
The five models of discrimination we have discussed in this chapter offer very different perspectives on discrimination and dispossession, but each seems to offer an insight into this age-old problem. In our next chapter we’ll learn how to measure discrimination using econometrics.
- Feld, J., Salamanca, N., and D. Hamermesh (2015) ↵
- March 20-27 online survey by Angus Reid Institute, reported in Maclean’s Magazine, July 2018 ↵
- Saunders (2020) ↵
- See Chapter 8, Housing, page 236. ↵
- https://www.youtube.com/watch?v=3WCpEsxBSi8 ↵
- The “marginal” White person in a state where x% of the workforce is Black would be the White individual x% from the bottom in a ranking of White survey respondents according to level of prejudice ↵
- Diangelo (2018), p. 19 ↵
- Coates (2015) ↵
- Gallup, J. L. (2012) ↵
- Peters (2022) ↵
The value of the marginal product of a worker is how much they produce in an hour multiplied by the price of what they have produced. In an efficient market, workers should be paid a wage that is equal to the value of their marginal product.
We use the word expropriation to mean taking someone's land without their permission, with the amount of compensation - if any - being determined by the expropriator's government, if that government is able and willing to enforce compensation.
An equilibrium is a steady state from which there is no tendency to deviate. If disrupted, things naturally return to their equilibrium state, if there is one.
