The Modern Treaty Era
There are over six hundred First Nations occupying over 3,300 parcels of reserve land in Canada. The six hundred-plus First Nations may or may not have modern treaties or other agreements with federal and provincial governments. If they are still under the Indian Act, they may or may not have signed on to some of the optional amendments to the Indian Act mentioned in our previous chapter.
There are over fifty majority-Inuit communities, and eight Métis settlements. First Nations, Inuit and Métis also live in regular cities, towns, and rural areas across Canada – perhaps geographically isolated from one another (Ottawa), perhaps living in distinct neighbourhoods (Winnipeg), perhaps forming the majority of the population (Moosonee).
This great variety of Indigenous communities serves as an extensive natural experiment as to which forms of organization, goverment, and financing best promote well-being. In years to come the data from these various communities will be mined for insights by researchers, perhaps by you! For now, the data is limited.
To access and explore a spreadsheet with over six hundred majority-Indigenous communities, their 2016 populatoins and Community Well-Being scores, their remoteness scores, and treaty information, go to Indigenous Community Database. The author will add 2021 data when it becomes available. The author thanks Fiona Marshall Young for assistance in compiling these data.
In this chapter we’ll compare Community Well-Being (CWB) scores across different community types. As you may recall, CWB scores reflect a community’s income, employment, educational achievement, and housing.
First Nations living on reserve
Many reserves are faring well in terms of business development and economic growth. For example, Membertou First Nation near Sydney, Nova Scotia boasts ISO 9000 designation[1], an international standard of management quality, and its Membertou Development Corporation was named one of Canada’s best-managed companies in 2019. In 2020, Membertou First Nation joined with other Mik’maq communities and with Premium Brands Holdings Corporation in a billion-dollar deal to purchase Clearwater Seafoods Incorporated, the largest holder of shellfish licenses and quotas in Canada. The Community Well-Being score for Membertou First Nation in 2016 was 70, not far from the average score for non-Indigenous communities, 77.5.
There are also nineteen First Nation reserves and other First Nation communities whose 2016 Community Well-Being scores exceeded 77.5. And not all of these communities were near large urban centres. The list includes Opaskwayak Cree Nation (near Le Pas, Manitoba), Matsqui First Nation (near Abbotsford, British Columbia), and Shuswap Indian Band (in eastern British Columbia).
At the same time, in 2016 eighty percent of reserves had median household income below the poverty line.[2]. Within reserve communities, a significant minority of individuals and households were relying on provincial welfare payments, and, as shown below, First Nations governments were typically very dependent on federal and provincial transfers. These government transfers were not sufficient to keep poverty at bay.
Almost one quarter of First Nations were receiving some kind of intervention to help them pay their debts.[3] According to Flanagan (2019), as a first step Indigenous Services Canada requires a community with debt issues to create a plan for addressing their budget deficits and debts. The second step, if needed, is to require the community to hire an external accountant to co-manage finances. Finally, ISC imposes third-party management on the band: a person outside the community is hired to run the finances. Only seven reserves were under third party management in 2018.[4]
Flanagan (2019) found that whether or not a community was under third party management correlated strongly (and inversely) with its Community Well-Being Index score, even when adjusting for the Band’s remoteness and earnings.
This suggests that, while poverty may contribute to financial disarray, the causation is likely to be more in the reverse direction; that is, financial disarray contributes to poverty.
There are deeper reasons for poverty than financial disarray, however, such as intergenerational trauma, historic losses, remoteness, discrimination, lack of borrowing opportunities, and other disadvantages.
Poverty appears to be greatest among the First Nations who experienced the sudden loss of bison and sudden confinement to reserves. Table 1 shows us that signatories to the Numbered Treaties have the lowest 2016 Community Well-Being Scores.
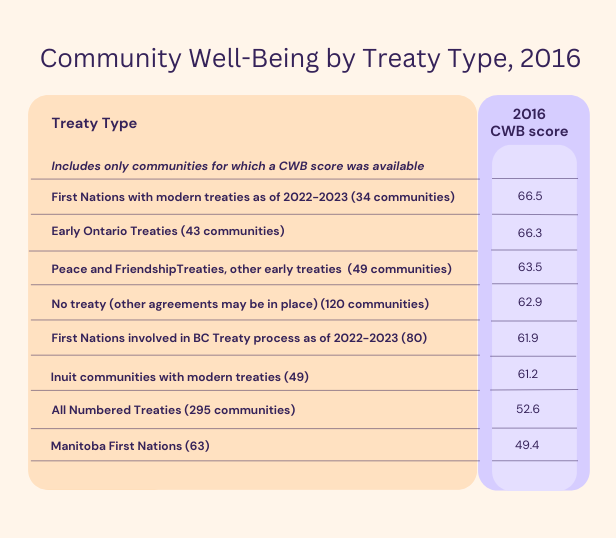
First Nations with earlier treaties appear to be doing better than First Nations for whom colonization is a more recent, more raw experience.
On reserve, between 2005/6 and 2015/6[5] :
- the employment rate, which is the fraction of working-age adults who are employed, decreased
- the labour participation rate decreased
- the unemployment rate was about the same (increased for men; decreased for women)
- the fraction of people whose main source of income was government assistance rose but
- median income rose faster than non-Indigenous median income
- median income was still more than $17,500 below non-Indigenous income
- female median income continued to be higher than male median income
- the high school completion rate for youth rose by from 38.9% to 48.4%
- the proportion of people living in dwellings needing major repairs stayed at about 44%
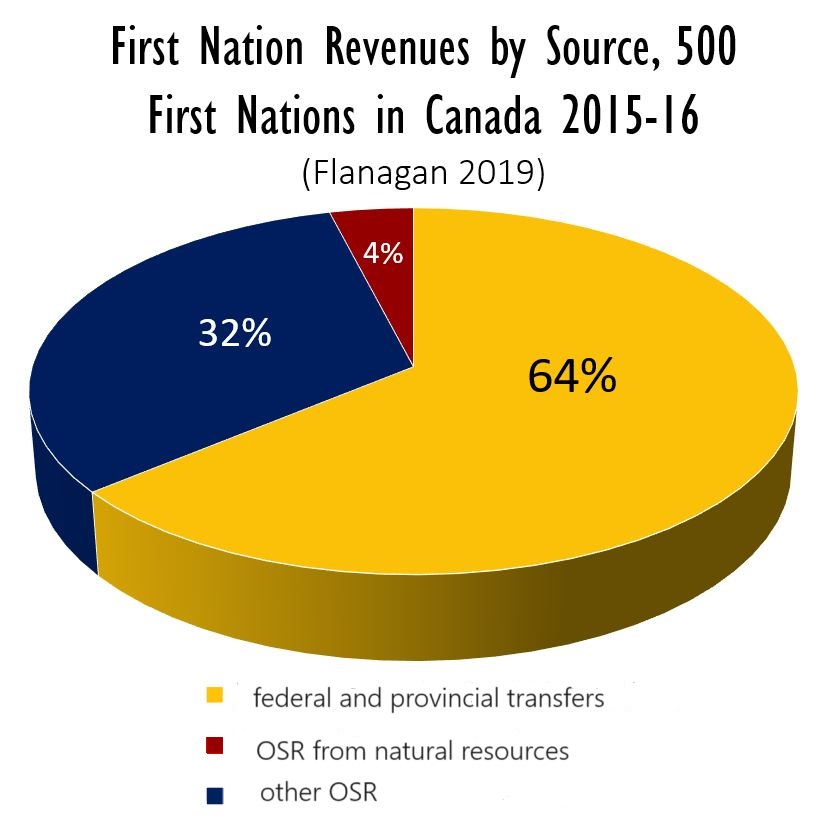
In 2015/6, about 64% of First Nations’ revenues came from the federal and, to a much lesser degree, provincial and territorial governments. The rest came from own-source revenue (OSR). OSR is income from Band-owned businesses, royalties from resource extraction, rents from leased land, payments from Impact Benefit Agreements, and interest on trust funds. The ten highest-earning First Nations accounted for 18% of the total own-source revenue. Concludes Flanagan (2019), “OSR is about as unequally distributed as income in the larger Canadian society”.
Métis Settlements
In our last chapter we described the funding and rights of the eight Métis Settlements in Alberta. While census data is available, the Community Wellbeing Index is not computed for them. Due to their remoteness we expect that their CWB would be more similar to those of First Nations living on reserve rather than to Métis who live in urban areas.
Métis and First Nations living off reserve
Métis and First Nations living off-reserve have higher median income than First Nations on reserve. For both groups between 2005/6 and 2015/16[6] :
- the employment rate decreased
- the labour participation rate decreased
- the unemployment rate increased for men in both groups, but stayed the same for women in both groups; the gap with non-Indigenous men shrank, however
- the fraction of people whose main source of income was government assistance stayed about the same
- median income rose faster than non-Indigenous median income and was only $2,700 below non-Indigenous median income for Métis and about $9,500 below non-Indigenous median income for off-reserve First Nations
- the high school completion rate for youth ages 20-24 rose by 12% for First Nations off reserve and 9% for Métis, narrowing the gap with non-Indigenous graduation rates to 49.3%
- the fraction of the population living in dwellings in need of major repair fell by about 3 percentage points for each group, to 13.8% for off-reserve First Nations and 11.3% for Métis.
Inuit Communities:
Most Inuit are living in areas covered by Inuit self-government agreements: Nunavut, Nunavik, Inuvik, and Inuvialuit. For Inuit between 2005/6 and 2015/6[7]
- the employment rate increased overall but decreased for men; the gap with the non-Indigenous employment rate shrank
- the labour participation rate increased; the gap with non-Indigenous labour participation shrank
- the unemployment rate increased
- the fraction of people whose main source of income was government assistance rose slightly
- median income rose at about the same rate as non-Indigenous median income and was about $10,000 below non-Indigenous median income
- the high school completion rate for youth ages 20-24 rose to 49.3% from 39.8%
- the fraction of the population living in dwellings in need of major repair decreased slightly to 26.2%
First Nations and Inuit with Modern Treaties
Because of the autonomy of First Nations with modern treaties, their financial statements are not published for or by Indigenous Services Canada. It is not obvious how to find each entity’s financial statements.
Community Well-Being scores are available for many of the larger communities. Overall, the self-governing Inuit and Cree, as well as Tsawwassen First Nation, the Nisga’a, and Sioux Valley Dakota Nation in Manitoba appear to be doing better economically than comparable communities without modern treaties. This accords with Flanagan and Johnson(2015), who found a statistical correlation between CWB scores and self-government agreements for Canada’s First Nations. However, evidence from the Northwest Territories is not as positive. Clearly self-government agreements are not a ticket to instant prosperity.
The details are as follows:
- All the Inuit communities are under modern treaties. The average Inuit community score (61.3) is higher than the average First Nation community score (58.4), despite Inuit populations being smaller on average, and their communities being located further north.
- On the west side of James Bay and Hudson Bay, the self-governing Cree communities of northern Quebec have 2016 CWB scores which are higher and less variable than the Nunavik scores: they range from 60 to 68. Among the five communities on the Ontario shores of James Bay and Hudson Bay, which do not have a modern treaty, scores range from 48 to 67.
- In British Columbia, many of the First Nations who obtained self-government agreements are located in the south and were already doing well prior to obtaining a modern treaty. Data on two of these Nations, Tsawwassen with a score of 83 and Nisga’a with a score of 64, show they were doing better in 2016 than the average BC First Nation (score of 62.9).
- In the Northwest Territories, the four communities in the Tlicho Final Agreement have 2016 well-being scores ranging between 56 and 64. These scores are somewhat lower than the 66.3 which is the average for First Nations communities in the Northwest Territories and Yukon.
- The four out of five communities under the Sahtu Dene and Métis Comprehensive Land Claim Agreement for which CWB scores were found have scores between 59 and 66, a little higher yet still slightly below average for the Northwest Territories.
Pendakur and Pendakur (2021) found that First Nations and Inuit communities that had a comprehensive land claims agreement signed prior to 2015 experienced an increase in income of about $15,000. But the effect was diminished by about $4,000 if they also had a self-government agreement. Signing on to the First Nations Land Management Act or the First Nations Financial Management Act or both seemed to cost the community about $3,000, perhaps because these are new programs with associated expenses, and with wrinkles yet to be ironed out. All these amounts are not very large. It will take time to see the results of the differing trajectories.
Our Chapters 24-29 describe some of the hard work that needs to be done to bring prosperity to small, often isolated communities which in many cases have suffered a hundred years of dispossession and interference.
A note on Climate Change
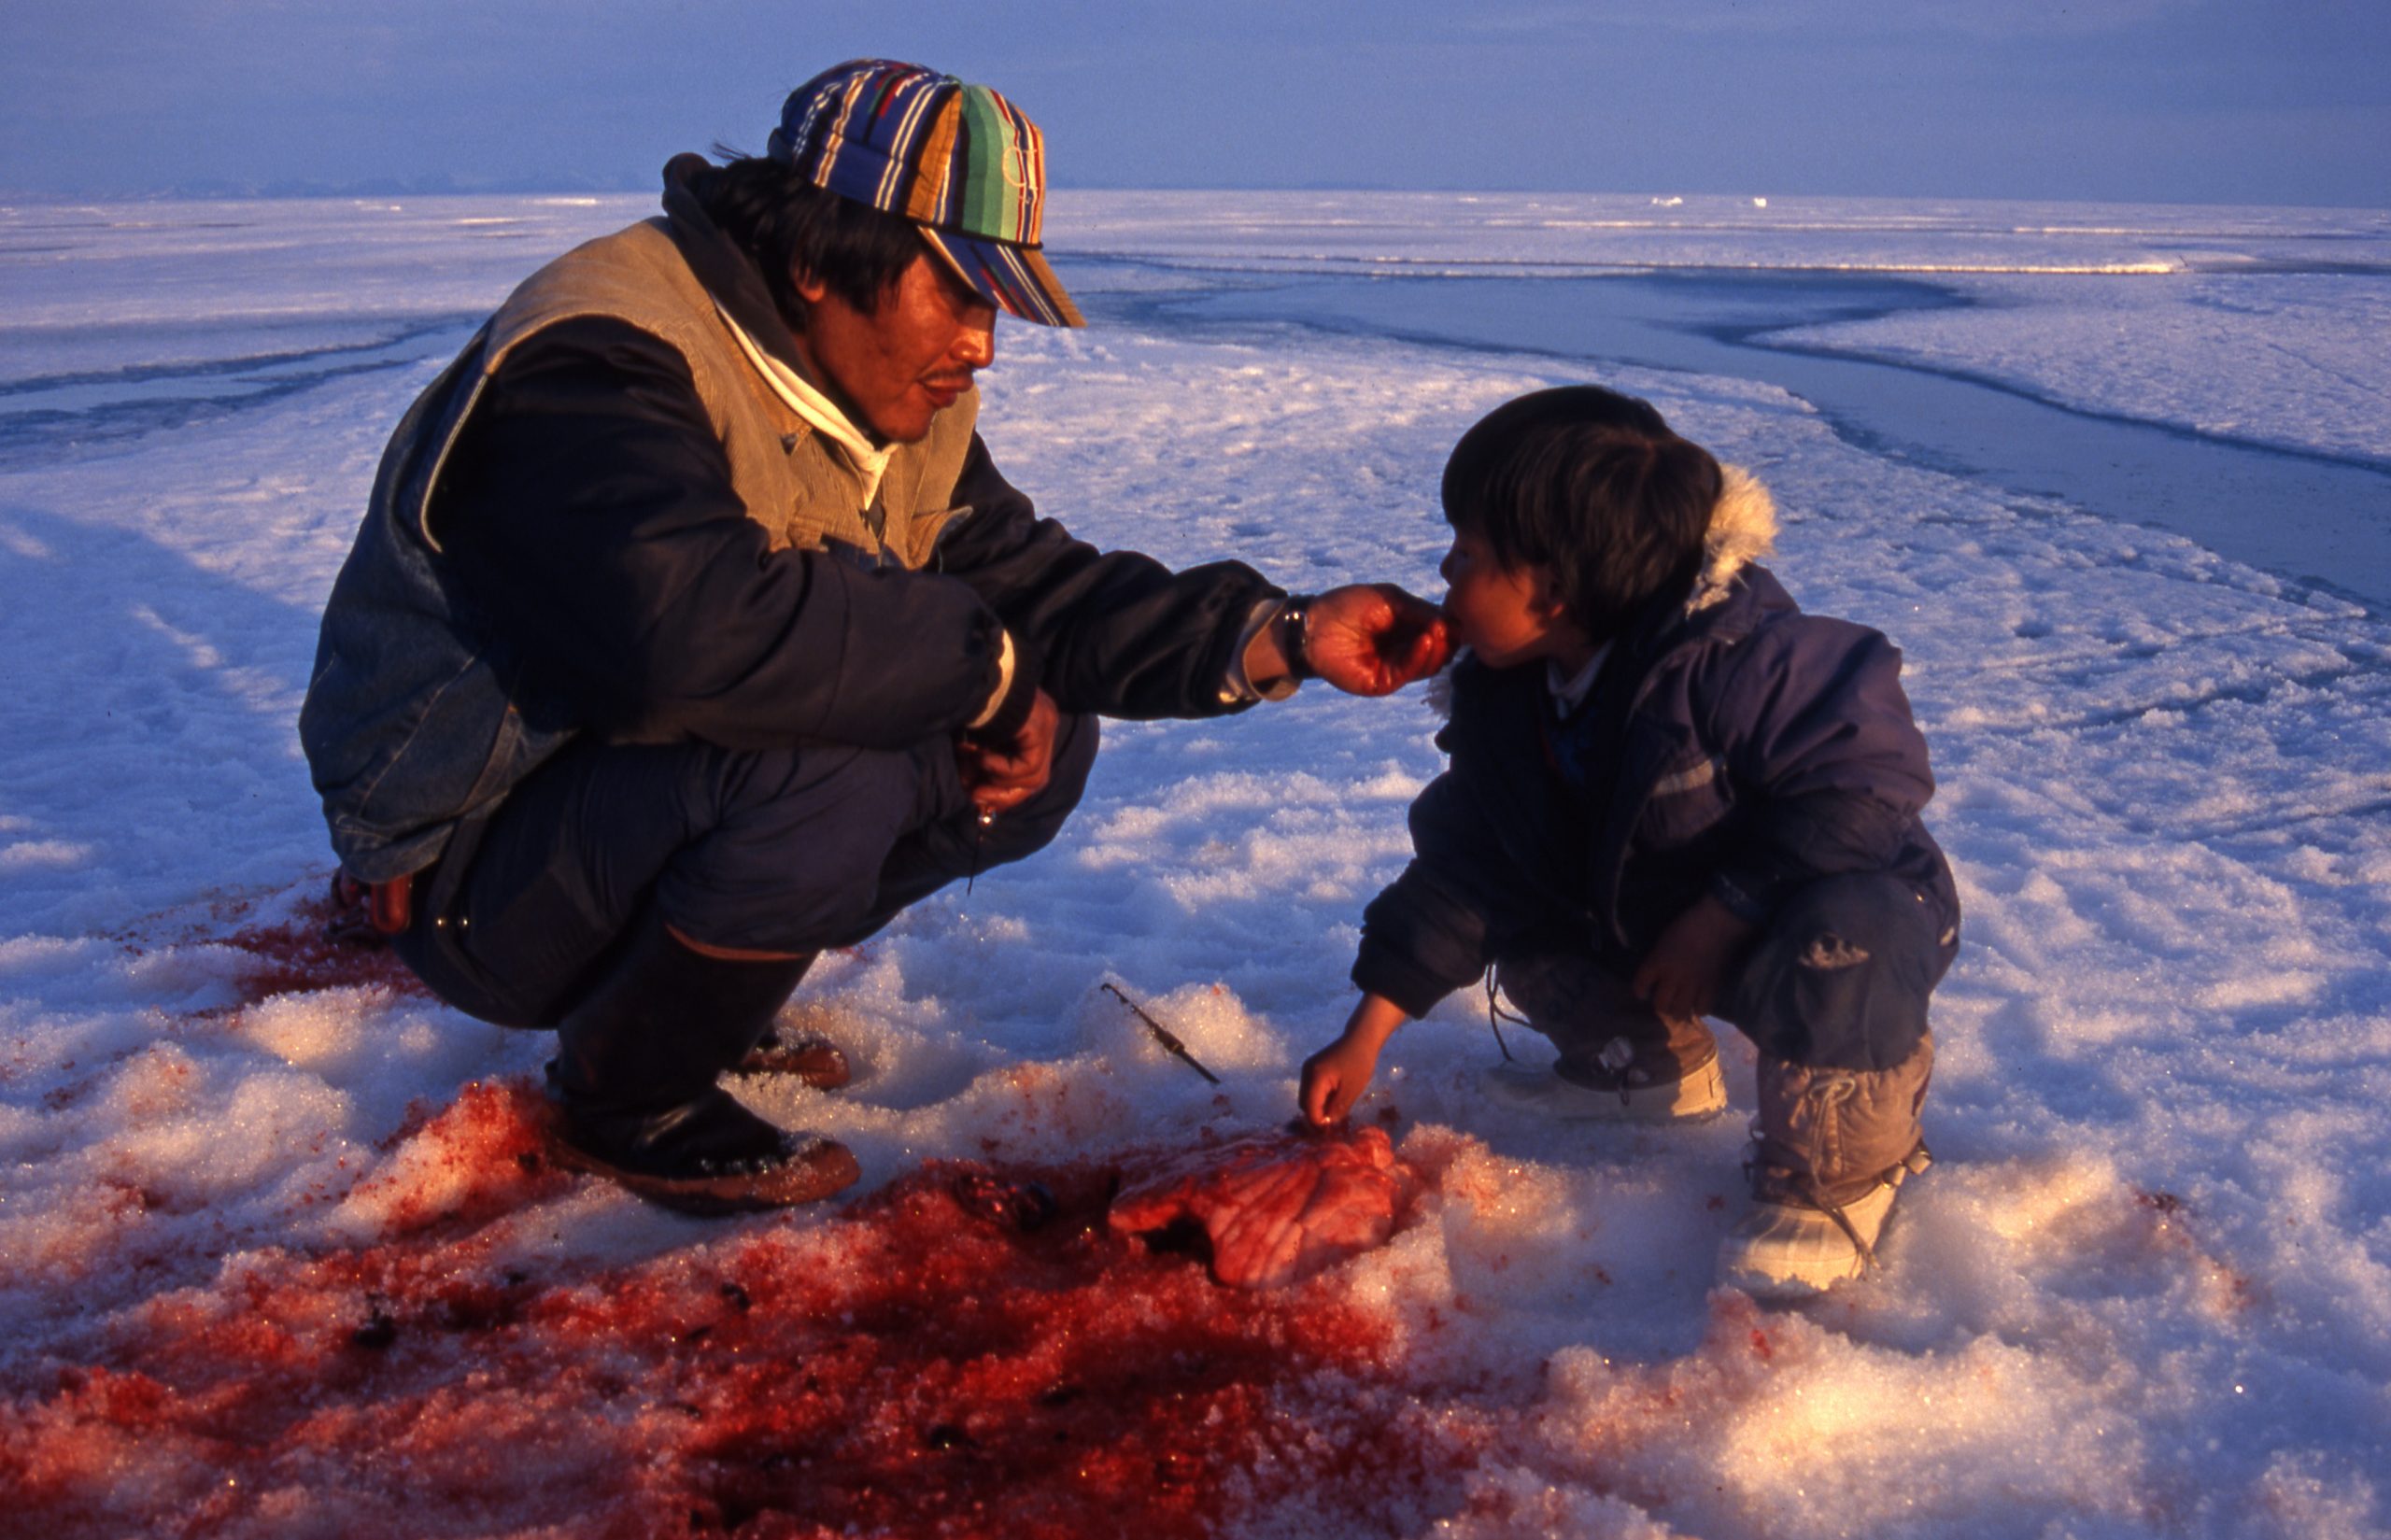
Whether we are talking about northern reserves, Métis settlements, or Inuit communities, climate change presents a threat to hard-won economic gains. As noted by NIEDB et al. (2022), wildfires, permafrost thaw, changes in the predictability and availability of plants and animals, and flooding threaten Indigenous health, incomes, and ways of life.
A note on Economic Inequality
We now have a feel for the current economic status of the various Indigenous communities in Canada. What about the distribution of income within the communities?
We do not have these calculations, but we do have a comparison of income inequality across individual, based on their Indigenous identity.
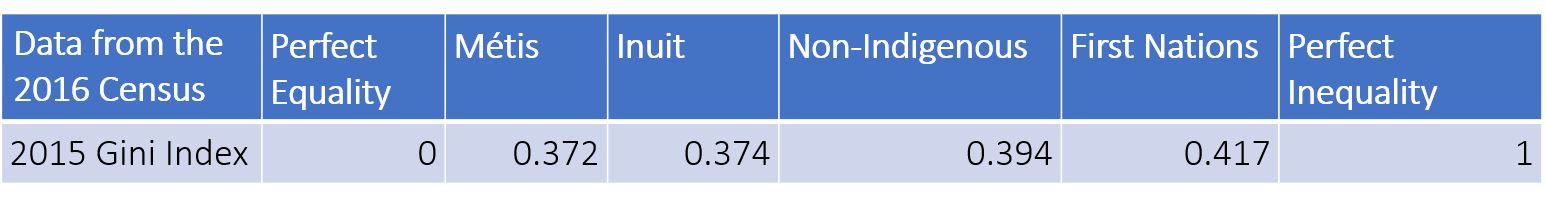
As we see in the table above, data from the 2016 Census indicates that income inequality among Indigenous people is roughly comparable to non-Indigenous individuals.
Inequality will be worse on reserves. On reserves there are typically a dozen high-paying jobs associated with Chief and Council, and several more associated with the heads of various portfolios, but not many other high-paying jobs or high-income earners.
In one university class, students tasked with selecting reserves and comparably sized municipalities, similarly distant from a major city, in Ontario and Manitoba, found that Gini coefficients were three times as high for reserves as for municipalities.[8]
The 2019 Progress Report of the NIEDB, which reported the inequality data in the table above, also reported that while for First Nations off-reserve, 68% of individuals are in the bottom half of the income distribution, 82% of First Nations people on-reserve are in the bottom half of the income distribution. For the total population of Canada, just over 49% of people are in the bottom half.
Pendakur and Pendakur (2021) found that First Nations and Inuit communities having a comprehensive land claims agreement, a self-government agreement, or membership in both the First Nations Land Management Act and the First Nations Financial Management Act signed prior to 2015, experienced less income inequality than other First Nations and Inuit communities. Having a land claims agreement plus self-government agreement decreased the Gini coefficient the most, by about 3.5 percent. Decreases in inequality were immediate in the case of self-government agreements and opt-in agreements, suggesting that increased local control leads to increased community member input into decisions, resulting in a more equal distribution of income.
For more insights into on-reserve inequality, see our chapters on Governance and Employment. Employment and wage data may be more favourable for women than for men on reserve, owing to the prevalence of women in the types of occupations likely to receive government funding.
We have now explored the general economic well-being of Indigenous communities in Canada. In the rest of the book we’ll look at government funding, opportunities for growth in income, employment, education, housing, and infrastructure, the needs of business, and the challenge of being in a remote location.
In our next chapter we explore government funding and whether it is sufficient for its purpose.
- Withers (2020) ↵
- Statistics Canada (June 2019) ↵
- National Indigenous Economic Development Board (2019) ↵
- National Indigenous Economic Development Board (2019) ↵
- Census 2016 data reported in National Indigenous Economic Development Board (2019), Annex A ↵
- National Indigenous Economic Development Board (2019), Annex A ↵
- Census 2016 data reported in National Indigenous Economic Development Board (2019), Annex A ↵
- 16 First Nations and 16 municipalities in Ontario, 18 each in Manitoba, computed using 2015 data from the 2016 Census ↵
Modern treaties are treaties negotiated in or after 1975. They were negotiated with proper legal representation of Indigenous peoples and give Indigenous peoples some self-government powers. Other features of modern treaties are discussed in Chapter 15.
Métis settlements are similar to reserves. They have been set aside by the government of Alberta for Métis communities in Alberta.
