Introduction
We have been introduced to the kinds of Indigenous communities living in Canada today. What generally is the distribution of Indigenous people across Canada? What are their population dynamics? And how are they doing economically? We’ll see that Indigenous people live everywhere in Canada, but that reserve communities, where 41% of First Nations lived in 2021, are often small and isolated. This isolation is one of the reasons Indigenous communities score lower on measures of income, employment, educational achievement, and housing quality. Indigenous people also face higher mortality rates than non-Indigenous Canadians. The Economics of Indigenous communities should be a high priority for study and research. For this we need awareness of relevant history, legislation, and culture. We also need data.
Data Deficits
Until 2020, Canada did not collect race-specific statistics on income, unemployment, housing, and the like. It did, however, aggregate such statistics by community, using data from the Canadian census, and compute an index of well-being for Indigenous vs. non-Indigenous communities, discussed below.
The Canadian Census, however, does not ask questions about business or investments. It does not include information on health. There are surveys on health by racial group, but race-based health and mortality data are not comprehensive. Birth and death records do not specify race except in the case of Registered or Treaty Indian Status persons.
Overall, there has not been the data needed to compare Indigenous versus non-Indigenous mortality, life expectancy, income, employment, business-formation rates, and investment, for example.
In a report completed by Shelly Trevethan of QMR Consulting for Indigenous Services Canada and the Assembly of First Nations, the “poor coordination, lack of data access, lack of capacity, and [in some cases] complete unavailability of data”[1] on First Nations was noted.
The 2018 Auditor General’s Report on Employment Training for Indigenous People[2]concluded that Employment and Social Development Canada did not collect or use viable data when planning Indigenous programs. In fact, Employment and Social Development Canada based its 2017 financial decisions and funding allocations on data collected back in 1996.
Only recently has the federal government changed course. The 2019 federal budget allocated $79 million[3] for surveys on education and health in Indigenous communities. The 2021 budget promised $172 million over five years to Statistics Canada for it to aggregate sources of race-based and gender-based data and track any gaps. Statistics Canada’s monthly Labour Force Survey began collecting data on race and employment in 2020.
 While race-based data could be put to useful work, we should be aware that race-based data can perpetuate stereotypes and fuel racism. During the Covid-19 pandemic, Sachil Singh (2020) warned of the dangers of collecting race-based data. If data showed that most positive cases of coronavirus in Canada were among people of a particular race, it could have served to plan effective interventions and curtail COVID-19 spread, but it could also have made health care workers more wary of treating people of that race, and exposed people of that race to racist attacks. Another consideration is that a person’s race may not be easy to define.
As we mentioned above, the Census records Canadians “Aboriginal Identity” (or lack thereof) every five years, and aggregates this by community. It also records languages spoken at home, country of origin by immigrants, how long they’ve been in Canada, and income, education, housing and other socioeconomic variables. Using the Census, we can find where Indigenous people live, and we can compare the income of the communities where they are a majority to the income of non-Indigenous communities.
The Geographic Distribution of Indigenous People in Canada
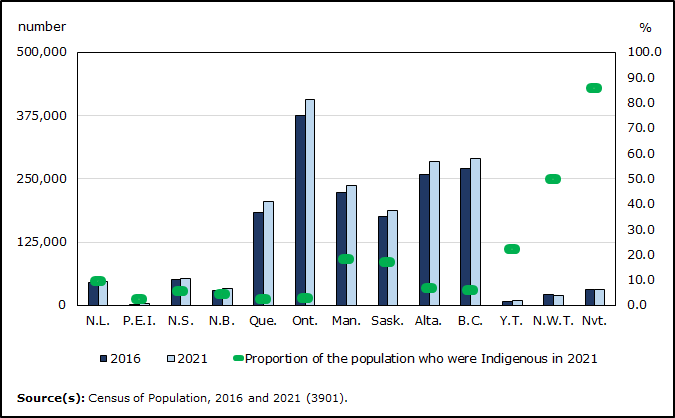
The graph below, based on 2021 Census data, shows that most Indigenous people are living where most Canadians live – in the more populous provinces, which have the biggest cities. The Inuit, though few in number, form a large majority of the population in Nunavut, while First Nations make up a large fraction of the population in the Yukon and Northwest Territory. Typically, the further north one goes, the greater the fraction of the population which is Indigenous.
We see that, in Manitoba and Saskatchewan, a larger fraction of the population is Indigenous than in the other southern provinces.
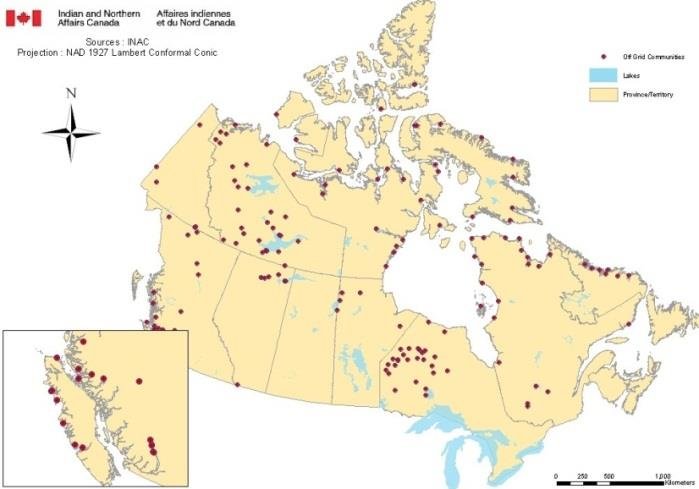
The 2007 map below shows more remote Indigenous communities which at that time had to generate their own electricity, usually from diesel generators. About 140,000 people lived in these communities (Van Vliet (2009)), representing about eleven percent of Indigenous people living in Canada at the time. Although the map is old, it is still an accurate representation of the distribution of northern Indigenous communities.
In 2016, the remotest 138,000 Indigenous people living in Indigenous-majority communities were living in communities with average populations of 668 people [4], but that was about equal to the average community size (659), whether northern or southern. The average remoteness score over all Indigenous-majority communities was 0.48, similar to that of Montreal Lake 106, a place two-and-a-half hours north of Saskatoon and one hour north of Prince Albert, Saskatchewan. The median remoteness score was almost identical, 0.47.
Material Well-Being in Indigenous Communities
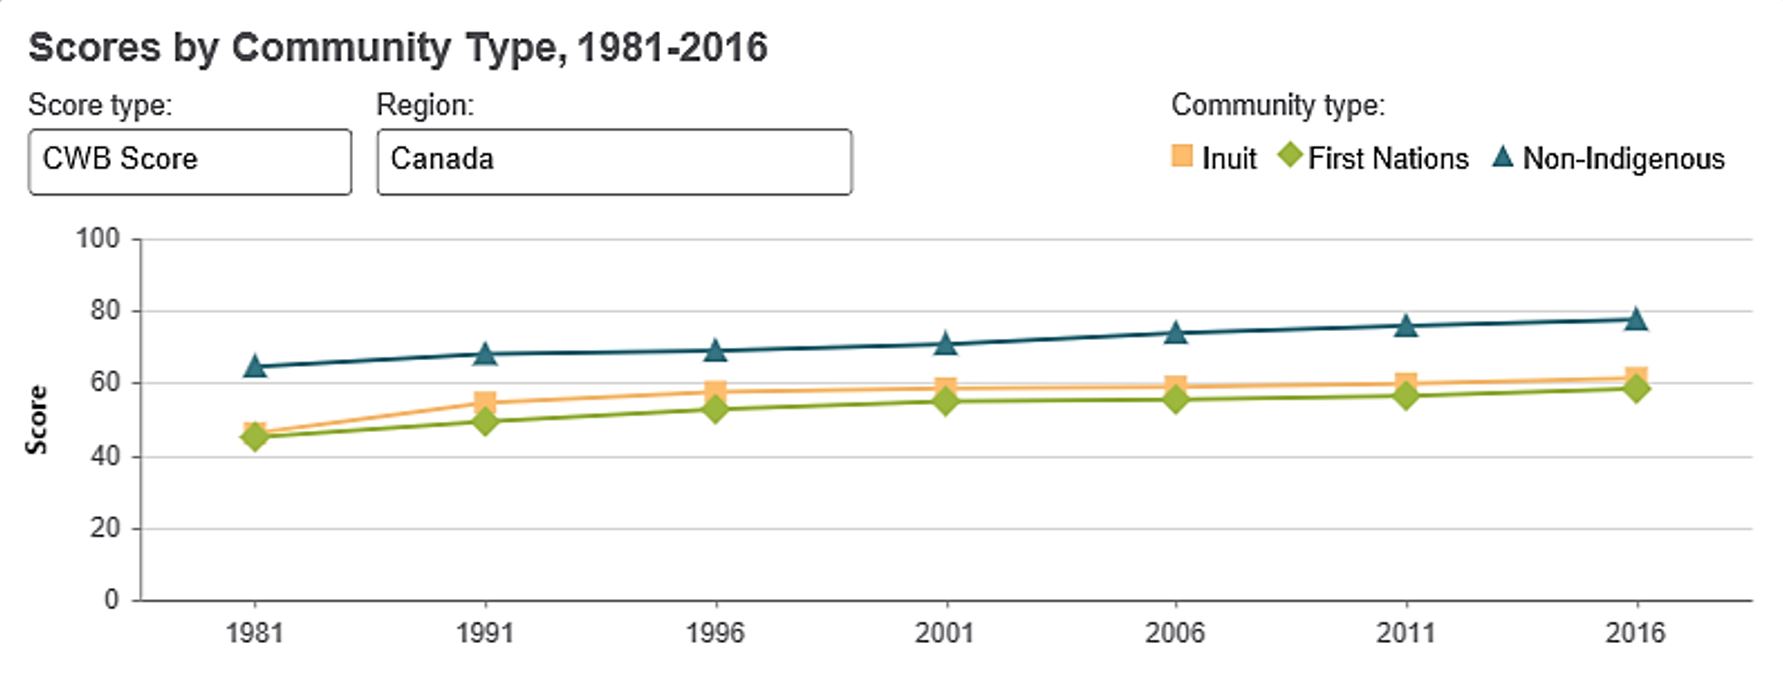
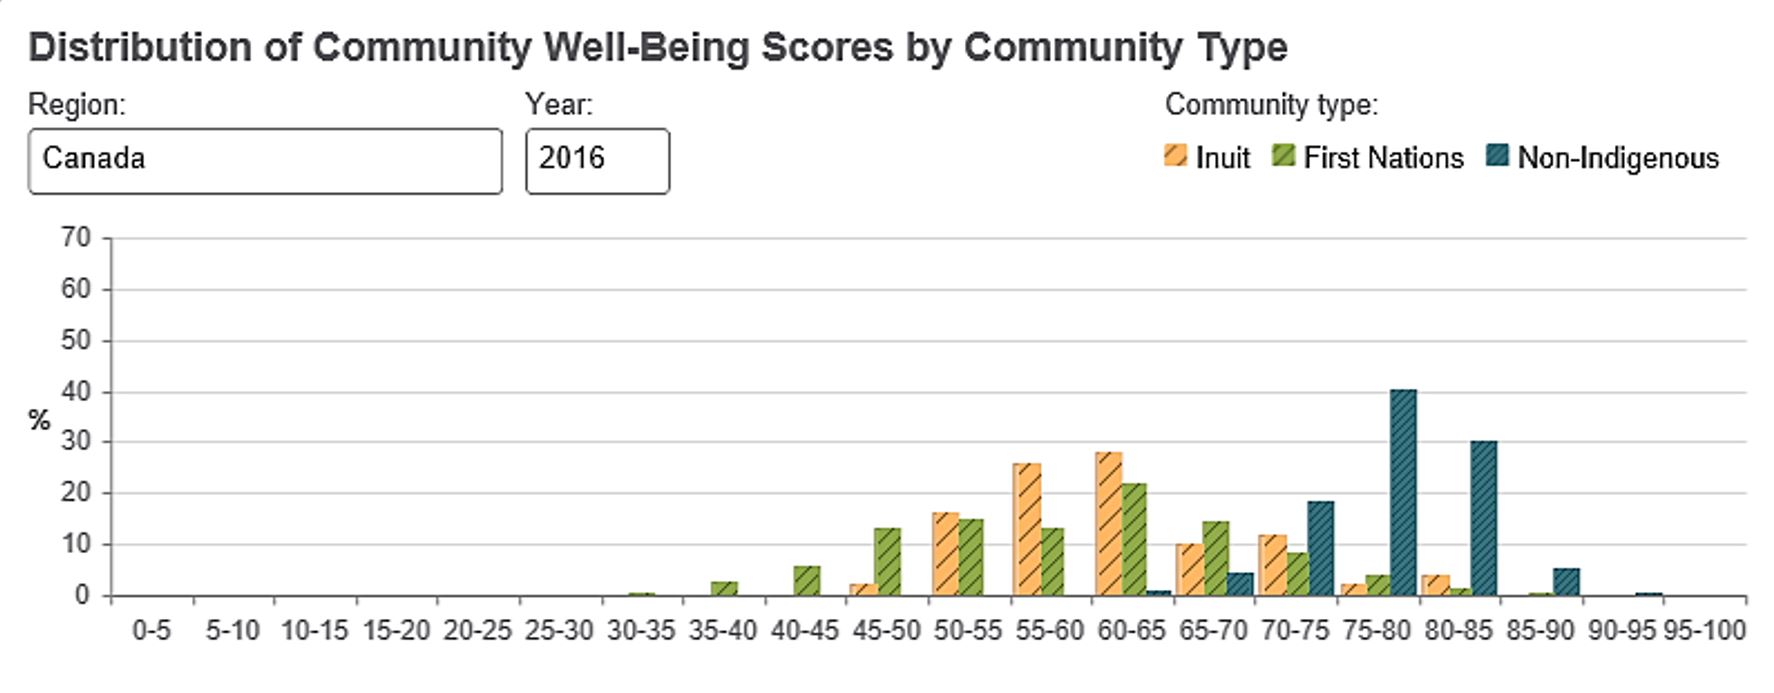
Since 1981 the federal government has used census data to compute the Community Well-Being Index (CWB) for reserves and for non-reserves in Canada. The CWB is a score which is based equally on a community’s income, its educational achievement, its housing, and its employment. Each of these in turn is an index of subcategories; for example, educational achievement is a weighted average of the proportion of the population over age 15 that graduated from grade 9 and the proportion over age 20 that graduated from high school.
The Tables below compare the CWB scores for participating First Nations and Municipalities. Not all First Nations participate in the Census, on which data the CWB score is based.
As of late December 2023, the 2016 score was the most recent available.
Source: Indigenous Services Canada (2019c) Access 90 Open

Criticisms of the Community Well-Being Index:
In his 2018 report, Socio-economic Gaps on First Nations Reserves, the Auditor General of Canada criticized the government for continuing to use the Community Well-Being Index, which was developed without consulting First Nations, and which leaves out important indicators of well-being such as health and culture. It seems to us that mortality rates and incarceration rates should be included as well. The 2022 National Indigenous Economic Strategy for Canada (NIEDB et al, p. 40) recommends including infrastructure, training, and health.
The Auditor General noted that First Nations are required to provide reams and reams of data to Ottawa, but much of this data is not analyzed; when it is analyzed, the results are not shared with First Nations. He also found that the federal government has not meaningfully and regularly engaged with First Nations to see whether the quality of life is improving.
Poverty Data:
“Canada is not tracking First Nations poverty on-reserve, so we did,” said Assembly of First Nations National Chief Perry Bellegarde regarding a study produced in 2019 by the Assembly of First Nations, the Canadian Center for Policy Alternatives, and Upstream. The report collected census data on income, number of children in the family, and indigeneity to compute child poverty rates. Statistics Canada cooperated by calculating poverty lines for reserves, something it does not normally publish. As the next Table shows, child poverty rates increase as they approach the least advantaged group, Status persons living on reserve.
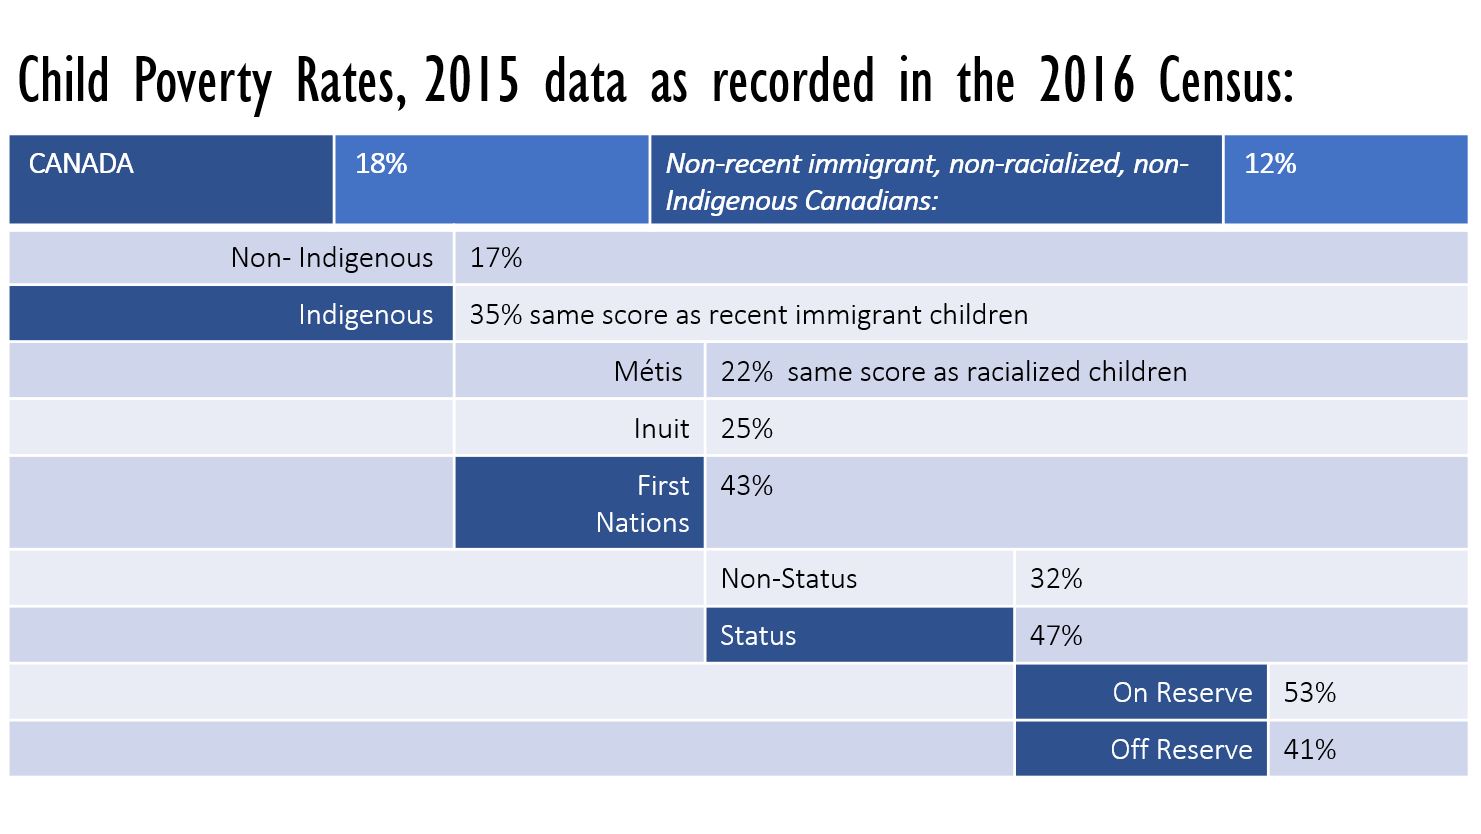
The authors of this report make some recommendations, including that poverty lines be applied on reserves as a matter of course; that, with permission of First Nations governments, income and poverty should be measured annually, not just in census years; and that the federal government should commit to reducing poverty on reserves by the same percentages as announced in its 2018 federal poverty reduction strategy, An Act Respecting the Reduction of Poverty. These poverty data provide a strong motivation to study the Economics of Indigenous Communities.
Indigenous Vital Statistics
As of 2020, Canada does not collect birth or death statistics by race or ethnicity. Despite that, we can figure out that Indigenous people on average are facing higher mortality rates. Because the Census shows us that the Indigenous population is growing faster than the non-Indigenous population, we can infer that Indigenous people on average are having more children than non-Indigenous people.
Evidence of higher death rates
Statisticians have linked various surveys together to infer death rates by race. Since the surveys do not adequately report births, which are needed to compute infant mortality, the researchers have computed life expectancy at age 1, rather than life expectancy at birth. This 2011 data is still the most recent available as of late 2023.

We see a significant difference in life expectancies, close to ten years’ reduction in the case of First Nations and Inuit. Note also that, if we could observe life expectancy at birth, we might see a “Paradox of the Life Table” whereby, due to high rates of infant mortality, life years remaining at age 1 is a larger number than life years remaining at birth. This was the case in 2011 for Nunavut, where 85% of the population is Inuit.
Randy Akee and Donn Feir (2016, 2018) used the federal government’s own Status Indian Register to compute mortality rates for Status Indians ages 5- 64. Akee and Feir found large discrepancies between the mortality rates of Status persons and the overall Canadian population, worse than those in the United States between Native Americans or African Americans and non-Hispanic Whites.
They found that, between 2010 and 2013, mortality rates among female Status Indians were 3-4 x higher than the rates for Canadian females generally, 5x in the case of young women ages 15-19 living on reserve. “Our estimate of excess mortality for Status women and girls is almost three times the number of all missing and murdered Indigenous women and girls reported by the RCMP.”
While this is terrible, take comfort in the fact that the mortality rate for Canadian females generally is very low, so even a 5x higher rate is still very low.
Akee and Feir found that there had been no improvement in the Indigenous female mortality rate in thirty years.
The mortality rates for Status males was 2-3 x higher than for Canadian males generally. Because of high rates of incarceration and homelessness, as well as higher death rates for men than for women, there were only 85 Status men aged 20-55 for every 100 Status women aged 20-55.
Akee and Feir (2016) found that First Nations communities with a lower ratio of men to women had higher mortality for women. The gender gap likely leads to worse outcomes for children as well, and a higher rate of out-marriage of Status women, which makes it more likely that children will lose Status.
Previous studies summarized by Akee and Feir (2018) show that between 50-70 percent of the extra deaths experienced by the Status population are due to endocrine disease, digestive system disease, and deaths from external causes. The higher mortality rates are correlated with differences in income, education, occupation, and urban residence (Tjepkema et. al, 2009), explaining two thirds of the difference in mortality rates for men ages 25-75, but less than one third of the difference for women in that age group. We should also make note of suicide rates, which are five to six times higher for First Nations youth (ages 15-24) compared to non-Indigenous youth.
Good news: Population Growth
Over the five-year period between 2016 and 2021, the number of Canadians identifying as First Nations grew 10%; as Métis, 6%; and as Inuit, 8.5% while the non-Indigenous population grew 5.3%.;[5]. Some of this is a greater desire to embrace Indigenous ancestry. The population of people identifying as Status First Nations, something that is certifiable, grew 1.1% over five years, a significant slowing down. 753,110 people identified only as Status First Nations in 2021 compared to 744,855 in 2016.
Population growth represents resilience in the face of difficulties, difficulties such as the higher death rates and the relative poverty we have documented. This population growth is a marked contrast to what occurred during the first 300 years of colonization.
It is estimated that in 1600, when sustained contact with Europe began, there were between 350,000 and 500,000 Indigenous people in Canada[6], and possibly more. Indeed, the population might have been 1.2 million[7] or higher, but this seems less likely to the author, given the topography and climate of Canada, the observations of newcomers, and the lack of organized resistance. By 1900, however, the Indigenous population was estimated at a mere 130,000, which means that the Indigenous population declined at least 50% over the three hundred year period.[8]
Morency, Caron-Malenfant, and Daignault (2018) provide some estimates of Indigenous fertility, particularly the Total Fertility Rate. The Total Fertility Rate (TFR) is a projection of how many live births each woman will experience if she proceeds through her child-bearing years at today’s age-specific fertility rates. In 2011, when Canada’s TFR was 1.61 children per woman, the TFR for Status Indian women was 2.63 children per woman, 3.25 if living on reserve. The TFR for women identifying as First Nation but without Status was 1.47 children per woman, and the TFR for self-identified Métis women was 1.81 children per woman. The TFR for Inuit generally was 2.75 children per woman, with records collected by Nunavut and the North-West Territories indicating a TFR of 3.02 children per Inuit woman living there.
Higher TFRs can be attributed to several factors, including cultural norms, traditional values, fear of some children not surviving to adulthood, and lack of education or career opportunities for women.
The Consequences of Higher Fertility & Population Growth:
High fertility and population growth bring both economic opportunities and economic challenges. While spending on children’s health and education is a wise investment in the children’s future, that spending comes at the expense of current investments in infrastructure, environmental clean-up, adult education, research, and other things that would promote economic growth and prosperity more immediately. Also, a larger ratio of children to adults means that existing income is spread over a large number of dependents, reducing the standard of living in the short run.
A growing population may put more pressures on reserves than non-reserves, because infrastructure is limiting; or it may relieve pressures, because transfers from the federal government to reserve are often based on the number of band members, reserve residents, or children on reserve. Hillel (2019) found that having younger populations was positively correlated with income growth and
wellbeing on non-reserve communities in Alberta, but not on reserves. On reserves, median age was positively correlated with income growth and wellbeing. On reserve, having more adults and elders surviving can be a sign of prosperity and wellbeing and can contribute to the wellbeing of children and youth. Income growth can mean job opportunities which make raising children more challenging in terms of time needed to care for children.
Indigenous population growth can give a community greater political voice. It spreads the costs of public goods (like schools) over more individuals. It provides an ever-larger workforce which will, in the context of Canada’s expected labour force decline, benefit from rising wages and higher job vacancies. The Indigenous population is younger and growing faster and will furnish an increasing proportion of Canada’s labour force. In 2016 the average age of Indigenous individuals was 32.1 compared to 40.9 for Canada as a whole.
A Note on the Demographic Future of Reserves:
The First Nation population has been growing both on reserve (12.8% between 2006 and 2016) and off-reserve (49.1%).[9] Amorevieta, Bourbeau and Robitaille (2015) find that the higher off-reserve growth is due to those people identifying as First Nation for the first time, or re-gaining Status they lost (see Chapter 11). They find that migration in and out of reserves is low, and that there are in fact more people moving to reserves than leaving reserves.
Ultimately, the survival of Indigenous Peoples is not tied to legal status or to their presence on the reserve lands others have designated for them. The true test of the survival of First Nations, Métis, and Inuit is that they flourish in body and spirit, interpreting their heritage and their future for themselves, equipped to protect the people and lands they value.
Now that we have a feel for the current demographic and economic situation of Indigenous peoples in Canada, let’s learn how things came to be this way, beginning with an examination of Indigenous economies before European contact.
- Trevethan (2019) QMR Consulting, Indigenous Services Canada & AFN ↵
- Office of the Auditor General (2018) ↵
- Indigenous Services Canada (2018) ↵
- author's calculations using 660 communities for which a remoteness score was available ↵
- Statistics Canada (21/09/2022) ↵
- "Demography of Indigenous Peoples - Historical Population Estimates," in The Canadian Encyclopedia (2023) ↵
- This is a rough median of many estimates that have been made, assuming present-day Canada's population was 10% of North America’s. ↵
- Historical Atlas of Canada (1993) ↵
- Statistics Canada (2017) ↵
The Canadian census is a comprehensive survey of the entire population within Canada's borders. It takes place every five years. The most recent census at the time of this book's publication was 2021.
This word has been replaced by the word "Indigenous" except for legal purposes. It has the same meaning.
As described in Chapter 2, the CWB is an index number that scores communities on their housing quality, educational achievement, employment, and income.
The Auditor General of Canada serves to impartially evaluate the efficacy of the federal government's spending and the accuracy of its financial statements.

