1. RELATIONAL DATABASES AND MS ACCESS
1.1 Relational Databases
Relational Databases were introduced by E. F. Codd in 19691; Codd’s 1970 paper2 is considered one of the great papers in Computer Science.
We begin with a very small example: a database with one relation, the list of employees shown in figure 1.1. You should notice this looks just like a two-dimensional table of rows and columns. The name of the table is Employees, each column of the table has its own title, and each row has the same structure. Each row has a value for employee number, first name, last name, and gender. As tables of data appear in so many places (newspaper articles, textbooks, web pages, etc.) it is very likely you have seen and used this representation for data previously.
|
Employee ID |
First Name |
Last Name |
Gender |
|
123 |
Joe |
Smith |
Male |
|
333 |
Jim |
Jones |
Male |
|
456 |
April |
Smith |
Female |
|
842 |
Jenny |
Jones |
Female |
|
777 |
Tom |
Lee |
Male |
Figure 1.1: A list of employees
Let us assume the Employees table in figure 1.1 has one row for each employee who works for some hypothetical company. Data kept for each employee comprises their employee identification number, their first and last names, and their gender. Information structured in tables is very concise; at a glance we can obtain useful information.
According to the database design methodology in Information Modeling and Relational Databases3, a database designer must be able to express structured information as verbalizations. A verbalization that fits the information in one row of the Employees table is:
-
-
- Employee with ID … has a first name …, a last name …, and is of … gender
-
In verbalizations like this the ellipses are placeholders: we can use values from a single row to create complete statements that explain the meaning of a row. For example,
-
-
- Employee with ID 123 has a first name Joe, a last name Smith, and is of Male gender
- Employee with ID 333 has a first name Jim, a last name Jones, and is of Male gender
-
A similar approach to organizing knowledge about data appears in the literature on literacy. In the Journal of Reading several articles by Kirsch and Mosenthal discuss the organization of information and its conceptualization as document sentences. In Building Documents by Combining Simple Lists4, Kirsch and Mosenthal present an example based on information from The World Almanac and Book of Facts: 1980 (Newspaper Enterprise Association, p. 427). That data is reproduced in figure 1.2.
|
Magazines |
Circulation |
|
TV Guide |
19,547,763 |
|
Reader’s Digest |
18,094,192 |
|
National Geographic |
10, 249,748 |
|
Better Homes & Gardens |
8,007,202 |
|
Family Circle |
7,611,578 |
|
Woman ‘s Day |
7,535,855 |
|
McCall’s |
6,502,880 |
Figure 1.2: Circulation of leading U.S. magazines
A major point the authors make is that such information can be re-conceptualized as a series of simple document sentences formed from a basic document sentence. This document sentence expresses an understanding of the tabular data in natural language.
The document sentence for figure 1.2 is:
-
-
- Magazine X has a circulation of Y.
-
Kirsch and Mosenthal use variables (X and Y) to stand for data that comes from a table. Taking values from a row, we plug values for X and Y into the document sentence to obtain sentence instantiations:
-
-
- TV Guide has a circulation of 19,547,763.
- Reader’s Digest has a circulation of 18,094,192.
- National Geographic has a circulation of 10,249,748.
- Better Homes & Gardens has a circulation of 8,007,202.
- Family Circle has a circulation of 7,611,578.
- Woman’s Day has a circulation of 7,535,855.
- McCall’s has a circulation of 6,502,880.
-
Document sentences and verbalization sentences are essentially the same. Both sentences use natural language to express in words the meaning of tabular data. Whether one is designing databases or reading structured information, it can be useful for understanding to re-formulate data as statements in natural language.
Let us be a bit formal for a moment. Commercial relational database systems are systems where data is organized into relations. Figure 1.3 shows the general structure of a relation. We say a relation comprises a set of tuples where each tuple has the same number of attribute values, where each attribute value is taken from some corresponding domain, and where a domain represents a set of valid values for an attribute.
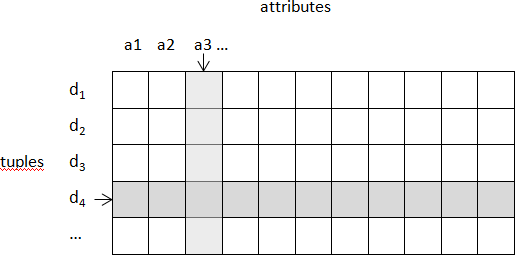
The Employees table in figure 1.1 can be considered a relation of 5 tuples where each tuple has 4 values drawn from each of the employee identifier, first name, last name, and gender domains. Similarly, we can say the lists comprising the Circulation of leading U.S. Magazines in figure 1.2 can be considered a relation with 7 tuples each having 2 attribute values.
Relations are typically implemented in commercial databases as tabular structures comprising rows and a fixed number of columns. Everybody is familiar with tables as they are commonplace in textbooks, papers, magazines, etc. This simplicity of representation is one reason why relational databases have been very successful as repositories for important data.
Exercises
To design a database, a database engineer needs to find good representations of how an organization uses data. Good sources include input forms, reports, web pages, etc. A challenge for database designers is to find these sources and interpret them.
1) Consider the following table of product information sold by ABC Foods. Verbalize the information presented.
|
Product ID |
Product Name |
Unit Price |
Units In–Stock |
|
1 |
Black Tea |
$2.00 |
44 |
|
2 |
Green Tea |
$3.00 |
33 |
|
3 |
Vegetarian Lasagne |
$10.00 |
20 |
|
4 |
Cajun Seasoning |
$11.00 |
29 |
|
5 |
Cranberry Sauce |
$21.00 |
0 |
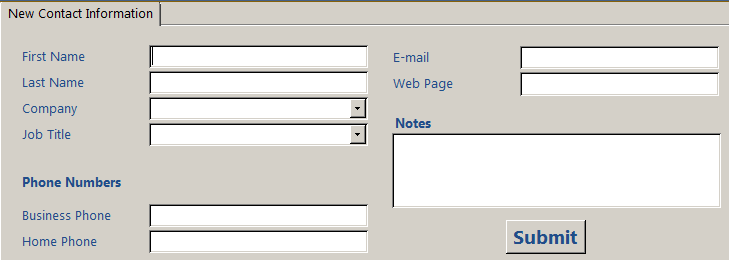
2) Suppose the following input form is used to enter contact information. Verbalize the information that is being collected:
3) Consider the following report that the Human Resources department of ABC Foods must produce. Verbalize the information in that report.
|
Employee ID |
First Name |
Last Name |
Department |
|
1 |
John |
Smith |
Receiving |
|
2 |
Lee |
Daniels |
Sales |
|
3 |
April |
Turner |
Sales |
|
4 |
Thomas |
Trump |
Marketing |
|
5 |
Lee |
Smith |
Marketing |
