3.3 Graphing Functions Using Reflections about the Axes
Another transformation that can be applied to a function is a reflection over the x– or y-axis. A vertical reflection reflects a graph vertically across the x-axis, while a horizontal reflection reflects a graph horizontally across the y-axis. The reflections are shown in Figure 3-9.
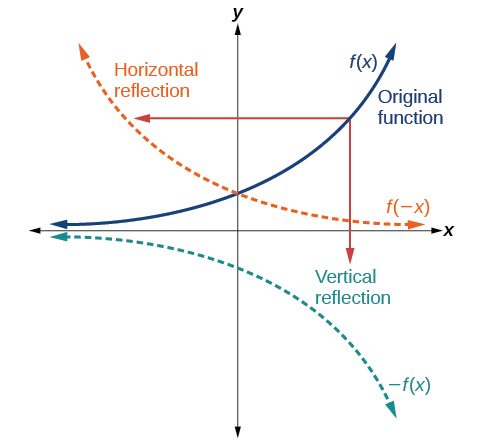
Notice that the vertical reflection produces a new graph that is a mirror image of the base or original graph about the x-axis. The horizontal reflection produces a new graph that is a mirror image of the base or original graph about the y-axis.
Reflections
Given a function [latex]\text{}f\left(x\right)[/latex], a new function [latex]\text{}g\left(x\right)=-f\left(x\right)\text{}[/latex] is a vertical reflection of the function [latex]\text{}f\left(x\right)\text{}[/latex], sometimes called a reflection about (or over, or through) the x-axis.
Given a function [latex]\text{}f\left(x\right)\text{}[/latex], a new function [latex]\text{}g\left(x\right)=f\left(-x\right)\text{}[/latex] is a horizontal reflection of the function [latex]\text{}f\left(x\right)\text{}[/latex], sometimes called a reflection about the y-axis.
How To
Given a function, reflect the graph both vertically and horizontally.
- Multiply all outputs by –1 for a vertical reflection. The new graph is a reflection of the original graph about the x-axis.
- Multiply all inputs by –1 for a horizontal reflection. The new graph is a reflection of the original graph about the y-axis.
Example 1: Reflecting a Graph Horizontally and Vertically
- Reflect the graph of [latex]\text{}s\left(t\right)=\sqrt{t}[/latex] (a) vertically and (b) horizontally.
- Reflect the graph of [latex]\text{}f\left(x\right)=|x-1|[/latex] (a) vertically and (b) horizontally.
Example 2: Reflecting a Tabular Function Horizontally and Vertically
1. A function [latex]\text{}f\left(x\right)\text{}[/latex] is given as Table 3. Create a table for the functions below.
- [latex]\text{}g\left(x\right)=-f\left(x\right)[/latex]
- [latex]\text{}h\left(x\right)=f\left(-x\right)[/latex]
| [latex]x[/latex] | 2 | 4 | 6 | 8 |
|---|---|---|---|---|
| [latex]f\left(x\right)[/latex] | 1 | 3 | 7 | 11 |
2. A function [latex]\text{}f\left(x\right)\text{}[/latex] is given as Table 4. Create a table for the functions below.
- [latex]g\left(x\right)=-f\left(x\right)[/latex]
- [latex]h\left(x\right)=f\left(-x\right)[/latex]
| [latex]x[/latex] | −2 | 0 | 2 | 4 |
|---|---|---|---|---|
| [latex]f\left(x\right)[/latex] | 5 | 10 | 15 | 20 |
Example 3: Applying a Learning Model Equation
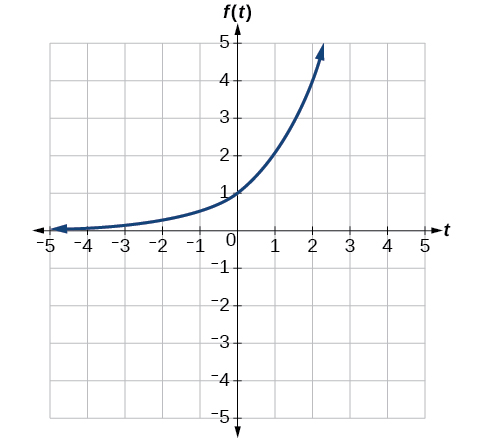
A common model for learning has an equation similar to [latex]k\left(t\right)=-{2}^{-t}+1,\text{}[/latex] where [latex]k[/latex] is the percentage of mastery that can be achieved after [latex]t[/latex] practice sessions. This is a transformation of the function [latex]f\left(t\right)={2}^{t}[/latex] shown in Figure 3-10. Sketch a graph of [latex]k\left(t\right)[/latex].
Analysis
As a model for learning, this function would be limited to a domain of [latex]\text{}t\ge 0\text{}[/latex], with corresponding range [latex]\text{}\left[0,1\right)[/latex].
Example 4: Graphing Functions
Given the toolkit function [latex]\text{}f\left(x\right)={x}^{2},\text{}[/latex] graph [latex]\text{}g\left(x\right)=-f\left(x\right)\text{}[/latex] and [latex]\text{}h\left(x\right)=f\left(-x\right)\text{}[/latex]. Take note of any surprising behaviour for these functions.
Access for free at https://openstax.org/books/precalculus/pages/1-introduction-to-functions
