2.6 Graphing Piecewise-Defined Functions
Sometimes, we come across a function that requires more than one formula in order to obtain the given output. For example, in the toolkit functions, we introduced the absolute value function [latex]\text{}f\left(x\right)=|x|\text{}[/latex]. With a domain of all real numbers and a range of values greater than or equal to 0, absolute value can be defined as the magnitude, or modulus, of a real number value regardless of sign. It is the distance from 0 on the number line. All of these definitions require the output to be greater than or equal to 0.
If we input 0, or a positive value, the output is the same as the input.
[latex]f\left(x\right)=x\text{}\text{ if }\text{}x\ge 0[/latex]
If we input a negative value, the output is the opposite of the input.
[latex]f\left(x\right)=-x\text{}\text{ if }\text{}x<0[/latex]
Because this requires two different processes or pieces, the absolute value function is an example of a piecewise function. A piecewise function is a function in which more than one formula is used to define the output over different pieces of the domain.
We use piecewise functions to describe situations in which a rule or relationship changes as the input value crosses certain “boundaries.” For example, we often encounter situations in business for which the cost per piece of a certain item is discounted once the number ordered exceeds a certain value. Tax brackets are another real-world example of piecewise functions. For example, consider a simple tax system in which incomes up to $10,000 are taxed at 10%, and any additional income is taxed at 20%. The tax on a total income [latex]\text{}S\text{}[/latex] would be [latex]\text{}0.1S\text{}[/latex] if [latex]\text{}S\le \text\$10\text{,}000\text{}[/latex] and [latex]\text{}\text\$1000+0.2\left(S-\text\$10\text{,}000\right)\text{}[/latex] if [latex]\text{}S>\text\$10\text{,}000[/latex].
Piecewise Function
A piecewise function is a function in which more than one formula is used to define the output. Each formula has its own domain, and the domain of the function is the union of all these smaller domains. We notate this idea like this:
[latex]f\left(x\right)\left\{\begin{array}{lc}formula\;1&if\;x\;is\;in\;domain\;1\\formula\;2&if\;x\;is\;in\;domain\;2\\formula\;3&if\;x\;is\;in\;domain\;3\end{array}\right.[/latex]
In piecewise notation, the absolute value function is
[latex]\left|x\right|=\left\{\begin{array}{lc}x\;if\;x&\geq0\\-x\;if\;x&<0\end{array}\right.[/latex]
How To
Given a piecewise function, write the formula and identify the domain for each interval.
- Identify the intervals for which different rules apply.
- Determine formulas that describe how to calculate an output from an input in each interval.
- Use braces and if-statements to write the function.
Example 1: Writing a Piecewise Function
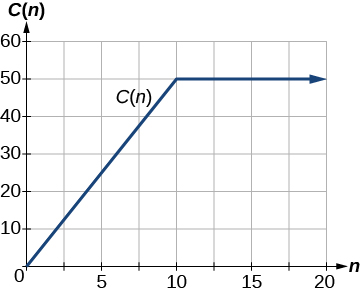
A museum charges $5 per person for a guided tour with a group of 1 to 9 people or a fixed $50 fee for a group of 10 or more people. Write a function relating the number of people, [latex]\text{}n\text{}[/latex], to the cost, [latex]\text{}C[/latex].
Analysis
The function is represented in Figure 2-20. The graph is a diagonal line from [latex]\text{}n=0\text{}[/latex] to [latex]\text{}n=10\text{}[/latex] and a constant after that. In this example, the two formulas agree at the meeting point where [latex]\text{}n=10,\text{}[/latex] but not all piecewise functions have this property.
Example 2: Working with a Piecewise Function
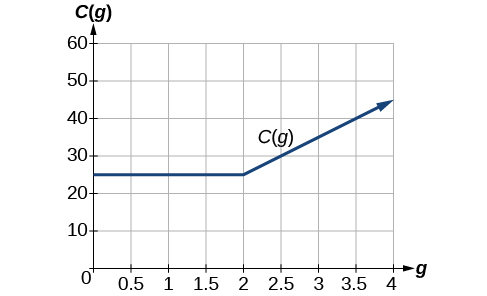
A cell phone company uses the function below to determine the cost, [latex]\text{}C,\text{}[/latex] in dollars for [latex]\text{}g\text{}[/latex] gigabytes of data transfer.
Find the cost of using 1.5 gigabytes of data and the cost of using 4 gigabytes of data.
Analysis
The function is represented in Figure 2-21. We can see where the function changes from a constant to a shifted and stretched identity at [latex]\text{}g=2\text{}[/latex]. We plot the graphs for the different formulas on a common set of axes, making sure each formula is applied on its proper domain.
How To
Given a piecewise function, sketch a graph.
- Indicate on the x-axis the boundaries defined by the intervals on each piece of the domain.
- For each piece of the domain, graph on that interval using the corresponding equation pertaining to that piece. Do not graph two functions over one interval because it would violate the criteria of a function.
Example 3: Graphing a Piecewise Function
Sketch a graph of the function.
Analysis
Note that the graph does pass the vertical line test even at [latex]\text{}x=1\text{}[/latex] and [latex]\text{}x=2\text{}[/latex] because the points [latex]\left(1,3\right)[/latex] and [latex]\left(2,2\right)[/latex] are not part of the graph of the function, though [latex]\left(1,1\right)[/latex] and [latex]\left(2,\text{}3\right)[/latex] are.
Example 4: Graphing a Piecewise Function
Question & Answer
Can more than one formula from a piecewise function be applied to a value in the domain?
No. Each value corresponds to one equation in a piecewise formula.
Access for free at https://openstax.org/books/precalculus/pages/1-introduction-to-functions
