2.9 Chapter 2 Example Solutions
2.2 Example Solutions
Example 1: Finding the Domain of a Function as a Set of Ordered Pairs
First identify the input values. The input value is the first coordinate in an ordered pair. There are no restrictions, as the ordered pairs are simply listed. The domain is the set of the first coordinates of the ordered pairs.
Example 2: Find the domain of the function
[latex]\{-5,0,5,10,15\}[/latex]
Example 3: Finding the Domain of a Function
-
The input value, shown by the variable [latex]x[/latex] in the equation, is squared and then the result is lowered by one. Any real number may be squared and then be lowered by one, so there are no restrictions on the domain of this function. The domain is the set of real numbers.
In interval form, the domain of [latex]f\;is\;(-\infty,\;\infty)[/latex].
-
[latex](\;-\infty\;,\;\infty\;)[/latex]
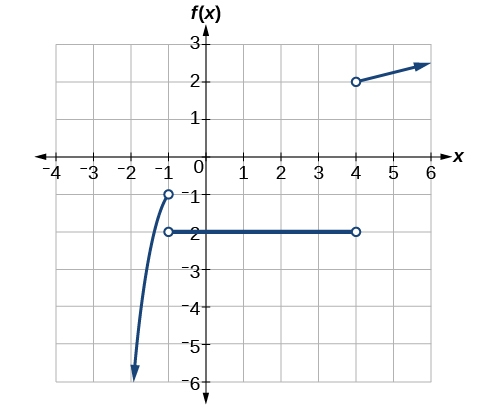
Example 4: Finding the Domain of a Function Involving a Denominator
-
When there is a denominator, we want to include only values of the input that do not force the denominator to be zero. So, we will set the denominator equal to 0 and solve for [latex]x[/latex].
[latex]2-x=0\\\;\;-x=-2\\\;\;\;\;\;\;x=2[/latex]
Now, we will exclude 2 from the domain. The answers are all real numbers where [latex]x<2[/latex] or [latex]x>2.[/latex]
We can use a symbol known as the union, [latex]\cup[/latex] to combine the two sets. In interval notation, we write the solution: [latex](\;-\infty\;,\;2\;)\;\cup\;(\;2\;,\;\infty\;)[/latex].
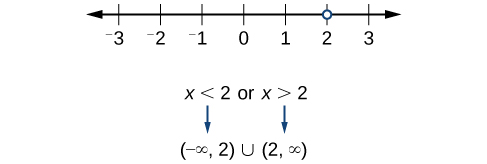
Figure 2-22 In interval form, the domain of [latex]f\;is\;(\;-\infty\;,\;2\;)\;\cup\;(\;2\;,\;\infty\;)[/latex]
- [latex](\;-\infty\;,\;\frac12\;)\;\cup\;(\;\frac12\;,\;\infty\;)[/latex]
Example 5: Finding the Domain of a Function with an Even Root
-
When there is an even root in the formula, we exclude any real numbers that result in a negative number in the radicand.
Set the radicand greater than or equal to zero and solve for[latex]x[/latex].
[latex]\begin{array}{l}7-x\ge 0\hfill \\ \text{}\text{}\text{}\text{}-x\ge -7\hfill \\ \text{}\text{}\text{}\text{}\text{}\text{}\text{}\text{}\text{}\text{}x\le 7\hfill \end{array}[/latex]
Now, we will exclude any number greater than 7 from the domain. The answers are all real numbers less than or equal to [latex]7\;or\;(-\infty\;,\;7\rbrack[/latex].
-
[latex]\lbrack\;-\frac52\;,\;\infty)[/latex]
2.3 Example Solutions
Example 1: Describing Sets on the Real-Number Line
-
To describe the values, [latex]\text{}x,\text{}[/latex]included in the intervals shown, we would say, “[latex]x\text{}[/latex] is a real number greater than or equal to 1 and less than or equal to 3, or a real number greater than 5.”
Inequality [latex]1\le x\le 3\text{}\text{ or }\text{}x>5[/latex] Set-builder notation [latex]\left\{x|1\le x\le 3\text{}\text{ or }\text{}x>5\right\}[/latex] Interval notation [latex]\left[1,3\right]\cup \left(5,\infty \right)[/latex] Remember that, when writing or reading interval notation, using a square bracket means the boundary is included in the set. Using a parenthesis means the boundary is not included in the set.
- values that are less than or equal to –2, or values that are greater than or equal to –1 and less than 3;
- [latex]\left\{x|x\le -2\text{}\text{ or }\text{}-1\le x<3\right\}[/latex] ;
- [latex]\left(-\infty ,-2\right]\cup \left[-1,3\right)[/latex]
2.4 Example Solutions
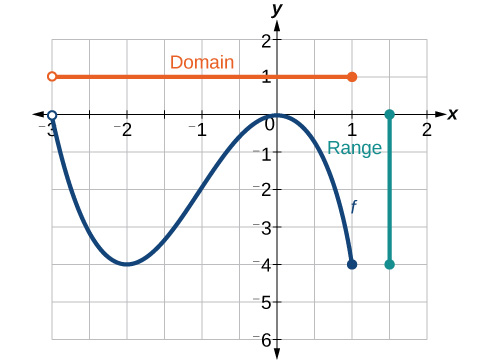
Example 1: Finding Domain and Range from a Graph
We can observe that the horizontal extent of the graph is –3 to 1, so the domain of [latex]\text{}f\text{}[/latex] is [latex]\text{}\left(-3,1\right][/latex].
The vertical extent of the graph is 0 to –4, so the range is [latex]\text{}\left[-4,0\right]\text{}[/latex]. See Figure 2-23.
Example 2: Finding Domain and Range from a Graph
-
The input quantity along the horizontal axis is “years,” which we represent with the variable [latex]\text{}t\text{}[/latex] for time. The output quantity is “thousands of barrels of oil per day,” which we represent with the variable [latex]\text{}b\text{}[/latex] for barrels. The graph may continue to the left and right beyond what is viewed, but based on the portion of the graph that is visible, we can determine the domain as [latex]\text{}1973\le t\le 2008\text{}[/latex] and the range as approximately [latex]\text{}180\le b\le 2010[/latex]
In interval notation, the domain is [1973, 2008], and the range is about [180, 2010]. For the domain and the range, we approximate the smallest and largest values since they do not fall exactly on the grid lines.
- domain =[1950, 2002] range = [47,000,000, 89,000,000]
2.5 Example Solutions
Example 1: Finding the Domain and Range Using Toolkit Functions
There are no restrictions on the domain, as any real number may be cubed and then subtracted from the result.
The domain is [latex]\text{}\left(-\infty ,\infty \right)\text{}[/latex] and the range is also [latex]\text{}\left(-\infty ,\infty \right)[/latex].
Example 2: Finding the Domain and Range
We cannot evaluate the function at [latex]\text{}-1\text{}[/latex] because division by zero is undefined. The domain is [latex]\text{}\left(-\infty ,-1\right)\cup \left(-1,\infty \right)\text{}[/latex]. Because the function is never zero, we exclude 0 from the range. The range is [latex]\text{}\left(-\infty ,0\right)\cup \left(0,\infty \right)[/latex].
Example 3: Finding the Domain and Range
We cannot take the square root of a negative number, so the value inside the radical must be nonnegative.
[latex]x+4\ge 0\text{ when }x\ge -4[/latex]
The domain of [latex]\text{}f\left(x\right)\text{}[/latex] is [latex]\text{}\left[-4,\infty \right)[/latex].
We then find the range. We know that [latex]\text{}f\left(-4\right)=0\text{}[/latex], and the function value increases as [latex]\text{}x\text{}[/latex] increases without any upper limit. We conclude that the range of [latex]\text{}f\text{}[/latex] is [latex]\text{}\left[0,\infty \right)[/latex].
Example 4: Finding the Domain and Range
domain: [latex]\text{}\left(-\infty ,2\right];\text{}[/latex] range: [latex]\text{}\left(-\infty ,0\right][/latex]
2.6 Example Solutions
Example 1: Writing a Piecewise Function
Two different formulas will be needed. For n-values under 10, [latex]\text{}C=5n\text{}[/latex]. For values of [latex]\text{}n\text{}[/latex] that are 10 or greater, [latex]\text{}C=50[/latex].
Example 2: Working with a Piecewise Function
To find the cost of using 1.5 gigabytes of data, [latex]\text{}C\left(1.5\right)\text{}[/latex], we first look to see which part of the domain our input falls in. Because 1.5 is less than 2, we use the first formula.
[latex]C\left(1.5\right)=\text\$25[/latex]
To find the cost of using 4 gigabytes of data, [latex]\text{}C\left(4\right)\text{}[/latex], we see that our input of 4 is greater than 2, so we use the second formula.
[latex]C\left(4\right)=25+10\left(4-2\right)=\text\$45[/latex]
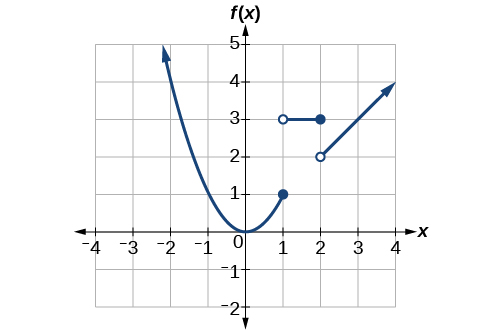
Example 3: Graphing a Piecewise Function
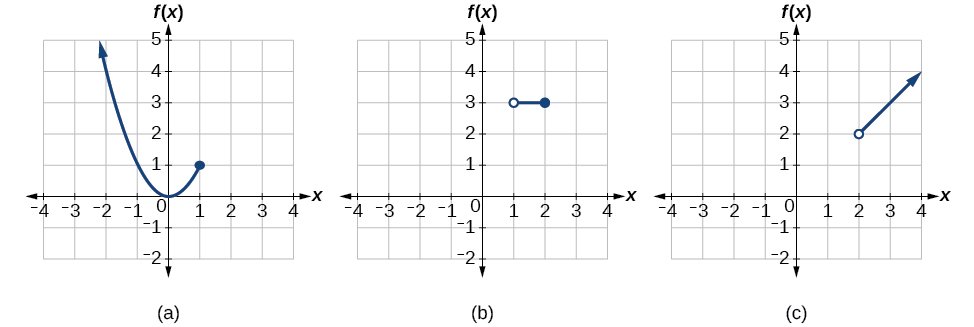
Each of the component functions is from our library of toolkit functions, so we know their shapes. We can imagine graphing each function and then limiting the graph to the indicated domain. At the endpoints of the domain, we draw open circles to indicate where the endpoint is not included because of a less-than or greater-than inequality; we draw a closed circle where the endpoint is included because of a less-than-or-equal-to or greater-than-or-equal-to inequality.
Figure 2-24 shows the three components of the piecewise function graphed on separate coordinate systems.
Now that we have sketched each piece individually, we combine them in the same coordinate plane. See Figure 2-25.
Example 4: Graphing a Piecewise Function